
Lacunar infarct and other types infarction also known as stroke
lacunar infarct brain MRI stroke
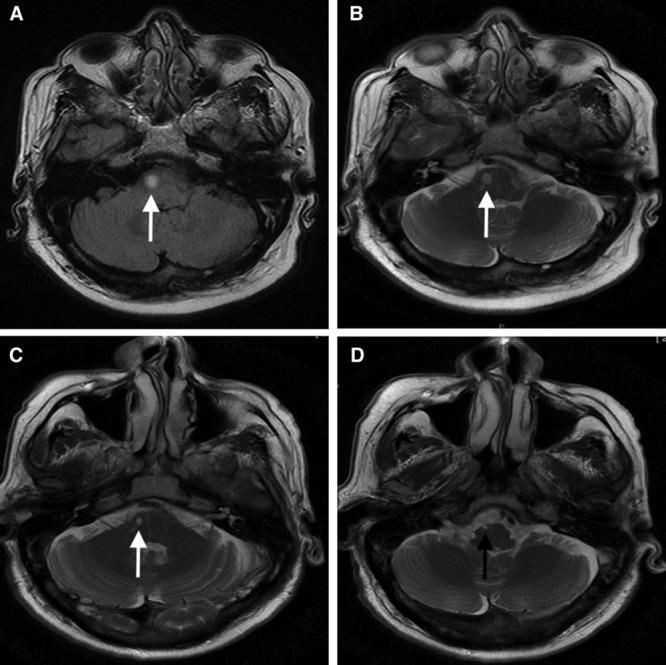
A comparison of axial brain MRI scans (FLAIR and T2-weighted sequences) illustrating the evolution of a lacunar infarct and subsequent white matter degeneration. Panels A and B show baseline imaging 11 days post-stroke, identifying a symptomatic hyperintense lacunar infarct in the right pons (white arrow). Panel C displays a follow-up T2-weighted image at one year, showing the lesion has transitioned into a cavitated lacunar stroke. Panel D, a more inferior axial slice from the follow-up study, demonstrates a distinct white matter hyperintensity (WMH) track (black arrow). This track appears as an elongated, bright signal following the descending white matter pathway proximal to the original infarct, indicative of Wallerian-like degeneration. This diagnostic series highlights the long-term structural changes in small vessel disease, specifically distinguishing between the primary cavitated lesion and secondary white matter tracks in the brainstem. It serves as an educational resource for neuroradiology and neurology trainees regarding stroke progression and neurodegenerative sequelae.
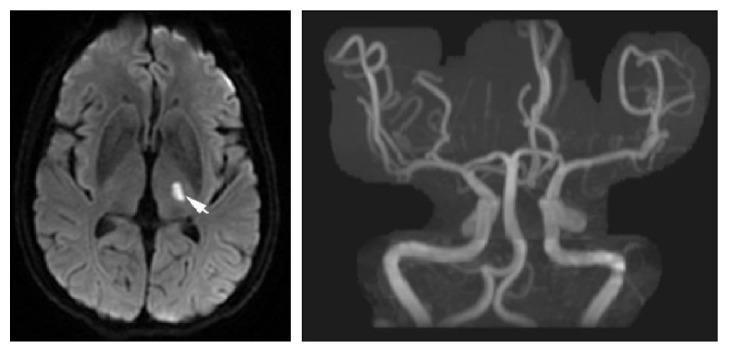
This composite diagnostic image illustrates a case of symptomatic lacunar ischemic stroke. The left panel shows an axial slice Diffusion-Weighted Imaging (DWI) MRI of the brain, featuring a well-circumscribed, hyperintense (bright) lesion. The lesion is located in the left deep white matter, specifically involving the posterior limb of the internal capsule or lateral aspect of the thalamus, indicated by a white arrow. This signal intensity represents restricted diffusion consistent with acute lacunar infarction. The right panel displays a Magnetic Resonance Angiography (MRA) of the intracranial vasculature, including the Circle of Willis and its major branches (middle, anterior, and posterior cerebral arteries). The MRA shows patent vessels with no evidence of large vessel occlusion, high-grade stenosis, or macrovascular disease. Together, these images demonstrate that the infarct resulted from small vessel disease (microatheroma or lipohyalinosis of a single perforating artery) rather than large artery thromboembolism.
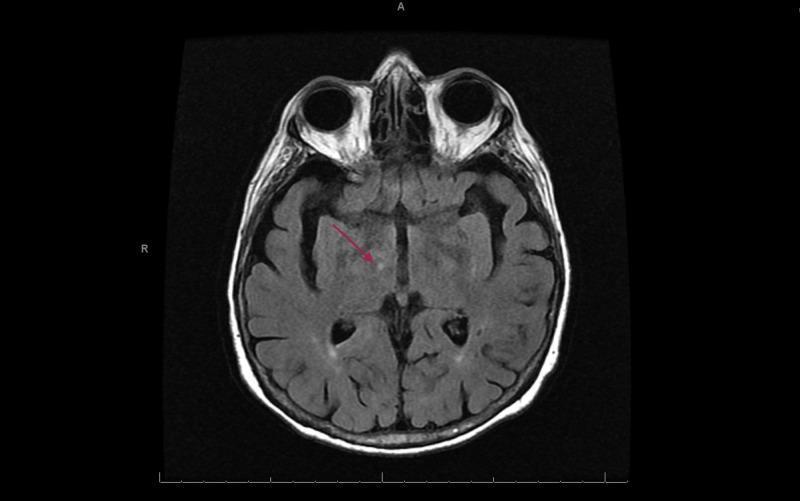
This diagnostic image is an axial T2-weighted (FLAIR-like) MRI of the brain, demonstrating a focal area of pathology. A red arrow points to a small, well-defined hyperintense signal abnormality located in the right thalamus. This lesion is characteristic of an acute to subacute lacunar infarct, a type of small vessel ischemic stroke. The surrounding neuroanatomy, including the basal ganglia, internal capsule, and ventricular system, appears structurally intact with preserved morphology. The image also captures the anterior orbital structures, including the globes and optic nerves. This clinical imaging is essential for medical students and neurology residents to identify the radiological presentation of deep gray matter ischemia and small vessel disease. The educational focus is on the localization of lacunar syndromes and the characteristic high-signal intensity on T2-weighted sequences during the acute phase of cerebral infarction.
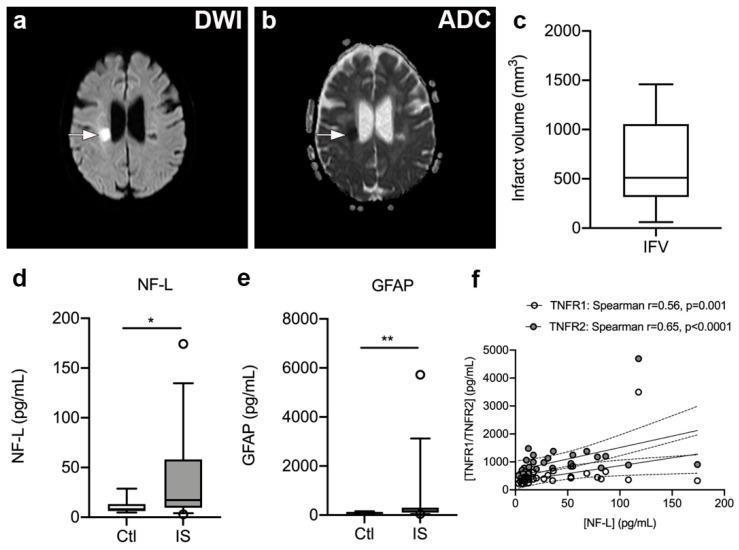
This composite image illustrates diagnostic findings and biomarker data from ischemic stroke (IS) patients. (a, b) Axial brain MRI scans showing a subcortical lacunar infarct in the right hemisphere. Panel (a) is a Diffusion-Weighted Imaging (DWI) sequence where the acute infarct appears as a bright hyperintense lesion (white arrow). Panel (b) is the corresponding Apparent Diffusion Coefficient (ADC) map, showing the same lesion as a dark hypointense area (white arrow), confirming restricted diffusion. (c) A box plot representing the infarct volume distribution (mm³) among IS patients. (d, e) Comparative box plots showing significantly elevated serum levels of Neurofilament light chain (NF-L) and Glial Fibrillary Acidic Protein (GFAP) in IS patients versus healthy controls (Ctl), indicating neuro-axonal and glial damage. (f) A correlation plot with linear regression and 95% confidence intervals demonstrating positive associations between serum NF-L and plasma TNFR1 and TNFR2 levels. These data illustrate the relationship between structural brain injury, inflammatory signaling, and biomarker release post-ischemic stroke.
types of stroke ischemic hemorrhagic diagram brain
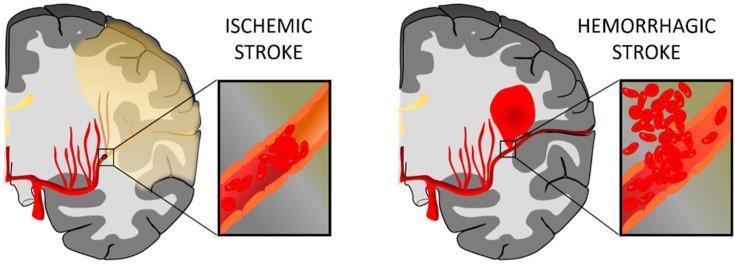
This medical illustration presents a side-by-side comparison of the two primary types of cerebrovascular accidents: Ischemic Stroke and Hemorrhagic Stroke. The diagram uses a coronal cross-section of the human brain and magnified insets to demonstrate the underlying pathophysiology. On the left, 'Ischemic Stroke' is depicted by a large yellowish-tan region in the cerebral cortex, representing infarcted tissue resulting from hypoperfusion. The inset reveals an intraluminal thrombus (blood clot) obstructing an artery, preventing distal blood flow. On the right, 'Hemorrhagic Stroke' is characterized by a focal, bright red intraparenchymal hematoma. The corresponding inset shows a ruptured vessel with erythrocytes extravasating into the surrounding brain tissue. Both illustrations highlight the middle cerebral artery territory. This anatomical diagram serves as an educational tool to differentiate between occlusive and hemorrhagic mechanisms of brain injury, emphasizing the clinical significance of vascular integrity and patency in maintaining cerebral blood flow.
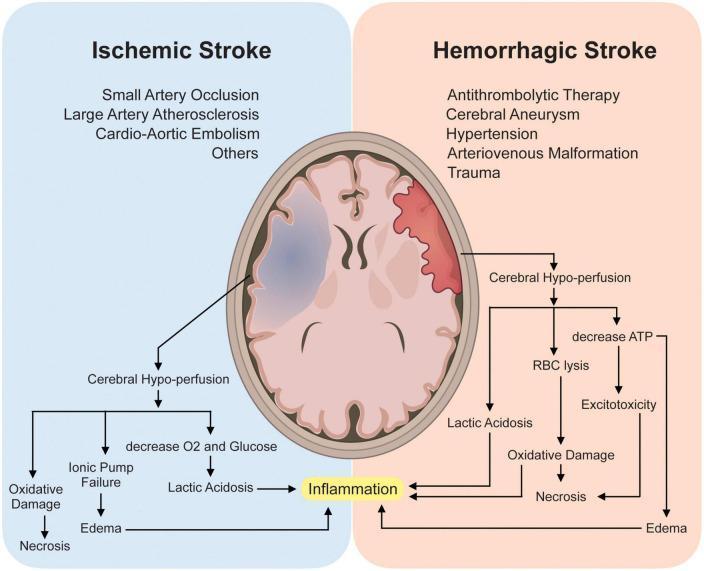
This medical infographic and pathophysiology flowchart compare Ischemic and Hemorrhagic stroke mechanisms. At the top, two axial brain illustrations highlight affected regions: a blue-shaded area in the left hemisphere represents ischemia, while a red-shaded area in the right hemisphere represents hemorrhage. Listed etiologies for Ischemic Stroke include small artery occlusion, large artery atherosclerosis, and cardio-aortic embolism. Hemorrhagic causes include antithrombolytic therapy, aneurysm, hypertension, arteriovenous malformation, and trauma. Below the illustrations, a logic flow depicts both conditions leading to cerebral hypo-perfusion. The ischemic pathway outlines oxygen/glucose deprivation, ionic pump failure, and lactic acidosis. The hemorrhagic pathway highlights red blood cell (RBC) lysis and ATP depletion. Both pathways converge on common secondary brain injury mechanisms: neuroinflammation, excitotoxicity, oxidative damage, and cerebral edema, all of which terminate in neuronal necrosis. This diagram serves as an educational tool for neurology students to understand the diverging initiating events and converging molecular outcomes of different stroke types.
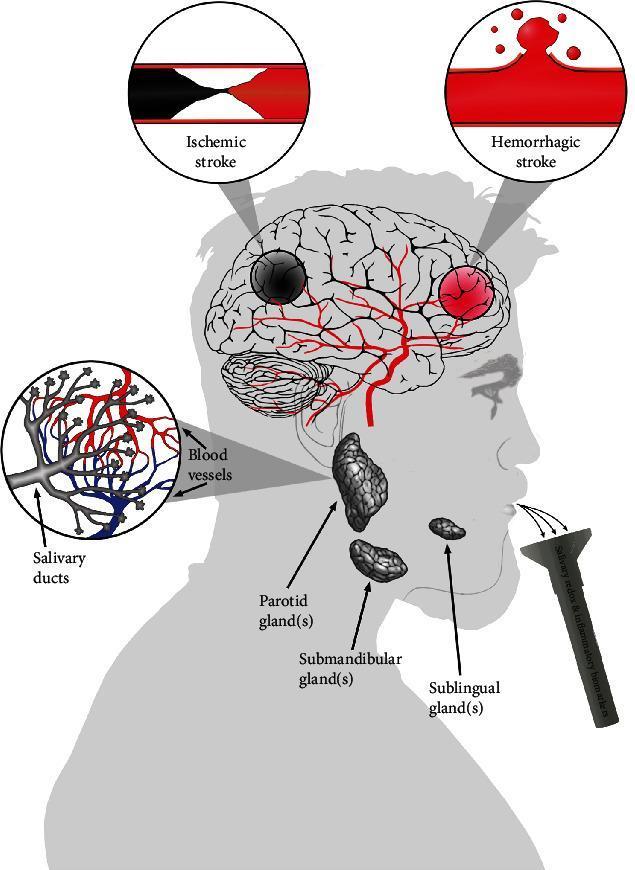
A medical infographic illustrating the physiological connection between cerebrovascular stroke and salivary biomarkers. The central image features a profile of a human head containing a brain with detailed vasculature. Two circular call-outs at the top contrast stroke types: 'Ischemic stroke' is shown as an arterial occlusion (blockage), while 'Hemorrhagic stroke' depicts a vessel rupture with extravasation of blood. Below, the three major salivary glands—parotid, submandibular, and sublingual—are labeled and shown in gray textured relief. An additional circular inset highlights the intricate interface between branching blood vessels and salivary ducts, emphasizing the mechanism of plasma filtration into saliva. A collection funnel at the mouth represents the non-invasive sampling of salivary redox and inflammatory biomarkers. The diagram serves an educational purpose for neurology and clinical chemistry, demonstrating how systemic markers of oxidative stress from brain injury can be detected in salivary secretions for diagnostic monitoring.
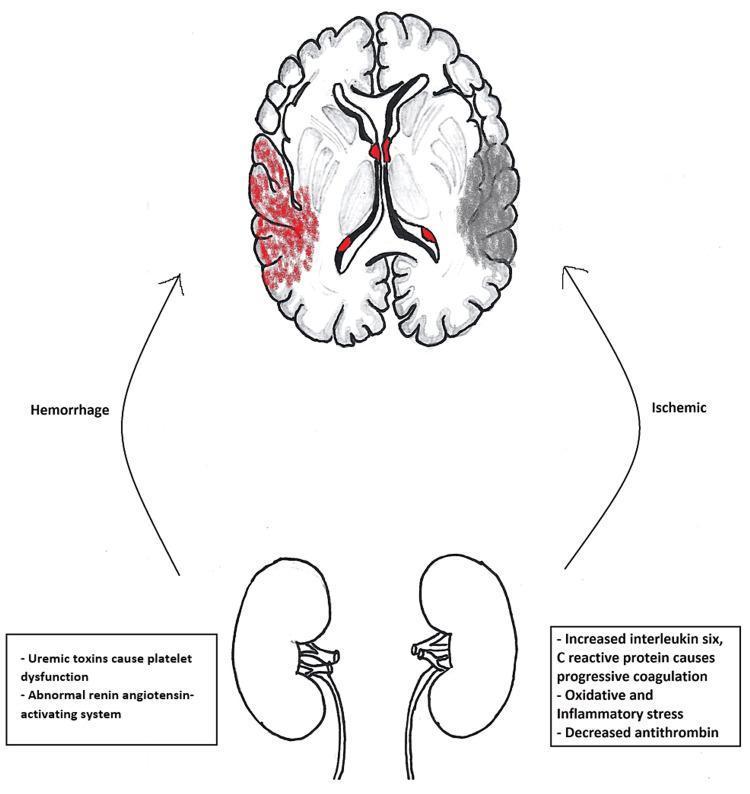
A medical pathophysiology diagram illustrating the bidirectional mechanisms linking chronic kidney disease (CKD) to stroke. The top of the diagram features a cross-sectional anatomical illustration of the brain. The left hemisphere depicts an area of red discoloration labeled 'Hemorrhage,' while the right hemisphere shows a gray-shaded region labeled 'Ischemic.' Below, a pair of kidneys is illustrated, connected to the brain pathology by curved arrows. The left arrow connects the kidney to hemorrhagic stroke, with an adjacent text box outlining contributing factors: uremic toxins causing platelet dysfunction and an abnormal renin-angiotensin-activating system. The right arrow connects the kidney to ischemic stroke, with a text box detailing mechanisms including increased Interleukin-6 (IL-6) and C-reactive protein (CRP) leading to progressive coagulation, oxidative and inflammatory stress, and decreased antithrombin. This educational graphic demonstrates how renal dysfunction promotes both pro-thrombotic and pro-hemorrhagic states, significantly increasing stroke risk in CKD and end-stage renal disease (ESRD) patients.
Stroke: Types, Mechanisms, and Lacunar Infarct
What Is a Stroke?
- Park's Textbook of Preventive and Social Medicine
- Bradley and Daroff's Neurology in Clinical Practice
Classification of Stroke
A. Ischemic Stroke (~80% of all strokes)
1. In Situ Occlusive Stroke
-
Large artery (Atherothrombotic infarction): Atherosclerosis affects major vessels (carotid bifurcation, MCA stem, vertebrobasilar system). Mechanism is usually artery-to-artery embolization or thrombosis, often triggered by plaque rupture/ulceration. Risk factors: hypertension, diabetes, smoking, hyperlipidemia. - Bradley and Daroff's Neurology
-
Small artery / Penetrating artery disease - LACUNAR INFARCT: (see below in detail)
2. Embolic Stroke
- Emboli travel from a remote source (cardiac or proximal vascular) and lodge in a cerebral artery.
- Onset is sudden with maximal deficit at onset - characteristic feature.
- Can involve multiple vascular territories simultaneously (vs. thrombotic = single territory).
- Most common cardiac cause: Atrial fibrillation (AF) - accounts for 50-65% of cardiogenic emboli.
- Other sources: acute MI, infective endocarditis, mechanical prosthetic valves, rheumatic mitral stenosis, dilated cardiomyopathy, PFO.
- Cardioembolic strokes account for ~15-20% of all ischemic strokes. - Bradley and Daroff's Neurology
3. Watershed (Border Zone) Infarction
- Occurs when systemic hypoperfusion affects the most vulnerable brain regions: the junctional zones between major arterial territories (ACA/MCA/PCA borders).
- Classic presentation: "man in a barrel" syndrome - bilateral arm weakness with leg and face sparing, from ACA-MCA border zone ischemia.
- Also occurs between vertebrobasilar branches (PICA, AICA, SCA territories).
- Cause: global hypoperfusion (e.g., cardiac arrest, severe hypotension, carotid stenosis). - Bradley and Daroff's Neurology
Lacunar Infarct - In Depth
Pathophysiology
| Mechanism | Description |
|---|---|
| Lipohyalinosis | Fibrinoid material and lipid deposition within the arterial wall + medial hypertrophy - gradually obliterates the lumen. Strongly associated with chronic hypertension and diabetes. |
| Microatheroma | Atheromata within the parent artery block the ostium of a perforating artery. Associated with lacunes >50 μm. |
Common Sites
- Putamen
- Basis pontis
- Thalamus
- Posterior limb of internal capsule
- Caudate nucleus
Classic Lacunar Syndromes
-
Pure Motor Hemiplegia (PMH) - most common. Lesion in posterior limb of internal capsule or basis pontis. Complete unilateral motor deficit (face, arm, leg) without sensory, visual, or cortical signs.
-
Pure Sensory Stroke (PSS) - lacunar infarct in the ventroposterolateral nucleus of the thalamus. Numbness and paresthesias in a hemisensory distribution (cheiro-oral or cheiro-pedal pattern). Both spinothalamic AND medial lemniscal modalities affected (unlike pontine lesions where they dissociate). - Localization in Clinical Neurology, 8e
-
Sensorimotor Stroke - combined sensory and motor deficits. Lesion typically in posterolateral thalamus + adjacent internal capsule.
-
Ataxic Hemiparesis (AH) - second most common. Lesion in posterior limb of internal capsule, basis pontis, or corona radiata. Features: ipsilateral leg/foot weakness + homolateral cerebellar ataxia disproportionate to the motor deficit. No cortical signs, visual field defects, or dysarthria. - Localization in Clinical Neurology, 8e
-
Dysarthria-Clumsy Hand Syndrome - dysarthria + facial weakness + clumsiness of one hand. Basis pontis or genu of internal capsule.
Imaging
- Acute: Hyperintense on DWI (restricted diffusion), hypointense on ADC map.
- Chronic/cavitated: Hypointense on T1, hyperintense on T2/FLAIR with a FLAIR-dark core and hyperintense rim.
Risk Factors and Management
- Long-standing arterial hypertension and diabetes mellitus are the strongest risk factors.
- Also: smoking, dyslipidemia.
- Management: antihypertensive therapy (critical), intensive statin therapy, antiplatelet agents.
- Prognosis: Short-term recovery is more favorable compared to other ischemic stroke subtypes. Some patients achieve complete recovery even after severe events, though long-term sequelae can occur. - Frameworks for Internal Medicine
Important: A lacunar syndrome in a hypertensive/diabetic patient is NOT sufficient alone to diagnose lacunar infarct. Other causes (cardioembolic, large artery disease) must be excluded - especially if sensorimotor stroke, sudden onset with AF, or large striatocapsular infarctions are present. - Bradley and Daroff's Neurology
B. Hemorrhagic Stroke (~20% of all strokes)
1. Spontaneous Intracerebral Hemorrhage (ICH)
- Ganglionic (deep): Most commonly due to hypertension causing hyaline arteriolosclerosis and rupture of small penetrating arteries. Typical sites: putamen, thalamus, pons, cerebellum.
- Lobar: Most commonly due to cerebral amyloid angiopathy (CAA), especially in elderly. - Robbins, Cotran & Kumar
2. Subarachnoid Hemorrhage (SAH)
- Blood in the subarachnoid space. Classically described as "thunderclap headache" (worst headache of life).
- Most commonly caused by rupture of a saccular (berry) aneurysm or arteriovenous malformation (AVM).
3. Intracranial Aneurysm
- Saccular aneurysms at arterial bifurcations of the Circle of Willis.
- Rupture causes SAH. Risk increases with hypertension, smoking, polycystic kidney disease.
4. Arteriovenous Malformation (AVM)
- Congenital tangle of arteries and veins without intervening capillaries.
- Risk of rupture causing SAH or intracerebral hemorrhage.
Summary Table
| Type | Mechanism | Onset | Key Features |
|---|---|---|---|
| Lacunar infarct | Lipohyalinosis / microatheroma of perforating artery | Gradual or stepwise | Small deep lesion, classic syndromes (PMH, PSS, AH), no cortical signs |
| Large artery atherothrombotic | Atherosclerosis of major vessels | Gradual/stuttering | TIA preceding, stepwise worsening |
| Cardioembolic | Embolus from cardiac source | Sudden, maximal at onset | AF, may affect multiple territories |
| Watershed | Global hypoperfusion | With systemic hypoperfusion | "Man in a barrel", bilateral ACA-MCA border zones |
| Intracerebral hemorrhage | Hypertensive vessel rupture or CAA | Sudden, progressive | Headache, vomiting, focal deficit, no recovery of early deficit |
| Subarachnoid hemorrhage | Aneurysm/AVM rupture | Sudden thunderclap headache | Meningism, "worst headache of life" |
Okay now clinical symptoms in detail for all the types of stroke.
stroke syndromes MCA ACA PCA territory brain infarction clinical features
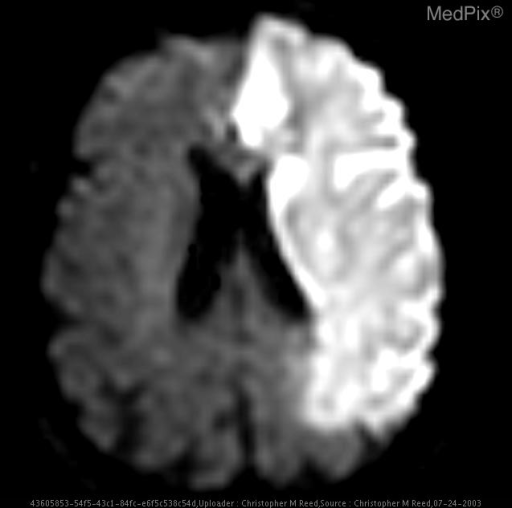
**Imaging Modality:** Magnetic Resonance Imaging (MRI), Diffusion-Weighted Imaging (DWI). **Anatomical Region:** Axial section of the brain at the level of the lateral ventricles and basal ganglia. **Observed Pathology:** Large-scale acute ischemic infarction involving the left cerebral hemisphere. **Characteristic Visual Features:** * **Signal Intensity:** Prominent, confluent area of hyperintensity (diffusion restriction) indicative of cytotoxic edema. * **Distribution:** The pathology follows a specific vascular territorial pattern, involving the entire left Anterior Cerebral Artery (ACA) and Middle Cerebral Artery (MCA) territories. * **Sparing:** There is distinct sparing of the Posterior Cerebral Artery (PCA) territory and the entire right cerebral hemisphere. * **Mass Effect:** Subtle effacement of the left lateral ventricle and adjacent cortical sulci is visible, suggesting early focal edema. **Clinical Context:** Findings are diagnostic of a large-vessel occlusion (LVO), specifically involving the left internal carotid artery (ICA) terminus or the proximal segments of the ACA and MCA simultaneously. This represents a major acute ischemic stroke. **Key Diagnostic Features:** The sharp demarcation at the midline and the territorial confinement assist in differentiating vascular infarction from neoplastic or inflammatory processes.
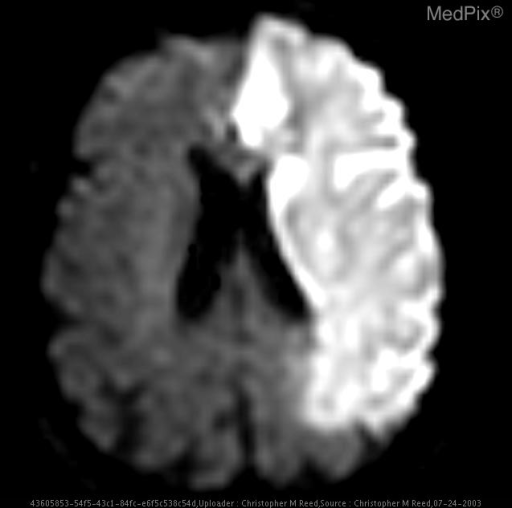
**Imaging Modality:** Magnetic Resonance Imaging (MRI), specifically a Diffusion-Weighted Image (DWI). **Anatomical Region:** Axial section of the brain at the level of the lateral ventricles and basal ganglia. **Observed Pathology:** Large area of acute cerebral infarction. There is a prominent, confluent region of restricted diffusion characterized by hyperintensity (bright signal) involving the left cerebral hemisphere. **Distribution and Pattern:** The hyperintensity follows a vascular territory distribution, encompassing the entirety of the left Anterior Cerebral Artery (ACA) and Middle Cerebral Artery (MCA) territories. The lesion involves the frontal, parietal, and temporal lobes, including the insular cortex and deep gray matter structures. Notably, the posterior cerebral artery (PCA) territory in the left occipital region is spared, as is the entire right hemisphere. **Characteristic Features:** The marked high signal on DWI indicates cytotoxic edema associated with an acute ischemic stroke. Mass effect is suggested by mild effacement of the left lateral ventricle and adjacent cortical sulci. **Diagnostic Significance:** The involvement of both ACA and MCA territories suggests a proximal occlusion of the left internal carotid artery (ICA) or the carotid terminus (T-occlusion). This pattern is a hallmark of a large vessel occlusion (LVO).

This composite of six axial non-contrast computed tomography (NCCT) brain scans illustrates various patterns of ischemic stroke across different vascular territories. Panel (A) demonstrates a hypodense infarct in the left distal middle cerebral artery (MCA) M1 territory with signs of Hemorrhagic Infarction type 1 (HI1). Panel (B) shows a basilar artery and left posterior cerebral artery (PCA) infarction, highlighted by a hyperdense basilar sign indicative of acute thrombus. Panel (C) presents bilateral MCA involvement, affecting the right M1 and left distal M1/proximal M2 segments. Panel (D) reveals a focal hypodensity in the inferior division of the left M2 MCA territory with HI1 features. Panel (E) shows a large territory infarct in the left proximal M1 segment with HI1. Panel (F) depicts a small, localized left lacunar infarct, representative of non-large vessel occlusion (non-LVO). The collection serves as an educational comparison for identifying stroke topographies, large vessel occlusion (LVO) signs, and petechial hemorrhagic transformation on baseline NCCT imaging.
Clinical Symptoms of All Stroke Types - Detailed
General Warning Symptoms (Any Stroke)
- Face drooping (asymmetric smile or facial droop)
- Arm weakness (one arm drifts down when raised)
- Speech difficulty (slurred, garbled, unable to speak or understand)
- Time to call emergency services
I. ISCHEMIC STROKE - Clinical Symptoms by Territory
A. Middle Cerebral Artery (MCA) Stroke - Most Common
- Contralateral hemiplegia (face + arm + leg, but face and arm worse than leg)
- Contralateral hemianesthesia (hemisensory loss)
- Homonymous hemianopia (loss of same visual field both eyes)
- Conjugate ipsilateral eye deviation (eyes deviate toward the stroke side - "looking at the lesion")
- Global aphasia (dominant hemisphere - total loss of speech production and comprehension)
- Hemineglect (nondominant hemisphere - ignores contralateral side of space)
- Hemiparesis predominantly affecting face and arm more than leg
- Broca's aphasia (dominant hemisphere) - nonfluent, broken speech, preserved comprehension
- Impaired prosody (nondominant)
- Wernicke's aphasia (dominant) - fluent but meaningless speech, poor comprehension
- Behavioral disturbances (nondominant)
- Homonymous hemianopia or inferior quadrantanopia
- Pure motor hemiparesis (internal capsule involvement) - no cortical signs
- Alexia with agraphia (left angular gyrus)
- Gerstmann syndrome (dominant parietal): finger agnosia, acalculia, right-left disorientation, agraphia
-
Anosognosia (denies having hemiparesis)
-
Tactile and visual extinction, hemi-inattention
-
Apraxia, impaired prosody, acute agitated delirium
-
Bradley and Daroff's Neurology in Clinical Practice
B. Anterior Cerebral Artery (ACA) Stroke - <3% of infarcts
-
Contralateral weakness primarily in the lower extremity (leg >> arm) - opposite pattern to MCA
-
Abulia (lack of motivation, slowness of thought and action)
-
Akinetic mutism (bilateral mesiofrontal damage) - patient is awake but profoundly unresponsive
-
Impaired memory or emotional disturbances
-
Transcortical motor aphasia (dominant hemisphere) - like Broca's but repetition is preserved
-
Deviation of head and eyes toward the lesion
-
Paratonia (gegenhalten) - involuntary resistance to passive limb movement
-
Discriminative and proprioceptive sensory loss (primarily lower extremity)
-
Sphincter incontinence
-
Left arm apraxia (anterior corpus callosum disconnection)
-
Basal branch infarction: memory disorders, anxiety, agitation
-
Bradley and Daroff's Neurology in Clinical Practice
C. Posterior Cerebral Artery (PCA) Stroke
- Homonymous hemianopia (contralateral) - often the dominant symptom; macular vision may be spared
- With dominant hemisphere: alexia without agraphia (can write but cannot read), anomia, memory disturbances
- With nondominant hemisphere: neglect, visuospatial deficits
- Prosopagnosia (bilateral): inability to recognize familiar faces
- Anton syndrome (cortical blindness with denial of blindness)
| Syndrome | Location | Features |
|---|---|---|
| Weber | Cerebral peduncle | Ipsilateral CN III palsy (dilated pupil, ptosis) + contralateral hemiplegia |
| Benedikt | Ventral midbrain tegmentum | Ipsilateral CN III palsy + contralateral involuntary movements (tremor, hemichorea) |
| Claude | Dorsal midbrain | Ipsilateral CN III palsy + contralateral cerebellar ataxia |
| Parinaud | Dorsal midbrain/pretectum | Paralysis of upgaze, convergence-retraction nystagmus, light-near dissociation, lid retraction |
-
Somnolence, peduncular hallucinosis (vivid visual hallucinations), memory disturbance, agitated delirium
-
Unilateral or bilateral paralysis of vertical gaze
-
Bilateral homonymous hemianopia / cortical blindness
-
Thalamic involvement: sensory deficits
-
Bradley and Daroff's Neurology in Clinical Practice
D. Vertebrobasilar Stroke
- Ipsilateral: facial pain/numbness (CN V), Horner syndrome (ptosis, miosis, anhidrosis), ataxia, hoarseness/dysphagia (CN IX/X), loss of taste
- Contralateral: loss of pain and temperature in the body/limbs (spinothalamic)
- Vertigo, nausea, vomiting, nystagmus (vestibular nuclei)
- Motor strength is preserved (corticospinal tracts spared)
- Vertigo, nausea, vomiting, nystagmus
- Ipsilateral: facial hyalgesia, corneal hyesthesia, deafness, facial paralysis, Horner syndrome, ataxia
- Contralateral: trunk/extremity loss of pain and temperature
- Vertigo (less common than AICA)
- Ipsilateral: Horner syndrome, ataxia, intention tremor, choreiform dyskinesias
- Contralateral: hearing loss, trunk/extremity hypalgesia and thermoanesthesia (spinothalamic)
- Nystagmus (MLF involvement)
-
Coma, quadriplegia
-
Locked-in syndrome (if basis pontis bilaterally affected): complete paralysis except vertical eye movements, consciousness preserved
-
Cranial nerve palsies, bilateral Babinski signs
-
Respiratory failure, death if not treated emergently
-
Bradley and Daroff's Neurology in Clinical Practice
E. Lacunar Infarct - Symptoms by Syndrome
| Syndrome | Location of Lacune | Key Features |
|---|---|---|
| Pure Motor Hemiparesis (PMH) | Posterior limb internal capsule, basis pontis, corona radiata | Contralateral hemiparesis/plegia of face + arm + leg equally, no sensory loss, no cortical signs |
| Pure Sensory Stroke (PSS) | Ventroposterolateral thalamus | Hemisensory loss (numbness, paresthesias) in face + arm + trunk + leg; cheiro-oral or cheiro-pedal pattern; ALL modalities affected |
| Sensorimotor Stroke | Posterolateral thalamus + adjacent internal capsule | Combined motor AND sensory deficit |
| Ataxic Hemiparesis (AH) | Posterior limb internal capsule, basis pontis, corona radiata | Mild-to-moderate hemiparesis (leg > arm) + ipsilateral cerebellar ataxia disproportionate to weakness; extensor plantar response; NO facial weakness, cortical signs, or hemianopia |
| Dysarthria-Clumsy Hand Syndrome | Basis pontis, genu of internal capsule | Dysarthria + facial weakness + hand clumsiness; no limb weakness |
- Bradley and Daroff's Neurology in Clinical Practice; Localization in Clinical Neurology 8e
F. Watershed (Border Zone) Infarction
- ACA-MCA border zone: "Man in a barrel" - proximal arm weakness with preserved hand and leg; bilateral arm weakness if bilateral
- MCA-PCA border zone: Visuospatial deficits, dyslexia, dyscalculia, dysgraphia, verbal and nonverbal memory deficits
- Bilateral parieto-occipital: Cortical blindness (improving), inferior altitudinal field defects, optic ataxia, difficulty judging size/distance/movement (Balint syndrome elements)
II. HEMORRHAGIC STROKE - Clinical Symptoms
A. Hypertensive Intracerebral Hemorrhage (ICH) - by Location
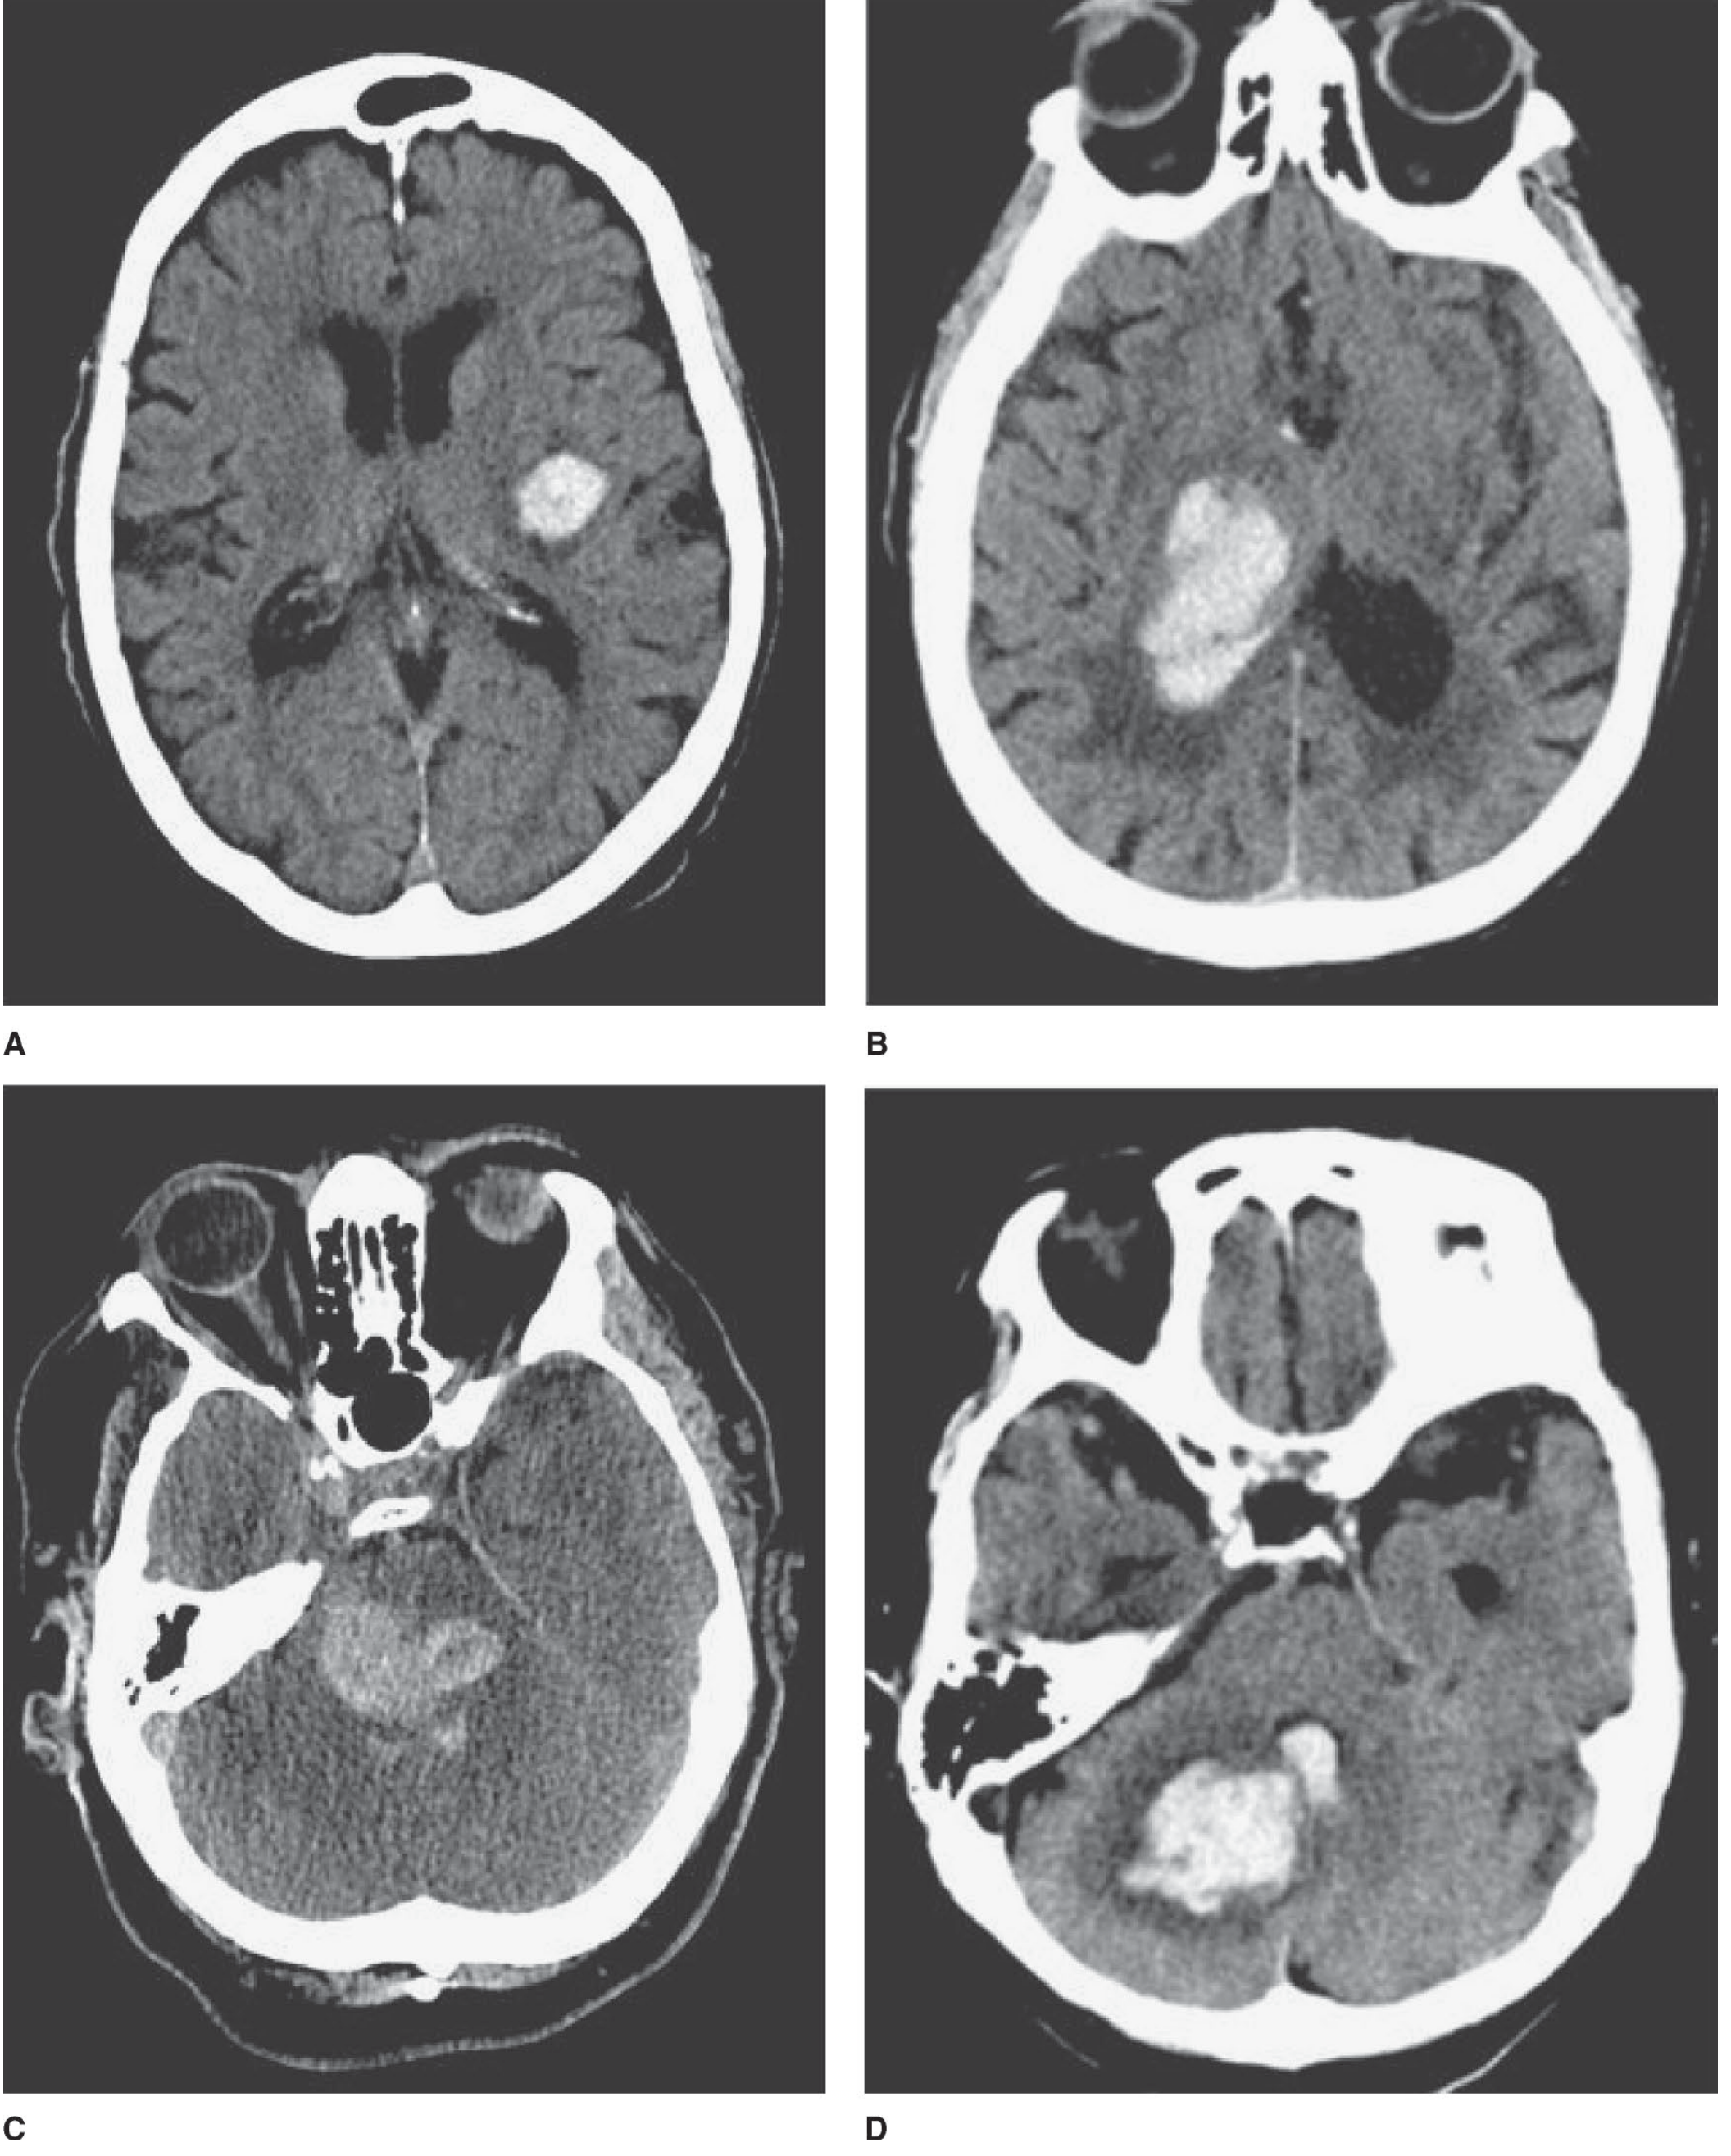
- Symptoms are progressive over minutes to hours (versus sudden maximal deficit at onset in embolic stroke)
- Neurologic deficit is never transitory - no TIA-like fluctuation
- More commonly accompanied by headache and vomiting
- Clinical features rarely reliably distinguish ICH from ischemic stroke - imaging is required
- Contralateral hemiplegia (from internal capsule transection) - consistent in medium/large clots
- Vomiting in ~50%
- Headache (frequent but not invariable)
- Face sags on one side, slurred or aphasic speech
- Ipsilateral eye deviation (conjugate deviation away from the paretic limbs)
- Large bleeds: progressive stupor → coma, bilateral Babinski signs, decerebrate rigidity, dilated fixed pupils, irregular respiration
- Severe contralateral sensory loss (entire body including trunk) - cardinal feature
- Hemiplegia/hemiparesis (from adjacent internal capsule compression)
- Fluent aphasia or anomia (dominant side)
- Contralateral neglect (nondominant)
- Homonymous hemianopia (usually transient)
- Ocular signs (highly characteristic of thalamic hemorrhage):
- Eyes deviate downward and inward ("setting-sun" gaze)
- Vertical gaze palsy
- Skew deviation (ipsilateral eye higher)
- Absent light reaction, retraction nystagmus
- Ipsilateral Horner syndrome
- Hydrocephalus from third ventricle compression
- Deep coma within minutes - almost invariable
- Total paralysis, bilateral Babinski signs
- Decerebrate rigidity
- Pinpoint pupils (1 mm) that react to light - pathognomonic
- Impaired or absent lateral eye movements (head turning/calorics)
- Death usually within hours; small tegmental bleeds may survive
- Develops over minutes to hours; loss of consciousness at onset is unusual (distinguishing feature from pontine)
- Repeated vomiting - prominent feature
- Occipital headache
- Severe vertigo
- Inability to stand, sit, or walk - patient falls to the affected side
- Note: early examination may appear near-normal; always test gait
- Ipsilateral facial weakness, paresis of conjugate lateral gaze, CN VI weakness (with larger bleeds)
- Dysarthria, dysphagia (variable)
- Risk: sudden brainstem compression with apnea - surgically reversible if caught early
-
Occipital: pain around ipsilateral eye + dense homonymous hemianopia
-
Temporal: pain in/anterior to ear + partial hemianopia + fluent aphasia
-
Frontal: frontal headache + contralateral hemiplegia (arm predominantly)
-
Parietal: anterior temporal headache + contralateral hemisensory deficit
-
Progressive worsening headache + vomiting + drowsiness accompanying any focal syndrome = virtually diagnostic of hemorrhage
-
Adams and Victor's Principles of Neurology, 12th Edition
B. Subarachnoid Hemorrhage (SAH)
- "Thunderclap" headache - sudden, cataclysmic, peaks within seconds to minutes; described as "worst headache of my life." Headaches that take >60 minutes to peak are unlikely to be SAH.
- Syncope (may be the initial manifestation, with headache beginning as consciousness returns)
- Nausea and vomiting
- Meningism: neck stiffness, photophobia, phonophobia
- Seizures
- Up to 20% have focal neurologic deficits
- Oculomotor (CN III) palsy: complete ptosis + "down-and-out" eye + dilated pupil = posterior communicating artery aneurysm compressing CN III
- CN VI palsy
- ~50% have altered or fluctuating consciousness
- Up to 1/3 of patients recall a preceding milder headache ("warning leak") days to weeks before the major SAH
| Grade | Clinical Status |
|---|---|
| 0 | Unruptured aneurysm |
| 1 | Asymptomatic or minimal headache + slight neck stiffness |
| 2 | Moderate/severe headache, nuchal rigidity, no deficit beyond CN palsy |
| 3 | Drowsiness, confusion, mild focal deficit |
| 4 | Stupor, moderate-severe hemiparesis |
| 5 | Deep coma, decerebrate posturing, moribund |
- Rosen's Emergency Medicine; Localization in Clinical Neurology 8e
Quick Differentiation Summary
| Feature | Ischemic Stroke | ICH | SAH |
|---|---|---|---|
| Onset | Variable (sudden to stepwise) | Gradual (minutes-hours) | Sudden (seconds) |
| Headache | Mild/absent | Moderate, progressive | Severe thunderclap |
| Vomiting | Uncommon | Common | Common |
| Consciousness | Usually preserved early | Impaired with large bleeds | May be preserved or altered |
| Focal deficit | Always present | Present + progressive | May be absent or late |
| Meningism | Absent | Absent | Present |
| Pupil signs | Variable | Blown pupil (herniation) | CN III palsy (PCA aneurysm) |
| Deficit trajectory | Maximal at onset (embolic) or fluctuating | Progressive, never transient | With vasospasm (days 4-14) |
What is cortical signs and non cortical signs
Cortical Signs vs. Non-Cortical (Subcortical) Signs
The Core Concept
- Cerebral cortex - the outer gray matter where complex, "higher" brain functions are processed (language, perception, praxis, gnosis, spatial awareness)
- Subcortical structures - white matter tracts, internal capsule, basal ganglia, thalamus, brainstem, cerebellum - which relay or process signals below the cortex
- Cortical lesion = damage to the brain's "processing center" → deficits in language, recognition, skilled movement, spatial awareness
- Subcortical lesion = damage to the brain's "wiring" → motor/sensory pathways interrupted, but the cortex itself is intact, so no higher-function deficits
- Bradley and Daroff's Neurology in Clinical Practice
CORTICAL SIGNS
1. Language Disturbances (APHASIA) - Dominant Hemisphere (Usually Left)
| Type | Fluency | Comprehension | Repetition | Location |
|---|---|---|---|---|
| Broca's (Expressive) | Non-fluent, halting, effortful | Intact | Impaired | Left frontal (Broca's area) |
| Wernicke's (Receptive) | Fluent but meaningless ("word salad") | Impaired | Impaired | Left temporal (Wernicke's area) |
| Global Aphasia | Non-fluent | Impaired | Impaired | Large left hemisphere lesion |
| Conduction Aphasia | Fluent | Intact | Severely impaired | Left parietal operculum |
| Transcortical Motor | Non-fluent | Intact | Intact (repetition preserved!) | Left frontal (anterior to Broca's) |
| Transcortical Sensory | Fluent | Impaired | Intact | Left parieto-occipital |
| Anomic Aphasia | Fluent | Intact | Intact, but word-finding difficulty | Left angular gyrus |
- Harrison's Principles of Internal Medicine 22E; Bradley and Daroff's Neurology
2. Neglect / Hemineglect - Nondominant Hemisphere (Usually Right Parietal)
- Hemispatial neglect - ignores objects/people on the left side of space
- Tactile extinction - can feel each hand individually, but when touched simultaneously, only perceives the right side
- Visual extinction - similar phenomenon in vision
- Anosognosia - unawareness or denial of one's own neurological deficit (e.g., patient insists their paralyzed arm is fine)
- Anosodiaphoria - patient acknowledges deficit but shows no concern about it
- Hemisomatognosia - feels the left limb does not belong to them
3. Visuospatial Deficits - Nondominant (Right) Parietal
- Constructional apraxia - unable to copy drawings or assemble objects (test: draw a clock face or copy a cube)
- Dressing apraxia - cannot dress oneself due to spatial disorientation, not limb weakness
- Loss of topographic memory - cannot recall routes or familiar layouts
- Distortion of visual coordinates - misjudging distances, upside-down reading, visual illusions
4. APRAXIA - Dominant (Left) Parietal or Frontal
- Ideomotor apraxia: Can do the action automatically but cannot do it on command (e.g., "show me how to brush your teeth")
- Ideational apraxia: Fails at sequencing multi-step tasks (cannot make a cup of tea step-by-step)
- Limb-kinetic apraxia: Fine, delicate hand movements are clumsy despite intact strength (frontal)
- Callosal apraxia: Left hand apraxia only - from anterior corpus callosum damage (ACA territory)
- Apraxia of gait (frontal): Difficulty walking despite normal leg strength ("magnetic gait")
5. AGNOSIA - Cortical Recognition Failure
- Visual agnosia - sees an object but cannot identify it (usually bilateral posterior lesions)
- Prosopagnosia - cannot recognize familiar faces (bilateral occipitotemporal)
- Finger agnosia - cannot identify own fingers (part of Gerstmann syndrome)
- Astereognosis - cannot identify an object by touch (parietal cortex)
- Asymbolia for pain - can feel pain but has no emotional/behavioral response to it
6. GERSTMANN SYNDROME - Dominant Left Parietal (Angular Gyrus)
- Finger agnosia - cannot name or identify fingers
- Acalculia - inability to calculate
- Agraphia - inability to write
- Right-left disorientation - cannot distinguish right from left
7. ALEXIA / AGRAPHIA
- Alexia with agraphia - cannot read or write (left angular gyrus)
- Alexia without agraphia - can write but cannot read (left occipital + splenium of corpus callosum) - "pure alexia"
8. Homonymous Hemianopia
- Cortical hemianopia (occipital lobe): "Macular sparing" hemianopia because macular cortex has dual blood supply
- Subcortical (optic radiation): May produce quadrantanopias
9. Frontal Lobe Cortical Signs
-
Abulia - profound loss of motivation, slowness of thought, reduced spontaneous movement
-
Akinetic mutism - awake but completely unresponsive, no movement or speech (bilateral mesiofrontal)
-
Personality changes / disinhibition - impulsivity, inappropriate behavior (orbitofrontal)
-
Paratonia (gegenhalten) - involuntary, variable resistance to passive limb movement
-
Primitive reflexes: grasp reflex, sucking reflex, palmomental reflex (release of frontal inhibition)
-
Impaired planning, set-shifting, and sequential processing (executive function)
-
Bradley and Daroff's Neurology in Clinical Practice
NON-CORTICAL (SUBCORTICAL) SIGNS
What is ABSENT in a subcortical lesion:
- No aphasia
- No apraxia
- No agnosia
- No neglect
- No hemianopia (or only minor visual field changes)
- No anosognosia
- No Gerstmann syndrome
What IS Present:
| Sign | Description | Common Location |
|---|---|---|
| Pure motor hemiplegia | Complete unilateral motor loss (face + arm + leg equally) with NO sensory loss | Posterior limb of internal capsule or basis pontis |
| Pure sensory loss | Hemisensory loss (all modalities) with NO motor deficit | Thalamus (VPL nucleus) |
| Dysarthria | Slurred speech from motor pathway damage - NOT aphasia (language is intact) | Basis pontis, genu of internal capsule |
| Dysphagia | Swallowing difficulty from bulbar pathway involvement | Brainstem, internal capsule (bilateral) |
| Ataxia | Incoordination (cerebellar or cerebellar pathway lesion) | Cerebellum, cerebellar peduncles |
| Tremor / involuntary movements | Cerebellar or basal ganglia/rubral pathway damage | Thalamus, red nucleus |
| Babinski sign | Upgoing plantar response from corticospinal tract damage anywhere along its course | UMN path from cortex to cord |
| UMN pattern weakness | Spastic, pyramidal distribution weakness | Any UMN lesion |
| Cranial nerve palsy | From brainstem nuclear or fascicular damage | Brainstem |
| Horner syndrome | Ptosis + miosis + anhidrosis (descending sympathetic tract) | Lateral brainstem (PICA, AICA) |
| Nystagmus / vertigo | Vestibular pathway involvement | Brainstem, cerebellum |
Why This Distinction Matters in Stroke
| Feature | Cortical Stroke (e.g., MCA, ACA, PCA) | Subcortical Stroke (e.g., Lacunar) |
|---|---|---|
| Aphasia | Present (dominant) | Absent |
| Neglect | Present (nondominant) | Absent |
| Hemianopia | Often present | Absent |
| Apraxia/Agnosia | Present | Absent |
| Motor deficit | Present but often non-uniform | Present, often proportional (face=arm=leg) |
| Consciousness | May be altered | Usually preserved |
| Size of lesion | Large (cortex + subcortex) | Small (<15 mm, deep) |
| Vessel involved | Large (MCA, ACA, PCA, ICA) | Small perforating artery |
| Cause | Embolism, atherothrombosis | Lipohyalinosis, microatheroma |
Memory Aid
CORTICAL = "Higher Brain" damage
  ↓
FAST + HIGHER:
  F - Fluency/Aphasia
  H - Hemianopia (cortical)
  A - Apraxia
  S - Spatial neglect
  T - Topographic/recognition (agnosia)
  H - Higher personality changes
  E - Expression (Broca) or comprehension (Wernicke)
  R - Right-left confusion (Gerstmann)

SUBCORTICAL = "Pure" signs only
  Motor OR Sensory (or both) — NOTHING ELSE
Diabetes and it’s symptoms and macrovascukar and microvascular complications
diabetes mellitus complications microvascular macrovascular diagram
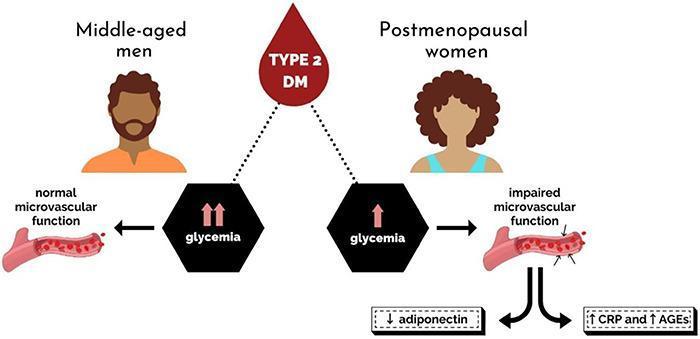
A medical infographic and comparison chart illustrating the sex-specific pathophysiology of microvascular function in Type 2 Diabetes Mellitus (T2DM). The diagram compares middle-aged men and postmenopausal women. For men, the visual highlights that despite higher glycemia (indicated by double upward arrows), they exhibit 'normal microvascular function,' depicted by a blood vessel with a smooth endothelium and organized red blood cells. In contrast, postmenopausal women are shown with lower glycemia (single upward arrow) yet manifest 'impaired microvascular function,' visually represented by an irregular, damaged vessel lining with projections. This vascular impairment in women is further linked to a specific metabolic profile: decreased levels of the anti-inflammatory adipokine adiponectin and increased levels of pro-inflammatory mediators, specifically C-reactive protein (CRP) and advanced glycation end products (AGEs). The illustration serves as a clinical comparison of how hormonal status and inflammatory markers, rather than glycemia alone, drive microvascular complications in diabetic women.
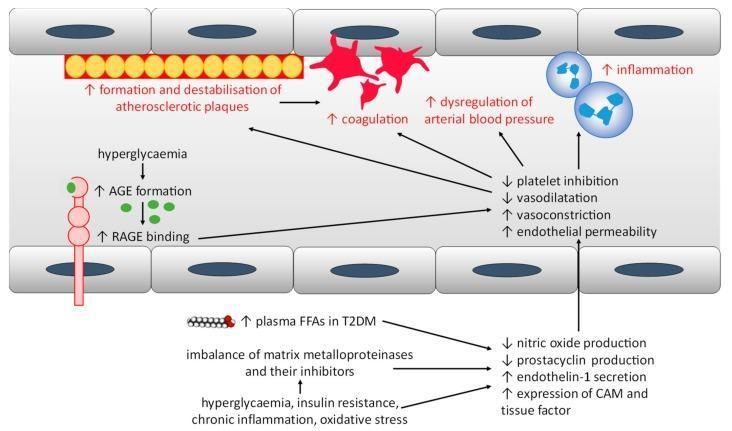
A pathophysiology diagram illustrating the mechanisms of endothelial dysfunction and increased cardiovascular risk in Type 1 and Type 2 Diabetes Mellitus. The diagram shows a cross-section of a blood vessel lined with endothelial cells. The upper section depicts pathological outcomes including the formation and destabilization of atherosclerotic plaques, increased coagulation (platelet aggregation), dysregulation of arterial blood pressure, and increased inflammation. Centrally, a list summarizes the resulting vascular environment: decreased platelet inhibition and vasodilation, alongside increased vasoconstriction and endothelial permeability. The lower section outlines the biochemical triggers: hyperglycemia leading to advanced glycation end-product (AGE) formation and RAGE binding; elevated plasma free fatty acids (FFAs); and imbalances in matrix metalloproteinases. These factors, alongside insulin resistance and oxidative stress, drive the dysfunction by decreasing nitric oxide and prostacyclin production while increasing endothelin-1, tissue factor, and cell adhesion molecule (CAM) expression. The diagram serves as a conceptual map connecting metabolic derangements to clinical macrovascular and microvascular complications.
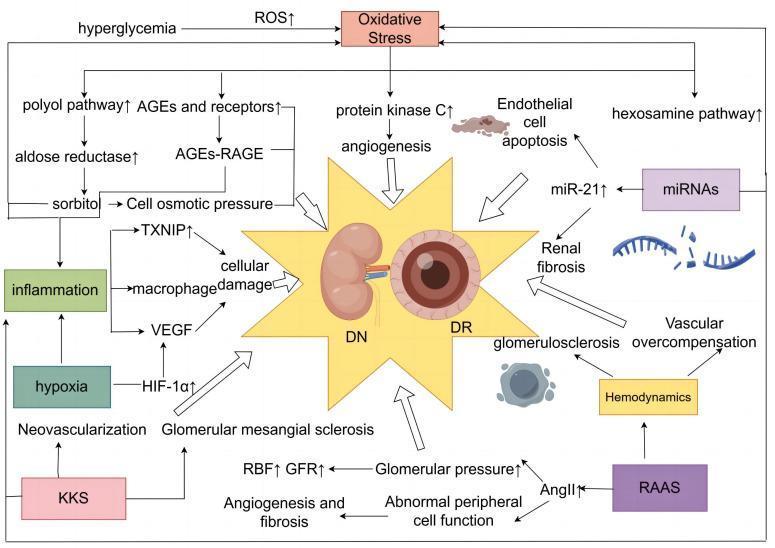
This pathophysiology diagram illustrates the shared metabolic and hemodynamic mechanisms underlying Diabetic Nephropathy (DN) and Diabetic Retinal (DR). The visual logic centers on a central starburst icon containing a kidney and an eye, surrounded by converging pathological pathways. At the top, Hyperglycemia and Oxidative Stress (ROS↑) serve as primary drivers, initiating four classic metabolic branches: the polyol pathway (leading to sorbitol and osmotic pressure changes), AGEs-RAGE signaling, the hexosamine pathway (via miRNAs/miR-21↑), and Protein Kinase C activation (triggering angiogenesis). On the left, factors like Hypoxia and Inflammation link to HIF-1̡ and VEGF, promoting neovascularization. On the right and bottom, Hemodynamics and the RAAS system (via AngII↑) are shown contributing to glomerular hypertension, renal blood flow (RBF) alterations, and vascular overcompensation. The diagram illustrates how these multi-systemic pathways culminate in shared endpoints: cellular damage, endothelial cell apoptosis, renal fibrosis, and glomerulosclerosis, highlighting the interconnected nature of microvascular complications in diabetes mellitus.
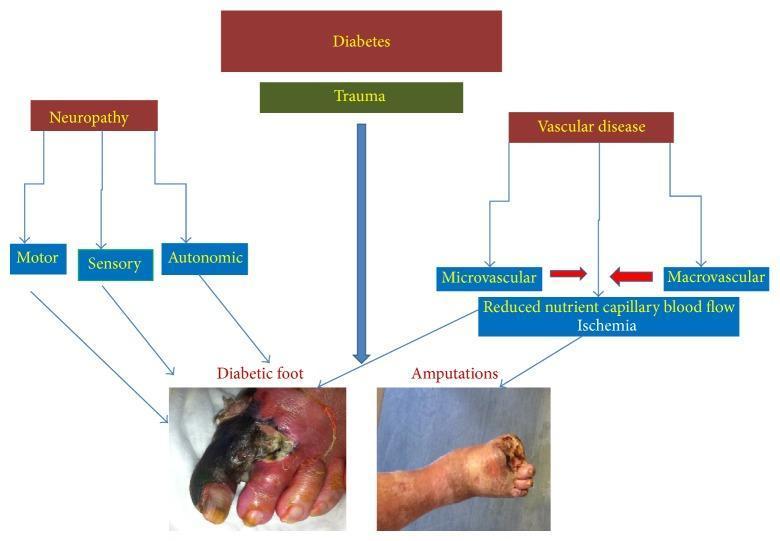
This pathophysiology flowchart illustrates the multifactorial pathogenetic pathways of Diabetic Foot Syndrome (DFS). The diagram is organized hierarchically, starting with 'Diabetes' as the primary systemic condition. It branches into two main complications: 'Neuropathy' (further sub-divided into motor, sensory, and autonomic components) and 'Vascular disease' (comprising microvascular and macrovascular pathology). These pathways converge through mediators like trauma and ischemia (reduced nutrient capillary blood flow) to clinical outcomes. The bottom of the chart features two clinical photographs: the left image labeled 'Diabetic foot' shows severe wet gangrene of the hallux and second digit, characterized by black necrotic tissue, purulent exudate, and surrounding erythematous inflammation. The right image labeled 'Amputations' demonstrates a post-operative status following a partial metatarsal or transmetatarsal amputation, showing a truncated distal foot with granulated tissue at the surgical site. This visual aid is designed for medical education regarding the complex interplay of ischemia and neuropathy in diabetic wound progression and limb loss.
diabetic retinopathy fundus photograph proliferative
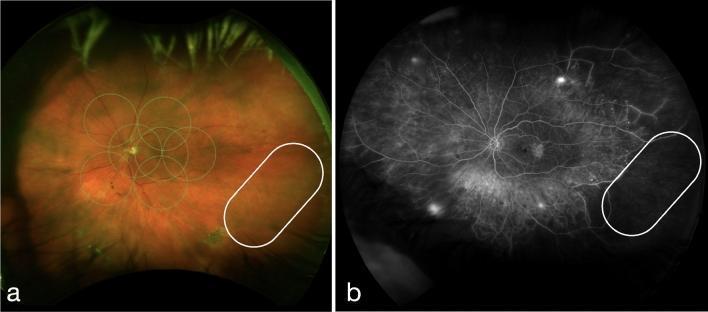
This figure presents two wide-field fundus images of a patient with proliferative diabetic retinopathy (PDR) and diabetic macular edema (DME). Image (a) is an ultra-widefield pseudocolor fundus photograph. It displays the characteristic orange-red retinal hue with superimposed green circles representing the ETDRS (Early Treatment Diabetic Retinopathy Study) grid for macular assessment. A white oval in the temporal periphery highlights an area of 'vessel whitening,' where the retinal vasculature appears pale and attenuated. Image (b) is a fundus fluorescein angiogram (FFA) of the same eye. In the region corresponding to the white oval, there is a clear area of hypofluorescence, indicating capillary non-perfusion and vascular filling defects. Additionally, the FFA reveals multiple punctate hyperfluorescent spots across the mid-periphery and posterior pole, consistent with microaneurysms or neovascularization. This comparison demonstrates the clinical significance of peripheral retinal vessel whitening as a marker for underlying ischemic non-perfusion in diabetic patients, facilitating diagnostic classification of disease severity.
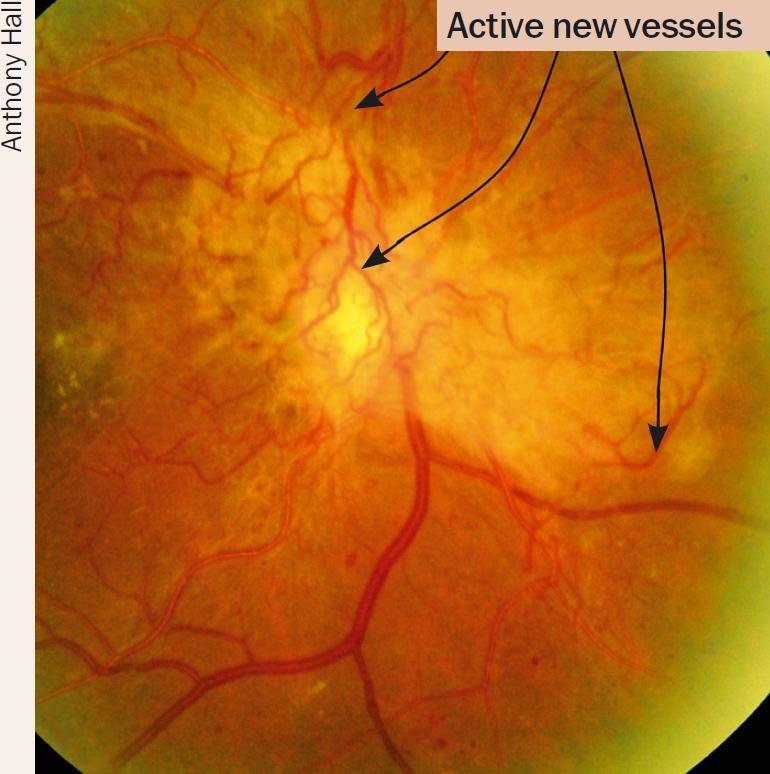
This clinical fundus photograph illustrates the hallmarks of Proliferative Diabetic Retinopathy (PDR). The primary findings are several areas of active neovascularization, specifically neovascularization of the disc (NVD) and neovascularization elsewhere (NVE), indicated by arrows pointing to fine, tufted, and tortuous capillary-like vessels. These new vessels are shown proliferating from the retina and extending onto the posterior vitreous surface. The retinal background exhibits additional signs of diabetic microvascular disease, including small, dark-red punctate lesions consistent with microaneurysms or small dot-and-blot hemorrhages. There are also subtle, lighter-colored yellowish patches suggestive of hard exudates. The overall retinal appearance is mottled, indicating underlying ischemia and chronic vascular damage. This image serves as a clinical example of advanced diabetic eye disease where pathological angiogenesis poses a high risk for vitreous hemorrhage and tractional retinal detachment.
Diabetes Mellitus - Symptoms and Complications
What Is Diabetes Mellitus?
-
Type 1 DM (T1D): Autoimmune destruction of pancreatic beta cells → absolute insulin deficiency
-
Type 2 DM (T2D): Insulin resistance + progressive beta-cell failure → relative insulin deficiency
-
Other types: Gestational diabetes, MODY, drug-induced, pancreatogenic
-
Fuster and Hurst's The Heart, 15th Edition
Clinical Symptoms of Diabetes
Classic Triad (the "3 Polys")
| Symptom | Mechanism |
|---|---|
| Polyuria (excessive urination) | Osmotic diuresis - glucose exceeds renal threshold (~180 mg/dL), glucose spills into urine, drawing water with it |
| Polydipsia (excessive thirst) | Compensatory response to dehydration from polyuria; raised plasma osmolality stimulates thirst center |
| Polyphagia (excessive hunger) | Cells cannot use glucose despite high blood levels (insulin absent/ineffective), brain perceives starvation |
Additional Symptoms
- Weight loss - especially in T1D: catabolism of fat and muscle due to insulin deficiency, glycosuria (calorie loss in urine)
- Fatigue and weakness - cells starved of glucose despite hyperglycemia
- Blurred vision - osmotic changes in the lens (sorbitol accumulation alters lens shape and refractive index)
- Frequent superficial infections (skin, urinary tract, candidal) - impaired phagocyte function (chemotaxis, killing, respiratory burst), glycosuria promotes bacterial growth
- Slow healing of skin wounds - impaired leukocyte function + microvascular disease reduces perfusion
- Nocturia - related to polyuria disrupting sleep
Acute Complications (Presenting Emergencies)
| Complication | Key Features |
|---|---|
| Diabetic Ketoacidosis (DKA) | Mainly T1D; nausea, vomiting, Kussmaul breathing (deep rapid sighing), fruity breath, abdominal pain, confusion, coma |
| Hyperosmolar Hyperglycemic State (HHS) | Mainly T2D; extreme hyperglycemia (600-1200 mg/dL), profound dehydration, altered mental status, no ketoacidosis |
| Hypoglycemia | Complication of insulin/sulfonylurea treatment; dizziness, confusion, sweating, palpitations, tachycardia → loss of consciousness if severe |
Long-Term (Chronic) Complications
- Advanced Glycation End Products (AGEs) - glucose metabolites attach to proteins → AGE-RAGE signaling → VEGF, TGF-β release, oxidative stress, procoagulant state, basement membrane thickening
- Protein Kinase C (PKC) activation - DAG synthesis from glycolytic intermediates → VEGF, TGF-β, PAI-1 production → microangiopathy
- Polyol pathway flux (Aldose reductase) - glucose → sorbitol → depletes NADPH → impairs glutathione regeneration → oxidative stress; sorbitol accumulates in lens (cataracts), nerves
- Hexosamine pathway flux - excess fructose-6-phosphate → oxidative stress → insulin resistance, vascular complications
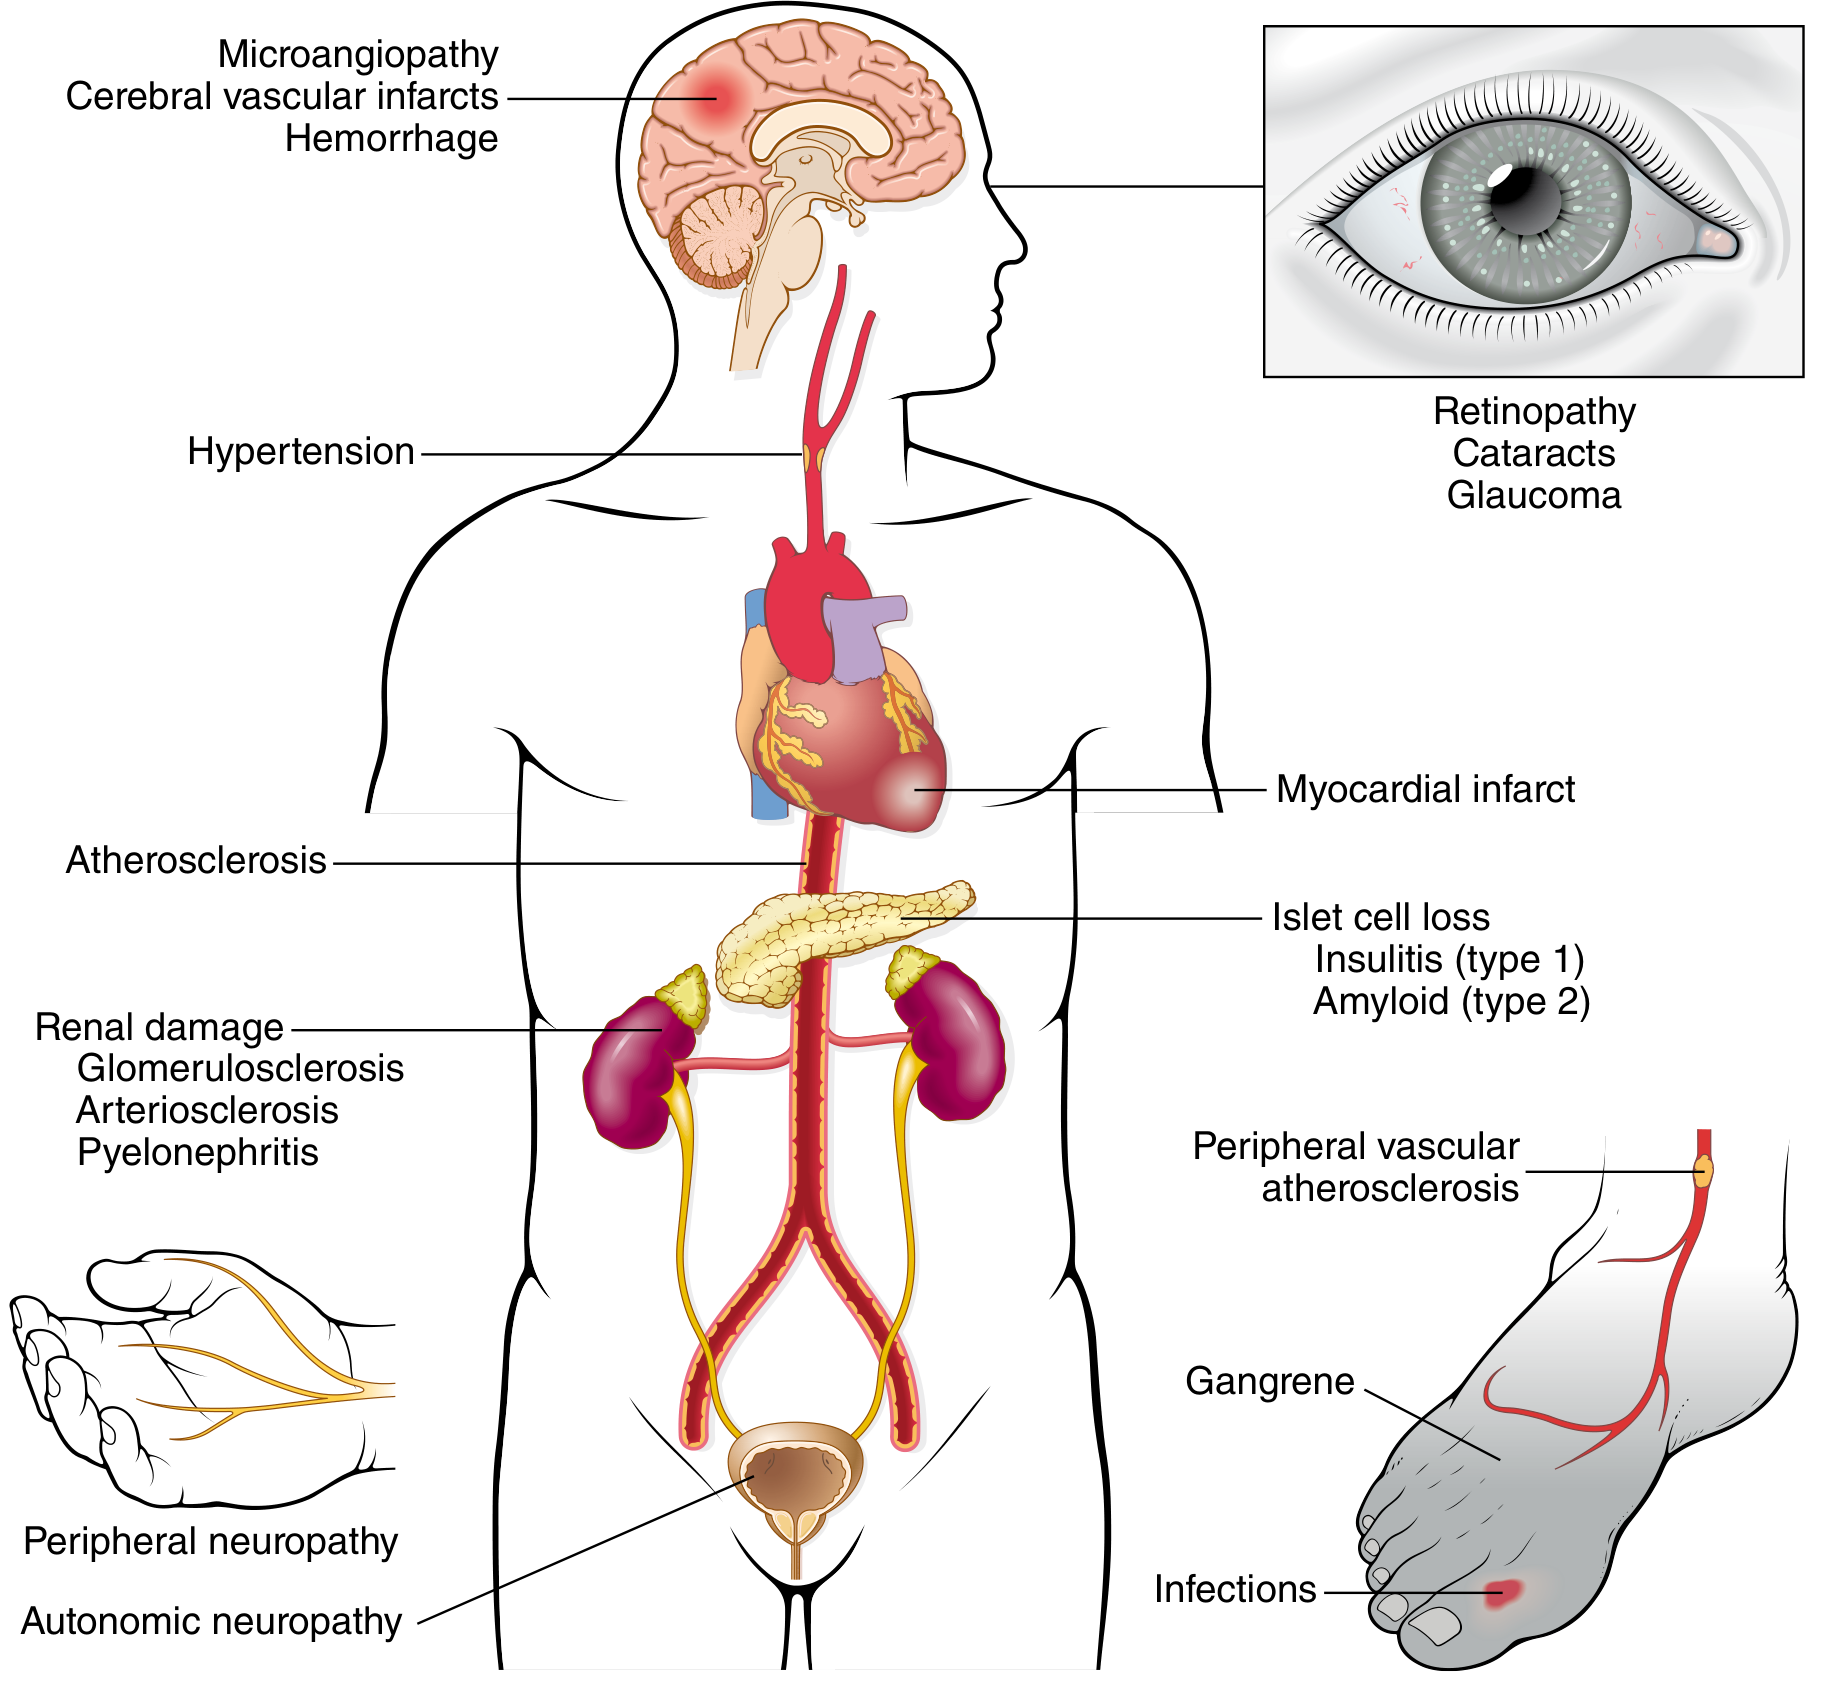
MICROVASCULAR COMPLICATIONS
1. Diabetic Retinopathy
- Microaneurysms - earliest sign; small outpouchings of retinal capillaries (appear as tiny red dots on fundoscopy)
- Hard exudates - yellow lipid deposits from leaking vessels
- Soft exudates / cotton-wool spots - white fluffy patches from nerve fiber layer infarcts (microinfarcts)
- Flame hemorrhages (superficial) and dot-and-blot hemorrhages (deep)
- Venous beading - irregular caliber of retinal veins
- Macular edema - leakage into the macula → blurred central vision (most common cause of visual loss in NPDR)
- Triggered by retinal ischemia → release of VEGF → pathological neovascularization
- New vessels grow on the retinal surface and into the vitreous:
- NVD (neovascularization of the disc)
- NVE (neovascularization elsewhere)
- Complications: vitreous hemorrhage (sudden painless vision loss), tractional retinal detachment, rubeosis iridis (iris neovascularization) → neovascular glaucoma
2. Diabetic Nephropathy
-
Capillary basement membrane thickening - earliest change; begins ~2 years after T1D onset; best seen on electron microscopy; 30% increase in thickness by 5 years
-
Diffuse mesangial sclerosis - diffuse increase in mesangial matrix (PAS-positive deposits); reduces GFR; present in virtually all long-standing diabetics
-
Nodular glomerulosclerosis (Kimmelstiel-Wilson lesions) - pathognomonic for diabetes; ovoid PAS-positive nodules in periphery of glomeruli (mesangial nodules); associated with heavy proteinuria and progressive renal failure
- Renal arteriosclerosis (including efferent arteriole involvement - unique to diabetes; other diseases affect only afferent)
- Pyelonephritis (increased susceptibility to infection)
- Necrotizing renal papillitis (ischemic necrosis of renal papillae)
| Stage | Feature |
|---|---|
| 1 | Hyperfiltration - GFR elevated |
| 2 | Silent - normal UAE, microalbuminuria on stress |
| 3 | Microalbuminuria (30-300 mg/day) - "incipient nephropathy" |
| 4 | Overt proteinuria (>300 mg/day), declining GFR, hypertension |
| 5 | End-stage renal disease (ESRD) - dialysis required |
3. Diabetic Neuropathy
- Affects longest nerves first → "glove-and-stocking" distribution (feet and hands)
- Symptoms: burning, shooting, aching pain, paresthesias (tingling, numbness), "walking on hot coals" sensation
- Loss of: vibration sense, proprioception, light touch, pin-prick, temperature (ALL modalities)
- Loss of ankle jerk reflex (earliest sign)
- Risk of painless injuries → diabetic foot ulcers
- Cardiovascular: resting tachycardia, orthostatic hypotension, "silent ischemia" (40% of MI in diabetics go unrecognized - no chest pain!), sudden cardiac death risk
- GI: gastroparesis (delayed gastric emptying - nausea, vomiting, bloating, post-prandial hypoglycemia), diabetic diarrhea (especially nocturnal), constipation
- Genitourinary: erectile dysfunction (most common in men), neurogenic bladder (urinary retention → overflow incontinence), retrograde ejaculation
- Sudomotor: anhidrosis (reduced sweating), gustatory sweating (face sweats while eating)
- Hypoglycemia unawareness - impaired adrenergic response to hypoglycemia (no sweating, tremor, or palpitations as warning)
- Sudden onset of single nerve palsy
- CN III palsy (most classic diabetic cranial mononeuropathy) - ptosis + eye deviation → "pupil-sparing" CN III palsy (unlike aneurysm which is pupil-involving)
- CN VI, CN IV palsies (diplopia)
- Carpal tunnel syndrome (median nerve)
- Lateral femoral cutaneous nerve (meralgia paresthetica)
- Femoral neuropathy (diabetic amyotrophy) - severe thigh pain, weakness, atrophy
- Asymmetric proximal leg weakness + severe pain
- Thigh muscle wasting
- Self-limiting but can be debilitating
4. Diabetic Foot
- Peripheral neuropathy (loss of protective sensation)
- Peripheral vascular disease (ischemia)
- Excessive plantar pressure + repetitive trauma
- Impaired wound healing
MACROVASCULAR COMPLICATIONS
1. Coronary Artery Disease (CAD)
- Most common cause of death in T2D
- Diabetics have 2-4x the risk of CAD compared to non-diabetics
- "Silent ischemia" - absence of chest pain despite myocardial ischemia (due to cardiac autonomic neuropathy); very common in diabetics
- MI may present atypically: weakness, fatigue, confusion, pain in unusual locations
- Unrecognized MI rate: 40% in diabetics vs 25% in non-diabetics
- Higher risk of heart failure, cardiomyopathy (diabetic cardiomyopathy - independent of CAD)
2. Cerebrovascular Disease (Stroke)
- 2-4x increased risk of ischemic stroke
- Particularly lacunar infarcts (small vessel disease) - as discussed in the previous session
- Also increased risk of large artery atherothrombotic stroke
- Cerebral microangiopathy → cerebral vascular infarcts, small hemorrhages
- Contributes to vascular dementia
3. Peripheral Arterial Disease (PAD)
- Atherosclerosis of lower limb arteries (iliac, femoral, popliteal, tibial)
- Symptoms:
- Intermittent claudication - cramping leg pain on walking, relieved by rest
- Rest pain - severe burning pain at rest, especially at night, in feet
- Critical limb ischemia - non-healing ulcers, gangrene
- Absent or diminished peripheral pulses
- Cold, pale/cyanotic limbs, hair loss over legs
- Leads to gangrene and amputation (macrovascular + microvascular + neuropathy combined)
Summary Diagram
| Category | Complication | Target Organ | Key Clinical Feature |
|---|---|---|---|
| Microvascular | Retinopathy | Eyes | Microaneurysms → neovascularization → blindness |
| Nephropathy | Kidneys | Microalbuminuria → proteinuria → ESRD | |
| Neuropathy (peripheral) | Nerves | Glove-stocking sensory loss, neuropathic pain | |
| Neuropathy (autonomic) | Heart, GI, GU | Silent MI, gastroparesis, erectile dysfunction | |
| Diabetic foot | Lower limbs | Painless ulcers → infection → gangrene | |
| Macrovascular | CAD | Heart | Silent ischemia, MI, heart failure |
| Cerebrovascular disease | Brain | Ischemic stroke (especially lacunar), vascular dementia | |
| PAD | Peripheral arteries | Claudication, rest pain, gangrene, amputation |
Diabetic ketoacidos
diabetic ketoacidosis pathophysiology flowchart diagram
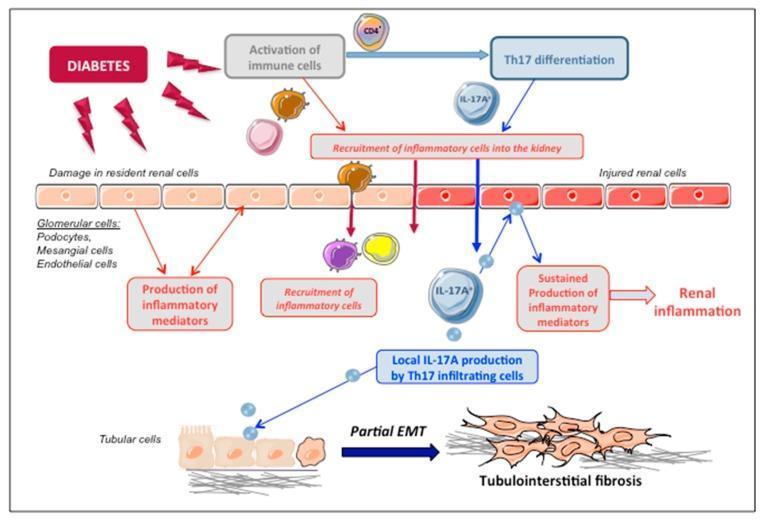
This pathophysiology diagram illustrates the mechanism of IL-17A-mediated renal injury in diabetic nephropathy. The flowchart originates with 'Diabetes' leading to two concurrent pathways: the activation of immune cells and damage to resident renal cells (podocytes, mesangial cells, and endothelial cells). The immune pathway details the differentiation of CD4+ T-lymphocytes into Th17 cells, which infiltrate the kidney and produce local IL-17A. This cytokine acts back on injured renal cells, triggering a feedback loop that leads to the sustained production of inflammatory mediators and chronic renal inflammation. At the cellular level, the diagram highlights the effect of local IL-17A on tubular epithelial cells, depicting a morphological transition labeled as 'Partial EMT' (Epithelial-to-Mesenchymal Transition). Here, structured cuboidal tubular cells transform into elongated, spindle-shaped mesenchymal cells associated with extracellular matrix deposition, ultimately culminating in tubulointerstitial fibrosis. The visual summarizes the interplay between metabolic stress, Th17-driven inflammation, and structural remodeling in the progression of diabetic kidney disease.
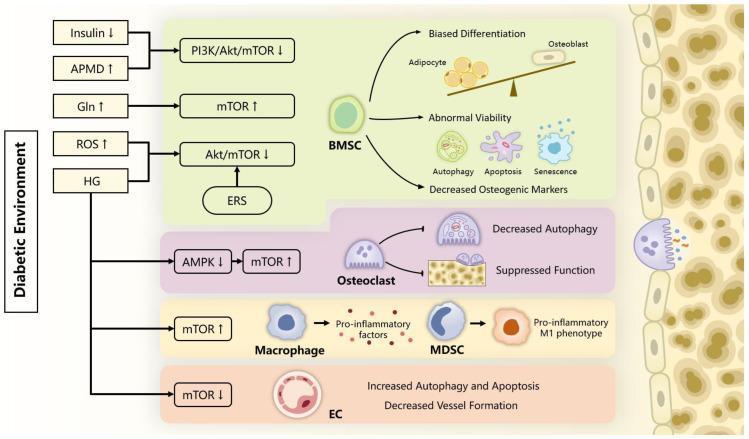
A pathophysiology diagram illustrating the effects of a diabetic environment on bone metabolism and cellular dysfunction via mTOR signaling pathways. The flowchart links diabetic factors (low insulin, high ROS, high glucose/HG) to specific molecular cascades, primarily PI3K/Akt/mTOR and AMPK pathways. The diagram is divided into four cellular sectors: 1) Bone Marrow Stromal Cells (BMSCs): Shows biased differentiation favoring adipocytes over osteoblasts (depicted on a seesaw), abnormal viability (autophagy, apoptosis, and senescence), and decreased osteogenic markers. 2) Osteoclasts: Illustrates decreased autophagy and suppressed resorptive function (lack of bone pits). 3) Immune Cells: Shows macrophages and Myeloid-Derived Suppressor Cells (MDSCs) secreting pro-inflammatory factors and shifting toward a pro-inflammatory M1 phenotype under increased mTOR signaling. 4) Endothelial Cells (EC): Shows increased autophagy/apoptosis and decreased vessel formation. The right side features a cross-section of bone tissue showing structural alterations. This infographic serves as a medical educational resource for understanding secondary skeletal complications in diabetes mellitus, focusing on the imbalance between bone formation and resorption.
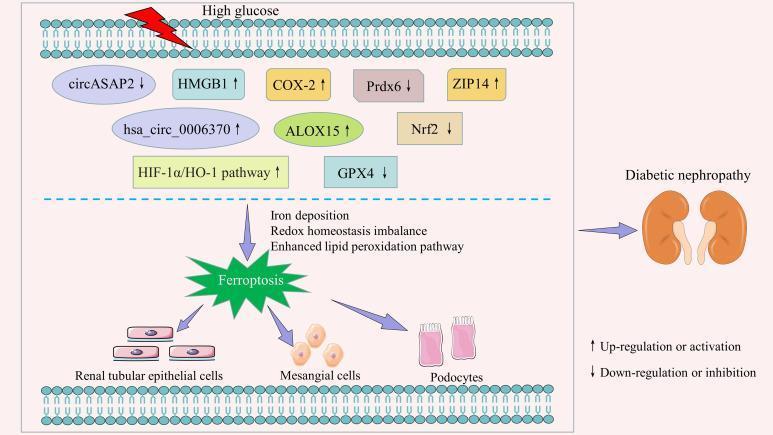
A pathophysiology diagram illustrating the signaling pathways of ferroptosis in the context of diabetic nephropathy (DN). The flowchart begins with high glucose levels triggering a cascade of intracellular changes within the renal environment. Upregulated factors (marked with ↑) include HMGB1, COX-2, ZIP14, hsa_circ_0006370, ALOX15, and the HIF-1̑/HO-1 pathway. Downregulated factors (marked with ↓) include circASAP2, Prdx6, Nrf2, and GPX4. These regulatory imbalances lead to iron deposition, redox homeostasis imbalance, and enhanced lipid peroxidation, converging on the induction of ferroptosis (represented by a central green starburst). The diagram depicts this process affecting three primary renal cell types: renal tubular epithelial cells, mesangial cells, and podocytes. The ultimate clinical outcome is represented by a diagram of human kidneys labeled as 'Diabetic nephropathy'. This educational visual summarizes how metabolic stress in diabetes promotes regulated cell death (ferroptosis) to drive chronic kidney disease progression.
DKA Kussmaul breathing ketoacidosis clinical signs treatment
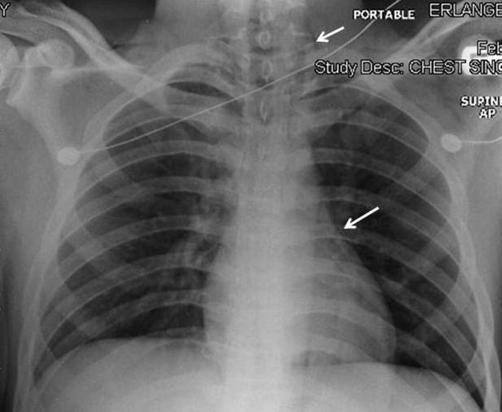
This diagnostic image is an anteroposterior (AP) chest radiograph demonstrating classic signs of barotrauma or air leak. The primary findings include subcutaneous emphysema and pneumomediastinum. Radiographically, subcutaneous emphysema is visible as linear and mottled streaks of air (radiolucency) within the soft tissues of the neck and supraclavicular regions, indicated by the upper arrow. Additionally, the lower arrow highlights pneumomediastinum, characterized by a thin, vertically oriented radiolucent line or gas stripe outlining the left cardiac border and mediastinal pleura. This 'continuous diaphragm sign' or 'spinnaker sail' equivalent suggests free air tracking within the mediastinal space. The clinical context involves a patient with diabetic ketoacidosis (DKA) and Kussmaul respirations, which can lead to alveolar rupture (Macklin effect) and subsequent air dissection. This image is an essential educational resource for identifying extra-alveolar air in pulmonary and emergency medicine.
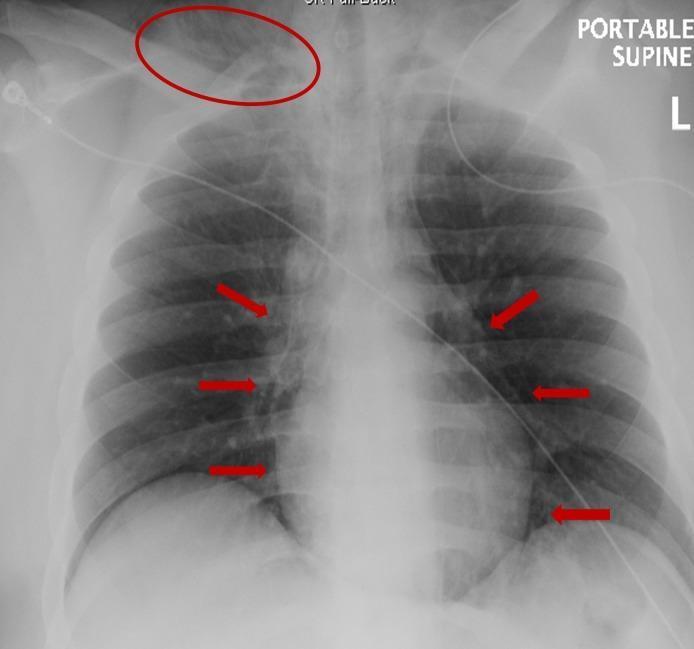
This diagnostic image is a portable supine chest radiograph (X-ray) of a human patient, categorized under clinical imaging and radiology. The image demonstrates hallmark signs of pneumomediastinum and subcutaneous emphysema. Specifically, red arrows point to linear lucencies (air) outlining the mediastinal structures and the heart border, confirming pneumomediastinum. A red circle in the right supraclavicular region highlights radiolucent streaks within the soft tissues, characteristic of subcutaneous emphysema at the right base of the neck. Clinical context suggests these findings may occur secondary to complications like esophageal rupture (Boerhaave syndrome) or diabetic ketoacidosis (DKA). The image includes medical support apparatus, such as ECG leads and potentially an enteric tube, consistent with an intensive care setting. Educational focus includes the identification of extra-alveolar air and its radiographic manifestations in critical care radiology.
Diabetic Ketoacidosis (DKA)
Definition
- D - Hyperglycemia (or known diabetes)
- K - Ketonuria ≥2+ or serum ketones ≥3.0 mmol/L
- A - Arterial/venous pH <7.3 (acidosis)
Precipitating Factors
Most Common
| Factor | Details |
|---|---|
| Infections | #1 precipitant overall - pneumonia, UTI, sepsis |
| Inadequate insulin / non-compliance | Missing doses, deliberate omission (young females omitting insulin for weight loss) |
| New-onset T1D | DKA as first presentation |
| Acute coronary syndrome | MI triggers counter-regulatory hormone surge |
Other Precipitants
-
Cerebrovascular accident, pulmonary embolism, acute pancreatitis
-
Alcohol intoxication
-
Endocrinopathies: Cushing syndrome, thyrotoxicosis, acromegaly
-
Drugs: Corticosteroids, clozapine, olanzapine, cocaine, lithium, thiazides
-
SGLT2 inhibitors (canagliflozin, empagliflozin) - can cause euglycemic DKA (glucose may be normal/only mildly elevated!)
-
Goldman-Cecil Medicine
Pathophysiology
Step 1 - Insulin Deficiency + Counter-Regulatory Hormone Excess
Insulin ↓↓  +  Glucagon ↑, Cortisol ↑, Epinephrine ↑, GH ↑
              ↓
    Three parallel metabolic disasters:
    1. Uncontrolled glucose production + impaired uptake
    2. Uncontrolled lipolysis → ketone production
    3. Catabolism of protein → gluconeogenic substrates
Step 2 - Hyperglycemia
- Liver: Glucagon activates gluconeogenesis and glycogenolysis → massive glucose release
- Peripheral tissues: Without insulin, cells cannot take up glucose → "starvation amid plenty"
- Amino acids (alanine, glutamine) and lactate/pyruvate from muscle flood the liver → more glucose
- Glycerol from fat breakdown → more gluconeogenesis
- Result: Blood glucose typically >250 mg/dL (can exceed 1000 mg/dL)
Step 3 - Ketoacidosis
- Insulin deficiency activates hormone-sensitive lipase in adipose tissue → massive lipolysis → free fatty acids (FFAs) flood the circulation
- Long-chain FFAs enter the liver → undergo beta-oxidation → acetyl-CoA accumulates
- Excess acetyl-CoA cannot enter TCA cycle (oxaloacetate depleted) → diverted to ketogenesis:
- Acetoacetate
- β-hydroxybutyrate (major ketone; NOT detected by nitroprusside strip!)
- Acetone (gives fruity/acetone breath)
- Ketone overproduction exceeds peripheral utilization → ketoacidosis
- Blood becomes acidic (pH <7.3) → high anion gap metabolic acidosis
Step 4 - Osmotic Diuresis and Dehydration
- Hyperglycemia exceeds renal threshold (~180 mg/dL) → glucosuria → osmotic diuresis
- Glucose in the renal tubules draws water, Na+, K+, Mg2+, Ca2+, PO4 3- into urine
- Combined with vomiting and poor oral intake → profound dehydration and electrolyte depletion
Average Fluid and Electrolyte Deficits in Severe DKA:
| Substance | Deficit |
|---|---|
| Water | 70-120 mL/kg |
| Sodium | 8-10 mEq/kg |
| Potassium | 5-7 mEq/kg (total body K+ severely depleted despite normal/high serum K+) |
| Chloride | 6-8 mEq/kg |
| Phosphorus | ~3 mEq/kg |
Step 5 - Acidosis → Respiratory Compensation
-
Acidosis directly depresses mental status
-
Body attempts to compensate: Kussmaul breathing (deep, labored, sighing respiration) = respiratory alkalosis trying to blow off CO2 to raise pH
-
Bicarbonate is consumed as buffer → serum HCO3- drops <18 mmol/L (severe: <10 mmol/L)
-
Rosen's Emergency Medicine; Goldman-Cecil Medicine; Robbins Pathologic Basis of Disease
Clinical Features
Symptoms (History)
| Symptom | Cause |
|---|---|
| Polyuria, polydipsia | Osmotic diuresis |
| Polyphagia (early), then anorexia | Initial starvation state, then nausea sets in |
| Weight loss | Catabolism of fat and muscle |
| Nausea and vomiting | Ketones, gastroparesis, acidosis |
| Abdominal pain | In ~50%, especially children; may mimic acute abdomen (idiopathic); in adults must rule out actual GI pathology as the precipitant |
| Weakness, lethargy | Electrolyte loss, dehydration, acidosis |
| Blurred vision | Osmotic changes in the lens |
| Confusion | Hyperosmolality + acidosis depressing brain function |
Signs (Examination)
| Sign | Mechanism |
|---|---|
| Kussmaul breathing | Deep, sighing, rapid respiration - respiratory compensation for metabolic acidosis |
| Fruity/acetone odor on breath | Acetone volatilization from lungs |
| Tachycardia | Dehydration, hypovolemia |
| Hypotension / orthostatic changes | Volume depletion |
| Dry skin and mucous membranes | Dehydration |
| Reduced jugular venous pressure | Hypovolemia |
| Depressed consciousness / coma | Hyperosmolality + acidosis |
| Fever | Rarely from DKA itself - suggests inciting infection |
| Tachypnea | Respiratory compensation |
| Soft/tender abdomen | Idiopathic in children; must rule out pathology in adults |
Diagnosis and Laboratory Findings
Diagnostic Criteria for DKA:
| Parameter | Mild | Moderate | Severe |
|---|---|---|---|
| Plasma glucose | >250 mg/dL | >250 mg/dL | >250 mg/dL |
| Arterial pH | 7.25 - 7.30 | 7.00 - 7.25 | <7.00 |
| Serum HCO3- | 15 - 18 mEq/L | 10 - 15 mEq/L | <10 mEq/L |
| Urine/serum ketones | Positive | Positive | Positive |
| Anion gap | >10 | >12 | >12 |
| Mental status | Alert | Alert/drowsy | Stupor/coma |
Note on euglycemic DKA: Blood glucose ≤300 mg/dL in up to 18% of patients - especially in those on SGLT2 inhibitors, fasting, or pregnant. Diagnosis based on ketones and acidosis, NOT glucose alone.
Key Laboratory Abnormalities:
- Formula: AG = Na+ - (Cl- + HCO3-)
- Winter's formula for respiratory compensation: Expected PaCO2 = (1.5 × HCO3-) + 8 ± 2
- Urine dipstick and serum nitroprusside test detect acetoacetate and weakly acetone
- β-hydroxybutyrate is NOT detected by nitroprusside! Labs may underestimate severity
- As treatment progresses, β-OHB converts back to acetoacetate → strips may falsely worsen despite improvement
- Gold standard: bedside capillary ketone monitor measuring β-OHB
- Serum K+ is initially normal or HIGH (acidosis drives K+ out of cells in exchange for H+)
- BUT total body K+ is severely depleted by osmotic diuresis
- Once insulin given → K+ shifts back into cells → life-threatening hypokalemia can develop rapidly
- Do NOT give insulin if K+ <3.3 mEq/L - correct K+ first!
- Corrected Na+ = Measured Na+ + 1.6 × [(glucose - 100) / 100]
-
WBC elevated (may reflect acidosis, not necessarily infection - only band neutrophilia suggests infection)
-
Hematocrit/Hb elevated (hemoconcentration)
-
Creatinine may be falsely elevated (autoanalyzer interference from ketones)
-
Amylase elevated in DKA (non-specific) - use lipase if pancreatitis suspected (must be 3x upper limit of normal for diagnosis)
-
ECG: Check for hyper- or hypokalemia signs (peaked T waves = hyperkalemia; flat T, U waves = hypokalemia)
-
Rosen's Emergency Medicine; Goldman-Cecil Medicine
Treatment
Overview ("FRIED" mnemonic)
Step 1 - IV Fluid Resuscitation (FIRST priority)
- Normal saline (0.9% NaCl): 1-2 L IV in first 1-3 hours (adults); 20 mL/kg in first hour (children)
- Continue 0.9% NaCl until hemodynamically stable, then switch to 0.45% NaCl at 4-14 mL/kg/h depending on corrected Na+
- Rehydration reduces catecholamines, increases urinary glucose loss, expands intravascular volume, and reduces glucose rapidly (most of the first 1-2h glucose fall is from fluid expansion)
- In HHS: fluid replacement is relatively slower given comorbidities (cardiac, renal)
Step 2 - Electrolyte Replacement
- K+ <3.3 mEq/L: HOLD insulin, give 20-40 mEq/h K+ IV until K+ ≥3.3 mEq/L
- K+ 3.3-5.0 mEq/L: Give 20-40 mEq K+ per liter IV fluid (keep K+ between 4-5 mEq/L)
- K+ >5.5 mEq/L: Do not add K+; re-check every 2 hours
Step 3 - Insulin
- Start insulin only after K+ ≥3.3 mEq/L confirmed
- IV regular insulin: 0.1 units/kg bolus, then 0.1 units/kg/hour continuous infusion
- Alternatively (mild-moderate DKA): SC rapid-acting insulin 0.1 units/kg every hour
- Expected glucose decline: 50-100 mg/dL per hour
- When glucose ≤300 mg/dL: Change IV fluid to D5W/0.45% NS (add dextrose to prevent hypoglycemia while continuing insulin to clear ketones)
- Resolution criterion: pH ≥7.3, HCO3- ≥18 mEq/L, anion gap normalized - NOT glucose alone
- When eating resumes: start SC long-acting insulin + SC short-acting insulin with 2-4 hour overlap with IV infusion before stopping it
Step 4 - Bicarbonate?
- Generally NOT recommended for most DKA (even severe)
- May be considered if pH <6.9 and hemodynamically unstable
- Risks: Paradoxical CNS acidosis, hypokalemia, delayed ketone clearance, cerebral edema
Step 5 - Find and Treat Precipitant
- Cultures, CXR, ECG, urine analysis
- Treat underlying infection with antibiotics if identified
Monitoring Protocol:
-
Vital signs, urine output, mental status: every 1-4 hours
-
Glucose: every 1-2 hours
-
Electrolytes (K+, HCO3-, anion gap): every 2-4 hours for first 24 hours
-
Harrison's Principles of Internal Medicine 22E; Rosen's Emergency Medicine
Complications of DKA and Its Treatment
| Complication | Details |
|---|---|
| Cerebral edema | Most feared, especially in children; occurs as DKA resolves; risk factors: severe acidosis, young age, rapid fluid/glucose correction; presents with headache, altered consciousness, seizures; treat with mannitol/hypertonic saline |
| Hypokalemia | From insulin therapy shifting K+ into cells; life-threatening arrhythmias; prevent by adequate K+ replacement before/during insulin |
| Hypoglycemia | Failure to add dextrose when glucose <300 mg/dL |
| Hyperchloremic acidosis | From large volumes of normal saline; HCO3- remains low but anion gap normalizes; self-resolving |
| Aspiration | Vomiting + depressed consciousness; nasogastric tube if obtunded |
| Thromboembolism | Hypercoagulability from dehydration + hyperosmolality |
| Mortality | Mainly from sepsis and cardiopulmonary complications (elderly); cerebral edema (children) |
DKA vs. HHS - Quick Comparison
| Feature | DKA | HHS |
|---|---|---|
| Diabetes type | Mainly T1D | Mainly T2D |
| Glucose | >250 mg/dL | >600 mg/dL |
| pH | <7.3 | >7.3 |
| HCO3- | <18 mEq/L | >18 mEq/L |
| Ketones | Strongly positive | Absent/trace |
| Osmolality | Mildly elevated | >320 mOsm/L |
| Onset | Hours to days | Days to weeks |
| Kussmaul breathing | Present | Absent |
| Abdominal pain | Common | Rare |
| Mortality | ~1-5% | Higher (up to 15%) |
Should we check urine ketone or urine acetone in dka
Urine Ketones vs. Urine Acetone in DKA - What to Actually Test
The Three Ketone Bodies in DKA
| Ketone Body | How Formed | Amount in DKA | Detected by Dipstick? |
|---|---|---|---|
| β-Hydroxybutyrate (β-OHB) | Acetoacetate reduced by NADH | Largest fraction (major ketone) | NO |
| Acetoacetate | Direct from fatty acid oxidation | Moderate fraction | YES |
| Acetone | Spontaneous decarboxylation of acetoacetate | Small fraction | Weakly |
The Standard Test: Urine Ketone Dipstick (Nitroprusside Reaction)
- Detects acetoacetate - reacts strongly
- Detects acetone - reacts weakly
- Detects β-hydroxybutyrate - does NOT react at all
- Rosen's Emergency Medicine
Why This Matters Clinically - The Critical Problem
The ratio of β-OHB to acetoacetate in DKA is heavily skewed:
- Normal DKA: β-OHB : acetoacetate = 1:2.8 to 1:3
- Severe DKA with high NADH/NAD ratio (e.g., concurrent alcohol use, lactic acidosis): can be as high as 1:30
Acetoacetate + NADH  ⟶  β-Hydroxybutyrate + NAD+
              ↑
     High NADH pushes this direction
Consequence: False-Negative or Falsely Low Dipstick Results
-
Negative or only trace positive - even in the presence of severe, life-threatening ketoacidosis
-
A clinician relying only on the dipstick could miss DKA entirely
-
National Kidney Foundation Primer on Kidney Diseases; NMS Nephrology; Rosen's Emergency Medicine
The Paradox During Treatment - "Apparent Worsening"
DKA treatment begins (insulin given)
            ↓
β-Hydroxybutyrate → converts BACK to → Acetoacetate
            ↓
Nitroprusside strip NOW detects more acetoacetate
            ↓
Strip shows "more ketones" despite patient IMPROVING!
- Tintinalli's Emergency Medicine; Goldman-Cecil Medicine
What Is the PREFERRED Test?
Gold Standard: Serum/Blood β-Hydroxybutyrate
"Measurement of β-hydroxybutyrate in the blood is preferred over urine testing with nitroprusside-based assays that measure only acetoacetate and acetone."
| Test | What it Detects | Pros | Cons |
|---|---|---|---|
| Urine ketone dipstick (nitroprusside) | Acetoacetate (strong), acetone (weak), β-OHB (nil) | Cheap, fast, widely available | Misses dominant ketone (β-OHB); false negatives in severe DKA; paradoxically "worsens" during recovery |
| Serum β-hydroxybutyrate (lab) | β-OHB directly | Accurate, reflects true ketone burden, can monitor resolution | Requires blood draw, slightly slower |
| Bedside capillary ketone monitor (e.g., Optium Xceed) | β-OHB in capillary blood | Fast, bedside, uses actual dominant ketone | Needs specific device; availability varies |
Sensitivity and Specificity
- Urine ketones (dipstick): Sensitivity 98% for DKA, but specificity only 35-69%
- High sensitivity = good for screening (if negative, DKA unlikely)
- Low specificity = many false positives (starvation ketosis, alcohol, fasting, pregnancy)
- Blood β-OHB measurement: Better overall accuracy and tracks treatment response correctly
Summary: What Should You Do in Practice?
-
Do NOT check "urine acetone" as a standalone test - this is a common misconception. The dipstick tests ketones (mainly acetoacetate), not acetone per se.
-
Urine ketone dipstick is acceptable as an initial screening tool - a positive result (≥2+) supports DKA, but a negative or trace result does NOT exclude it if pH is low and anion gap is elevated.
-
Always check serum/blood β-hydroxybutyrate - this is the preferred and more accurate test.
-
Use blood β-OHB (not urine ketones) to monitor treatment progress - urine ketones will paradoxically appear to worsen or persist long after DKA has resolved.
-
Never use urine ketone dipstick alone to declare DKA resolved - rely on pH, anion gap, and serum HCO3-.
Simple Visual Summary
Standard Urine Dipstick (Nitroprusside):
  Acetone       →  WEAK reaction  ✓ (partial)
  Acetoacetate  →  STRONG reaction ✓ (detected)
  β-OHB         →  NO reaction    ✗ (MISSED - the dominant ketone!)

Blood β-Hydroxybutyrate Monitor:
  Measures the ACTUAL dominant ketone = GOLD STANDARD ✓