Hess charting
Reading File
Finding Sources
Finding Sources
Reading File
Reading File
Here is a comprehensive overview of Hess charting, drawn from Kanski's Clinical Ophthalmology:
Hess Chart (and Lees Screen)
Purpose
A Hess chart is plotted to aid in the diagnosis and monitoring of incomitant strabismus — conditions such as:
- Extraocular muscle palsy (3rd, 4th, or 6th nerve paresis)
- Mechanical or myopathic limitation (thyroid ophthalmopathy, blow-out fracture, myasthenia gravis)
It measures dissociated ocular position as a proxy for extraocular muscle action. Results should always be interpreted alongside other investigations (e.g. field of binocular single vision, prism cover test).
The Hess Screen (Technique)
- The screen displays a tangent pattern on a dark-grey background with red lights at cardinal positions of gaze — a central field (15° from primary position) and a peripheral field (30°); each square = 5° of ocular rotation.
- The eyes are dissociated using red/green goggles: red lens over the fixating eye, green lens over the non-fixating eye.
- Red lights are illuminated one at a time; the patient superimpose a green pointer over each red light.
- The goggles are then reversed and the test repeated for the other eye.
- Software exists to plot Hess charts on a standard computer screen.
The Lees Screen (Alternative)
- Two opalescent glass screens at right angles, bisected by a two-sided plane mirror — this dissociates the eyes without coloured lenses.
- The examiner indicates a target on the illuminated screen; the patient places a pointer on the non-illuminated screen where they perceive the target to be.
- The patient is rotated 90° to repeat for the other eye.
Interpretation Rules
Key principle:
| Chart Feature | Meaning |
|---|---|
| Smaller chart | Eye with the paretic muscle |
| Larger chart | Eye with the overacting yoke muscle |
- The greatest restriction on the smaller chart falls in the direction of action of the paretic muscle.
- The greatest expansion on the larger chart falls in the direction of action of the yoke muscle.
- The angle of deviation is estimated from the disparity between the plotted point and the template (each square = 5°).
Example — Right lateral rectus palsy (Fig. 18.41):
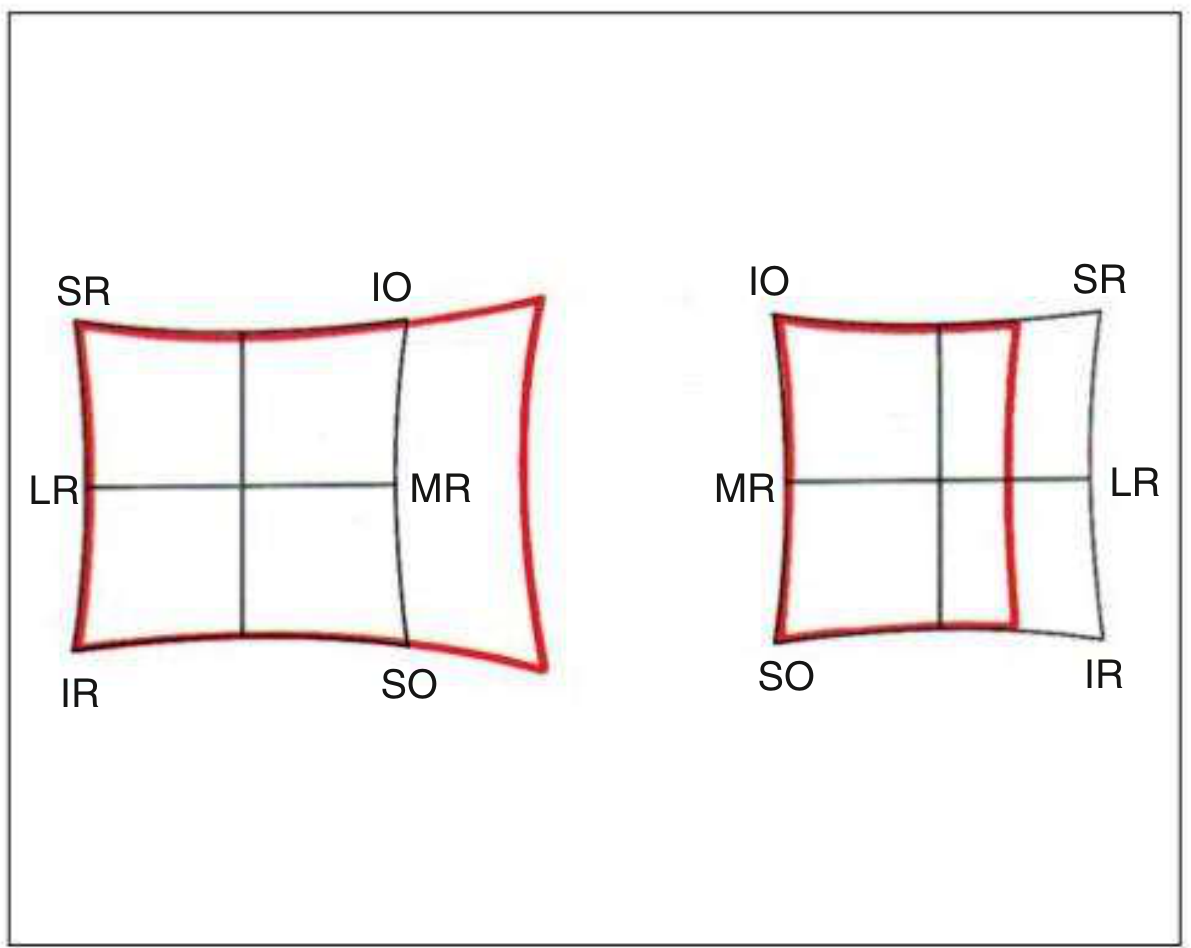
Right chart (smaller) shows restriction to the right; Left chart (larger) shows expansion to the left — overaction of the left medial rectus (yoke of right LR).
Changes with Time
Progressive changes in the Hess chart are characteristic and clinically useful as a prognostic indicator and to guide management:
-
Early (acute palsy): Underaction of the paretic muscle + overaction of its yoke muscle → charts are very incomitant and diagnosis is straightforward.
-
With secondary contracture: The ipsilateral antagonist develops secondary overaction → this causes inhibitional palsy of the antagonist's yoke, which appears as underaction — and may mimic a palsy of the contralateral muscle.
-
Late (longstanding): The two charts become progressively concomitant; it may be impossible to identify the originally paretic muscle.
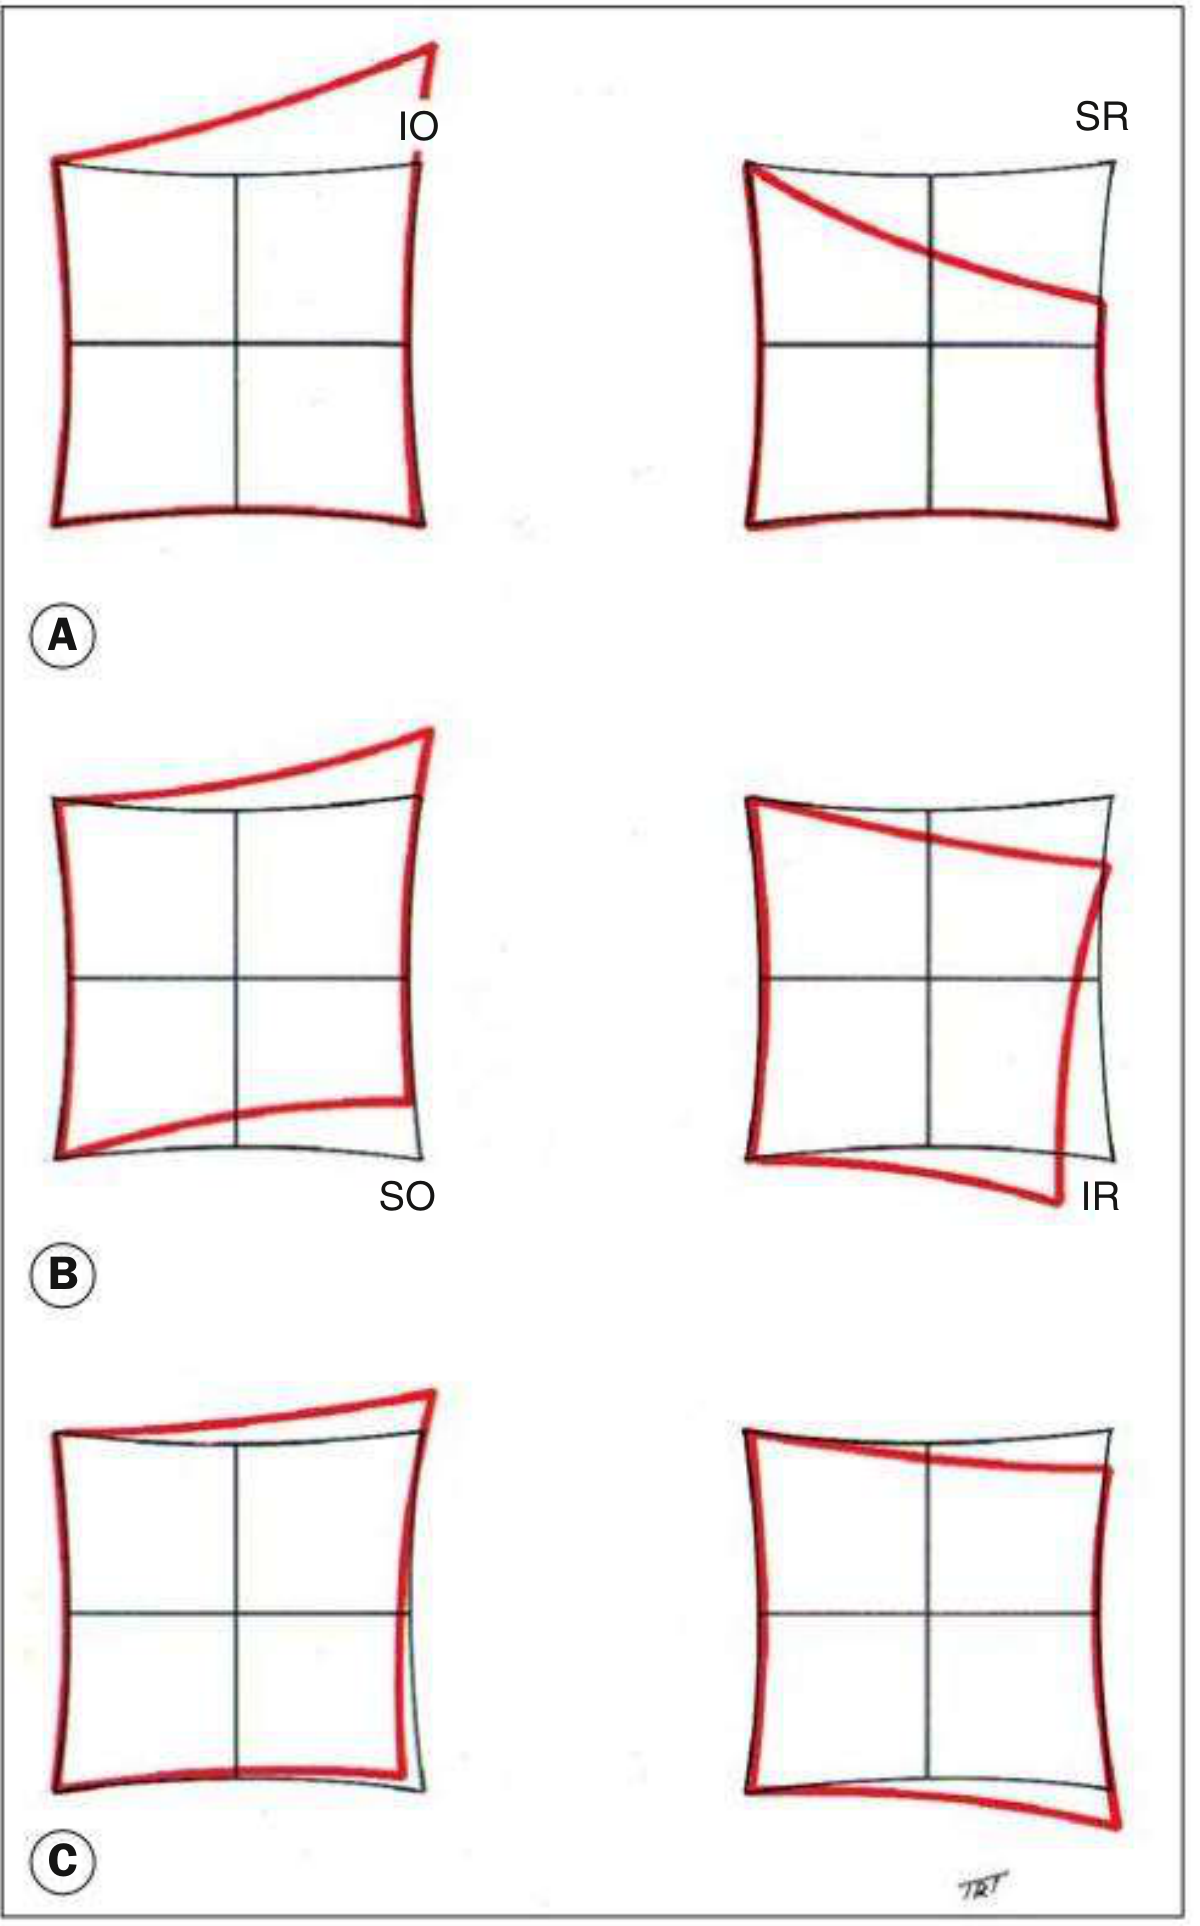
(A) Underaction of right SR + overaction of left IO; (B) secondary overaction of right IR → inhibitional palsy of left SO; (C) concomitant charts — original palsy indeterminate.
Clinical Examples
Left 3rd nerve palsy:
- Left chart (paretic eye): much smaller; underaction of all muscles except LR
- Right chart (yoke eye): larger; overaction of all muscles except MR and IR
- Left exotropia visible: fixation spots deviated laterally; secondary deviation > primary deviation (hallmark of paretic squint)
Right 4th nerve (SO) palsy — recently acquired:
- Right chart: underaction of right SO (depression in adduction)
- Left chart: overaction of left IO (yoke of right SO)
Congenital vs. acquired 4th nerve palsy: Congenital palsies show a more comitant pattern with less separation between the two charts, reflecting long-standing compensatory changes.
— Kanski's Clinical Ophthalmology: A Systematic Approach, 10th Edition
For 20 marks
Here is a structured 20-mark answer on Hess charting:
Hess Chart
Definition and Purpose (2 marks)
The Hess chart is a diagnostic and monitoring tool used in the assessment of incomitant strabismus. It plots dissociated ocular positions as a measure of extraocular muscle action. It is used in conditions such as:
- Cranial nerve palsies (3rd, 4th, 6th)
- Thyroid eye disease
- Blow-out fracture of the orbit
- Myasthenia gravis
Principle (2 marks)
The test is based on Hering's law of equal innervation — equal and simultaneous innervation is sent to yoke muscles. By dissociating the eyes and asking the patient to place one eye's image over the other, any deviation caused by muscle under/overaction is recorded. The difference between the two charts reflects the primary and secondary deviations.
Equipment and Setup (2 marks)
- A tangent screen with a grid pattern; each square = 5° of ocular rotation
- Central field = 15° from primary position; peripheral field = 30°
- Eyes dissociated using red/green goggles: red lens over the fixating eye, green lens over the non-fixating eye
- Red lights are illuminated at cardinal positions; the patient uses a green pointer to superimpose over each red light
- Procedure is repeated with goggles reversed (other eye fixates)
Lees Screen (Alternative) (2 marks)
- Uses two opalescent glass screens at right angles, bisected by a two-sided plane mirror — no coloured lenses needed
- The examiner indicates a target on the illuminated screen; the patient places a pointer on the non-illuminated screen at the perceived matching position
- Patient is rotated 90° and the procedure repeated for the other eye
- Considered more accurate as it eliminates colour rivalry
Reading and Interpretation (4 marks)
| Feature | Interpretation |
|---|---|
| Smaller chart | Eye with the paretic muscle |
| Larger chart | Eye with the overacting yoke muscle |
| Greatest restriction on smaller chart | Direction of action of the paretic muscle |
| Greatest expansion on larger chart | Direction of action of the yoke muscle |
| Each square of disparity | = 5° of deviation |
Example — Right lateral rectus palsy:
- Right (smaller) chart: restricted laterally → underaction of right LR
- Left (larger) chart: expanded medially → overaction of left MR (yoke of right LR)
- Secondary deviation > primary deviation confirms a neurogenic/paretic cause
Changes with Time (4 marks)
Stage 1 — Acute:
- Underaction of paretic muscle; overaction of its yoke muscle
- Charts are markedly incomitant → diagnosis straightforward
Stage 2 — Secondary contracture:
- Ipsilateral antagonist (e.g. right IR in right SR palsy) develops secondary contracture and overaction
- This causes inhibitional (secondary) palsy of its yoke muscle (left SO)
- May be mistaken for a primary palsy of the contralateral muscle
Stage 3 — Spread of comitance:
- Both charts become progressively concomitant
- Original paretic muscle may no longer be identifiable
- Sequential charting over time is crucial to avoid misdiagnosis
Clinical Examples (2 marks)
Right 6th nerve palsy:
- Right chart (smaller): restriction to the right
- Left chart (larger): expansion to the left
Left 3rd nerve palsy:
- Left chart (smaller): underaction of all muscles except LR
- Right chart (larger): overaction of all muscles except MR and IR
- Left exotropia: fixation spots deviated laterally in both charts
Right 4th nerve (SO) palsy:
- Right chart: restriction in depression-adduction (field of right SO)
- Left chart: expansion in elevation-adduction (overaction of left IO, yoke of right SO)
Clinical Uses and Limitations (2 marks)
Uses:
- Diagnosis of which muscle/nerve is affected
- Monitoring recovery or deterioration
- Timing of surgical intervention (charts should be stable for ≥6 months before surgery)
- Differentiating neurogenic, myopathic, and mechanical causes
Limitations:
- Requires the patient to have some degree of binocular vision — not valid in dense amblyopia or suppression
- Results must be interpreted alongside prism cover test and field of binocular single vision
- Long-standing palsies with spread of comitance can be difficult to interpret
— Kanski's Clinical Ophthalmology: A Systematic Approach, 10th Edition
LHON
Finding Sources
Finding Sources
Reading File
Reading File
Reading File
Here is a comprehensive answer on LHON suitable for exam use:
Leber Hereditary Optic Neuropathy (LHON)
Definition (1 mark)
LHON is a rare mitochondrial ganglion cell degeneration that primarily affects the papillomacular bundle, leading to progressive bilateral central visual loss. It is the most common inherited mitochondrial disorder.
Genetics (3 marks)
- Caused by maternally inherited mitochondrial DNA (mtDNA) point mutations affecting respiratory chain complex I genes
- Three primary pathogenic mutations:
Mutation Gene Frequency Prognosis G11778A (most common) MT-ND4 50–90% Worst prognosis T14484C MT-ND6 ~15% Best chance of spontaneous recovery G3460A MT-ND1 ~15% Intermediate - Mutations are usually homoplasmic (100% mutant mtDNA); heteroplasmic in ~15%
- All children of an affected mother inherit the mutation, but only ~10% of cases occur in females — incomplete penetrance with suspected nuclear modifier genes and X-linked susceptibility factors
- Environmental triggers (smoking, alcohol, nutritional deficiency) may precipitate visual loss in carriers
Epidemiology (1 mark)
- Typically affects males aged 15–35 years
- Atypical presentations in females or outside this age range (10–60 years) occur
- LHON should be considered in any bilateral optic neuropathy of unknown cause, regardless of age or sex
Clinical Features (4 marks)
Symptoms
- Acute or subacute, painless, severe central visual loss
- Initially unilateral in ~50%, with the fellow eye affected within weeks to months
- Bilateral simultaneous involvement may occur
Signs — Acute Stage
- Disc hyperaemia with blurring/obscuration of disc margins
- Telangiectatic microangiopathy — dilated, tortuous capillaries on disc surface extending onto peripapillary retina
- Pseudo-oedema — swelling of peripapillary nerve fibre layer (no true leakage)
- Dilatation and tortuosity of posterior pole vasculature
- Colour vision impairment
- Relative afferent pupillary defect (RAPD) — though surprisingly, pupillary light reactions may remain fairly brisk
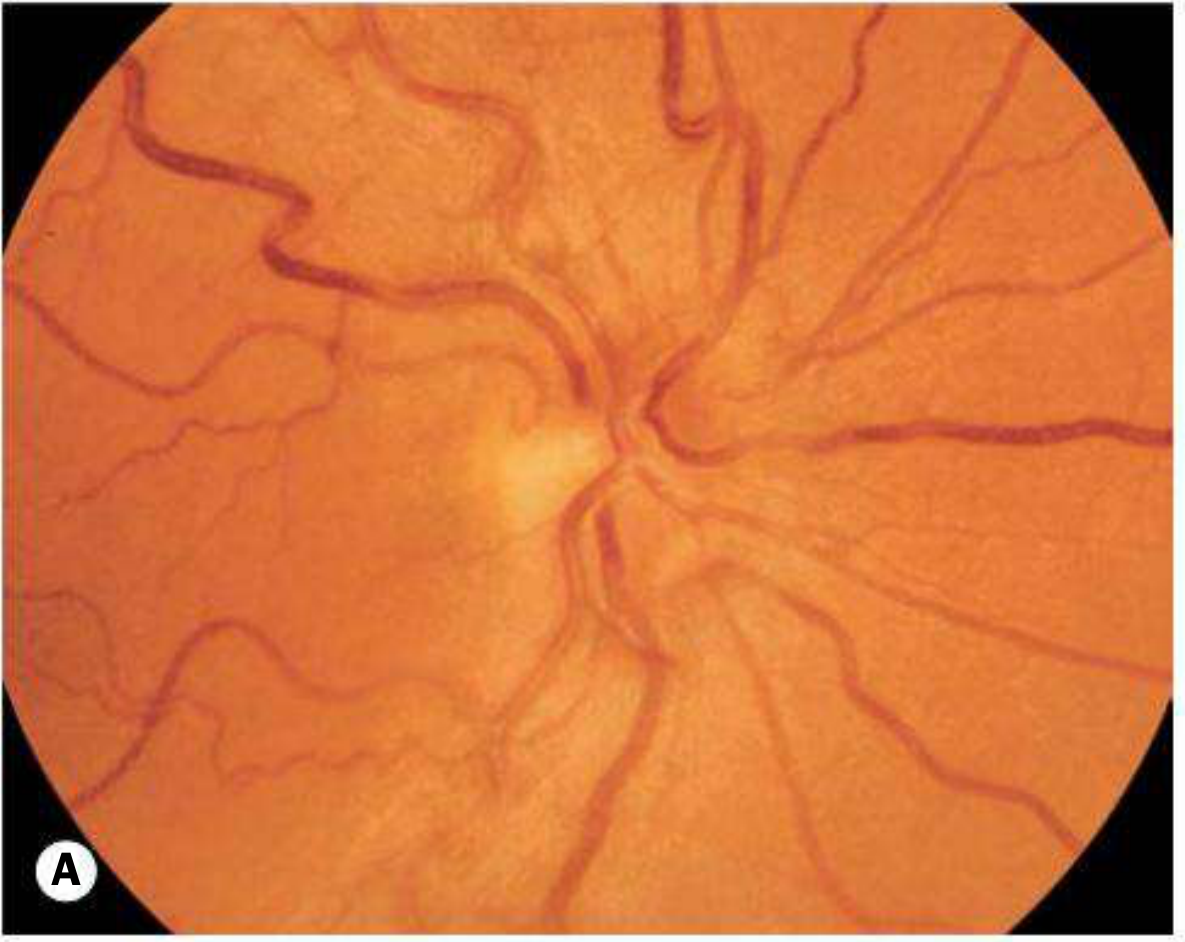
Acute stage: hyperaemic disc with telangiectatic microangiopathy
Signs — Late/Chronic Stage
- Vessels and pseudo-oedema regress
- Severe optic atrophy supervenes
- Nerve fibre layer dropout most pronounced in the papillomacular bundle
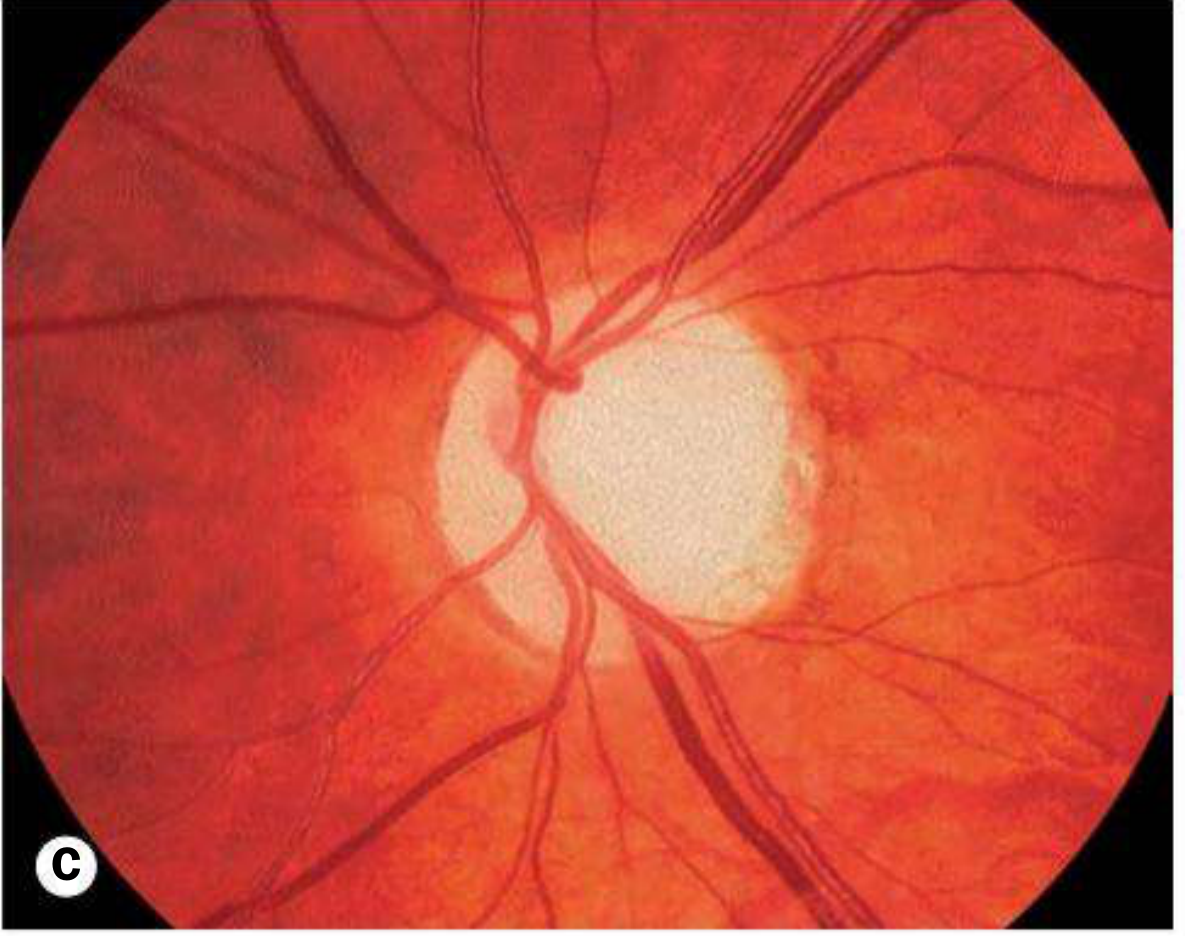
Late stage: optic atrophy
Key clinical clue: Telangiectatic microangiopathy may be present in asymptomatic female carriers
Investigations (2 marks)
- Visual fields: Central or centrocaecal scotomas with preserved peripheral vision
- OCT: Peripapillary retinal nerve fibre layer (RNFL) thinning in affected eyes; unaffected carriers may show temporal RNFL thickening (compensatory mitochondrial accumulation)
- Fluorescein angiography (FA): Crucially, no leakage from disc or microangiopathic vessels (distinguishes pseudo-oedema from true disc oedema)
- Genetic testing: Testing for the three common pathogenic mutations — mandatory in any unexplained bilateral optic neuropathy
Prognosis (1 mark)
- Generally poor — most patients reach a final VA of 6/60 or worse
- Better prognosis if:
- Age of onset < 20 years (especially < 10 years)
- 14484 mutation (highest rate of spontaneous partial recovery)
- Some spontaneous visual recovery possible even years after onset
- 11778 mutation carries the worst prognosis
Treatment (3 marks)
No definitive cure exists. Management includes:
| Intervention | Detail |
|---|---|
| Low vision aids | Symptomatic; cornerstone of management |
| Idebenone (900 mg/day) | Synthetic CoQ10 analogue; neuroprotective; may benefit some patients |
| Mitochondrial cocktails | CoQ10, creatine, alpha-lipoic acid — anecdotal success, especially early in disease or before second eye involvement |
| Vitamin B12 | Use hydroxocobalamin form only — cyanocobalamin form has been reported to worsen outcomes |
| Lifestyle | Avoid smoking and excessive alcohol (environmental precipitants) |
| Gene therapy | Intravitreal AAV vector expressing normal ND4 cDNA — showing promising results in patients with 11778 mutation |
LHON-plus: Rare variants with additional neuromuscular dysfunction (cardiac arrhythmias, peripheral neuropathy, movement disorders).
Key Distinguishing Features (Summary) (1 mark)
| Feature | LHON |
|---|---|
| Inheritance | Maternal (mitochondrial) |
| Sex | Male >> Female (~9:1) |
| Pain | Painless |
| Disc | Pseudo-oedema (no FA leakage) |
| Visual field | Centrocaecal scotoma |
| FA | No leakage |
| Key exam tip | Rule out in any unexplained bilateral optic neuropathy |
— Kanski's Clinical Ophthalmology: A Systematic Approach, 10th Edition; Harrison's Principles of Internal Medicine, 22nd Edition
Accommodative esotropia
Finding Sources
Reading File
Reading File
Here is a complete exam-ready answer on accommodative esotropia:
Accommodative Esotropia
Definition and Pathophysiology (2 marks)
Accommodative esotropia is a convergent squint that arises due to an abnormal relationship between accommodation and convergence. When the eye accommodates to focus on a near target, a proportionate amount of convergence is simultaneously triggered — expressed as the AC/A ratio (accommodative convergence per dioptre of accommodation).
Esotropia results when the convergence driven by accommodation exceeds the patient's fusional divergence amplitude and cannot be controlled.
Classification (2 marks)
Accommodative esotropia is divided into two main types based on whether the AC/A ratio is normal or abnormal:
| Type | AC/A Ratio | Mechanism |
|---|---|---|
| Refractive (most common) | Normal | Excessive hypermetropia drives excessive accommodation → proportionate but uncontrollable convergence |
| Non-refractive | High | Disproportionately large convergence per unit of accommodation, regardless of refractive error |
1. Refractive Accommodative Esotropia (3 marks)
- AC/A ratio is normal
- Caused by excessive hypermetropia (typically +2.00 to +7.00 D)
- The large degree of accommodation needed to focus on even a distant target triggers convergence beyond the fusional divergence amplitude
- Deviation is similar for distance and near (usually <10Δ difference)
- Typical age of onset: 18 months – 3 years (range: 6 months – 7 years)
Subtypes:
Fully accommodative esotropia:
- Esotropia present when glasses are removed
- Deviation completely eliminated and BSV restored at all distances with full optical correction of hypermetropia
- The goal of management
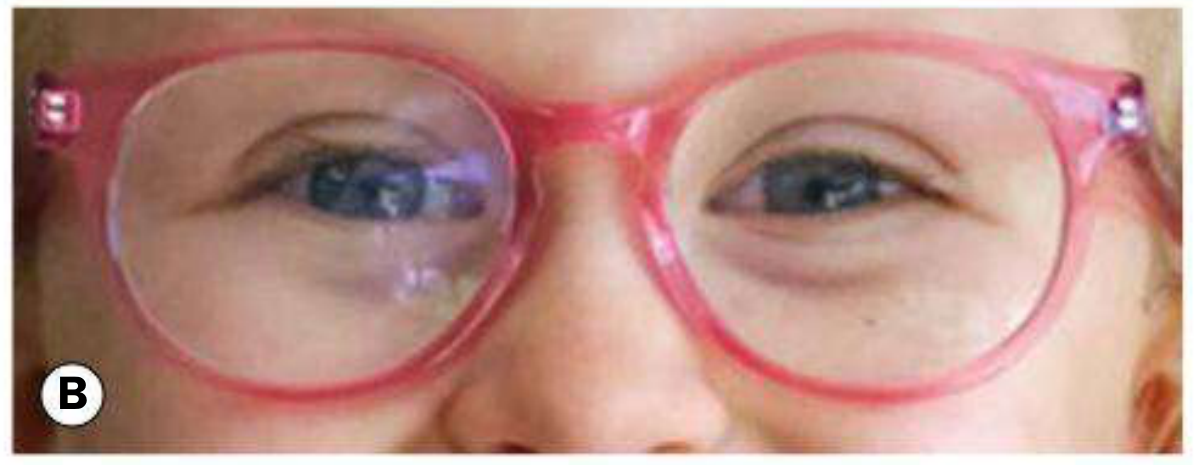
Right esotropia without glasses (top); straight eyes with glasses (bottom)
Partially accommodative esotropia:
- Deviation is reduced but not eliminated by full optical correction
- A non-accommodative (structural) component co-exists
- Amblyopia is frequent; bilateral congenital superior oblique weakness may be associated
- Suppression is common; ARC may occur (but lower grade than in microtropia)
2. Non-Refractive Accommodative Esotropia (2 marks)
The AC/A ratio is high — a unit increase in accommodation produces a disproportionately large convergence response. Hypermetropia frequently coexists but is not the primary cause.
Subtypes:
Convergence excess (most common non-refractive type):
- High AC/A due to increased accommodative convergence (accommodation is normal; convergence is excessive)
- Normal near point of accommodation
- Esotropia greater at near than at distance (key distinguishing feature)
- Distance deviation may be minimal or absent
Hypoaccommodative esotropia (convergence excess with accommodative insufficiency):
- High AC/A ratio due to reduced accommodation (convergence is normal; accommodation is deficient)
- Near point of accommodation is recessed
- Child must over-accommodate to see clearly at near → excessive convergence
Sensory Adaptations (1 mark)
- Suppression of the squinting eye is most common
- Amblyopia is frequent — must be actively screened for and treated
- Anomalous retinal correspondence (ARC) may develop but is of lower grade than in microtropia
Management (4 marks)
1. Amblyopia Treatment
- Must be addressed before any surgery
- Patching or penalisation of the dominant eye
2. Optical Correction (Spectacles)
- Full cycloplegic refraction under cycloplegia is mandatory — even in infants (irrespective of age, all children with esotropia should undergo cycloplegic refraction)
- For refractive type: Full correction of hypermetropia eliminates or reduces the deviation
- After age 8: manifest (non-cycloplegic) refraction; prescribe maximum tolerable "plus"
3. Bifocals
- Indicated in convergence excess esotropia — relieves near accommodation and thereby accommodative convergence, allowing bifoveal fixation at near
- Executive bifocal type preferred: the segment line crosses the lower border of the pupil
- The minimum "add" required is prescribed; gradually reduced and eliminated in early teens
- Also used in hypoaccommodative esotropia where AC/A is not grossly elevated
4. Surgery
- Considered only if spectacles do not fully correct the deviation and amblyopia has been maximally treated
- Bilateral medial rectus recessions — first choice when near deviation > distance deviation
- For equal distance/near deviation: bilateral MR recessions or unilateral recession/resection
- For residual amblyopia: surgery on the amblyopic eye
- Partially accommodative esotropia: surgery aims to correct only the residual squint present with glasses; best delayed until the child requests it (avoids early consecutive exotropia)
- Faden (posterior fixation suture) operation or pulley fixation of MR — used as primary procedure or after under-correction from bimedial recessions in convergence excess
Prognosis:
- Prognosis for spectacle withdrawal depends on magnitude of AC/A ratio and degree of hypermetropia/astigmatism
- Fully accommodative esotropia controlled by glasses → some patients achieve microtropia or true BSV over time
Summary Table (1 mark)
| Feature | Refractive | Non-Refractive (Convergence Excess) |
|---|---|---|
| AC/A ratio | Normal | High |
| Cause | High hypermetropia | High convergence per unit accommodation |
| Distance vs near deviation | Equal (< 10Δ difference) | Near > Distance |
| Treatment | Full spectacle correction | Bifocals ± surgery |
— Kanski's Clinical Ophthalmology: A Systematic Approach, 10th Edition
For 20 marks
The answer above is already structured at a 20-mark level, but here it is reformatted with explicit mark allocations totalling 20:
Accommodative Esotropia — 20 Marks
Definition and Pathophysiology (2 marks)
Accommodative esotropia is a convergent squint resulting from an abnormal relationship between accommodation and convergence. When the eye accommodates to focus on a near target, convergence is simultaneously triggered — this relationship is quantified as the AC/A ratio (amount of accommodative convergence in prism dioptres per dioptre of accommodation).
Esotropia results when the convergence driven by accommodation exceeds the patient's fusional divergence amplitude and cannot be controlled, producing a manifest inward deviation.
AC/A Ratio (1 mark)
- Normal AC/A ratio: ~3–5 Δ per dioptre of accommodation
- High AC/A ratio: convergence response is disproportionately large → near deviation > distance deviation
- Abnormalities of AC/A ratio are the central mechanism in accommodative esotropia
Classification (1 mark)
| Type | AC/A Ratio | Primary Mechanism |
|---|---|---|
| Refractive | Normal | Excessive hypermetropia → excessive accommodation → proportionate but uncontrollable convergence |
| Non-refractive | High | Disproportionate convergence per unit of accommodation, regardless of refractive error |
Type 1 — Refractive Accommodative Esotropia (4 marks)
- AC/A ratio is normal
- Caused by uncorrected hypermetropia, typically +2.00 to +7.00 D
- Large accommodation required even for distance fixation → proportionate convergence exceeds fusional reserve → manifest esotropia
- Deviation is similar for distance and near (difference usually < 10Δ)
- Age of onset: 18 months – 3 years (range: 6 months – 7 years)
- All children with esotropia must undergo cycloplegic refraction, irrespective of age
Subtypes:
Fully accommodative esotropia:
- Esotropia present without spectacles
- Deviation completely eliminated with full optical correction of hypermetropia
- BSV restored at all distances with glasses
- Goal of optical management
Partially accommodative esotropia:
- Deviation reduced but not eliminated by full optical correction
- A non-accommodative (structural) component co-exists
- Amblyopia is frequent; bilateral congenital superior oblique weakness may be associated
- Suppression common; ARC may occur (lower grade than in microtropia)
Type 2 — Non-Refractive Accommodative Esotropia (3 marks)
High AC/A ratio → disproportionately large convergence per unit of accommodation. Hypermetropia frequently coexists but is not the primary cause.
Subtype A — Convergence Excess (most common):
- High AC/A due to increased accommodative convergence (accommodation is normal; convergence is excessive)
- Normal near point of accommodation
- Esotropia significantly greater at near than at distance — hallmark feature
- Distance deviation may be minimal or absent
Subtype B — Hypoaccommodative Esotropia:
- High AC/A due to reduced accommodation (convergence is normal; accommodation is insufficient)
- Recessed near point of accommodation
- Child over-accommodates to see clearly at near → excessive convergence response
Sensory Adaptations (1 mark)
- Suppression of squinting eye — most common
- Amblyopia — frequent; must be screened and treated before surgery
- Anomalous retinal correspondence (ARC) — may develop; lower grade than in microtropia
Management (6 marks)
Step 1 — Treat Amblyopia
- Patching or penalisation of the fixing eye
- Must be maximally treated before any surgical intervention
Step 2 — Optical Correction
Refractive type:
- Full cycloplegic refraction — prescribe full hypermetropic correction
- Under age 8: cycloplegic refraction; full "plus" prescribed
- Over age 8: manifest refraction; maximum tolerable "plus" prescribed
- Fully accommodative esotropia → glasses alone restore BSV
- Partially accommodative esotropia → glasses reduce but do not eliminate the deviation
Non-refractive (convergence excess) type:
- Bifocal spectacles — relieve near accommodation → reduce accommodative convergence → allow bifoveal fixation at near
- Executive bifocal preferred: segment line crosses the lower border of the pupil
- Prescribe the minimum "add" to achieve alignment at near
- Segment strength gradually reduced and eliminated by early teenage years
- Also used in hypoaccommodative esotropia if AC/A is not grossly elevated
Step 3 — Surgery
Indicated when spectacles fail to fully correct the deviation and amblyopia has been maximally treated.
| Situation | Procedure |
|---|---|
| Near deviation > distance deviation | Bilateral medial rectus recessions |
| Equal distance and near deviation, equal vision | Bilateral MR recessions OR unilateral MR recession + LR resection |
| Residual amblyopia | Operate on the amblyopic eye |
| Convergence excess after bimedial recessions | Faden (posterior fixation suture) or pulley fixation of MR |
| Partially accommodative — residual squint | Surgery only for residual non-accommodative component; delayed until child requests it (avoids early consecutive exotropia) |
Prognosis (1 mark)
- Fully accommodative esotropia: excellent if glasses worn consistently; may eventually achieve microtropia or true BSV
- Partially accommodative: residual structural component usually requires surgery for cosmesis
- Prognosis for spectacle withdrawal depends on:
- Magnitude of AC/A ratio
- Degree of hypermetropia and astigmatism
- Some patients require glasses only for close work long-term
Summary Comparison Table (1 mark)
| Feature | Refractive | Non-Refractive (Convergence Excess) |
|---|---|---|
| AC/A ratio | Normal | High |
| Driving factor | High hypermetropia | High convergence response |
| Distance vs near | Equal deviation | Near > Distance |
| Age of onset | 18 months – 3 years | Slightly later, school age |
| Primary treatment | Full spectacle correction | Bifocals ± surgery |
| Surgery target | Residual squint with glasses | Deviation not controlled by bifocals |
— Kanski's Clinical Ophthalmology: A Systematic Approach, 10th Edition
This is a shared conversation. Sign in to Orris to start your own chat.