
Explain wiggers diagram
The Wiggers diagram is a graph that shows the timing relationships between cardiac pressure changes, volume changes, heart sounds, and the ECG during a single cardiac cycle. Here is a quick overview:
- Pressure curves: Shows aortic pressure, left ventricular pressure, and left atrial pressure plotted against time
- Volume curve: Left ventricular volume rises during filling and falls during ejection
- ECG: The P wave, QRS complex, and T wave are aligned below to show which electrical event triggers each mechanical event
- Heart sounds: S1 (mitral/tricuspid closure) and S2 (aortic/pulmonary closure) are marked at their correct positions
Searching sources...
Reading File
Finding Sources
Searching the Web
Wiggers diagram cardiac cycle explained phases
Finding Sources
Loading Image
Reading File
Reading File
Reading File
Reading File
Reading File
Finding Sources
Reading File
Reading File
I now have rich content from multiple authoritative textbooks. Let me also fetch the Wiggers diagram image.
Loading Image
Loading Image
I now have everything needed for a thorough, well-illustrated explanation. Here is the complete answer:
The Wiggers Diagram
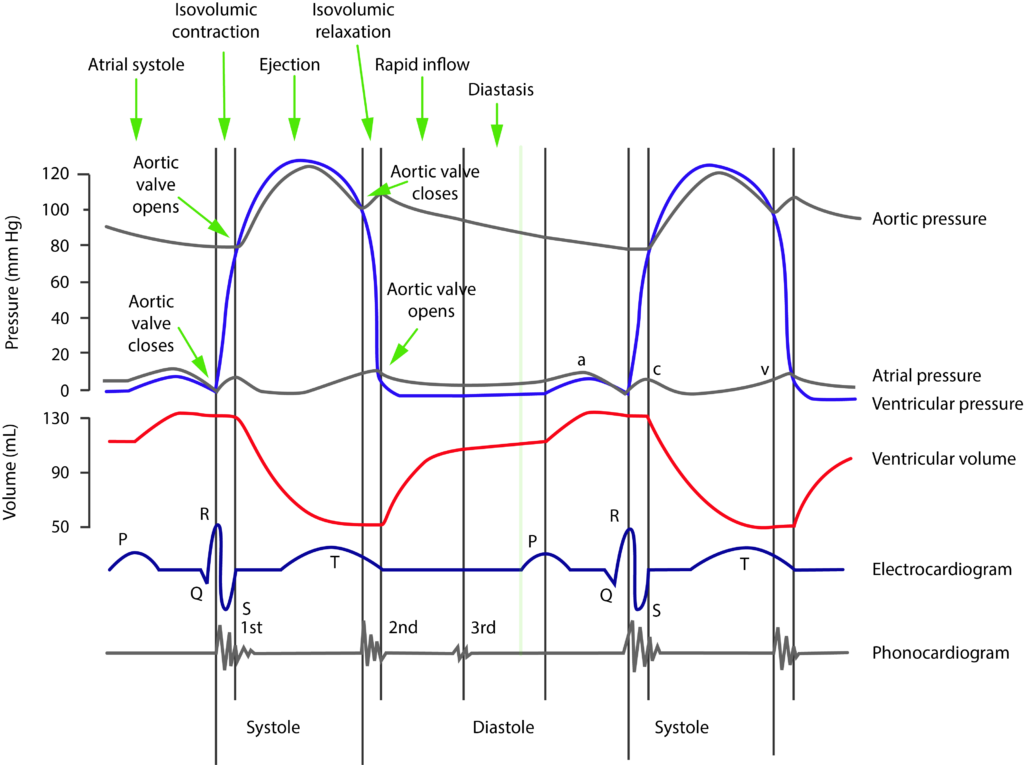
The Wiggers diagram is a multi-panel graph that displays all the key mechanical and electrical events of a single cardiac cycle simultaneously, plotted against time. It was developed by cardiologist Carl J. Wiggers and is considered the standard teaching tool for cardiovascular physiology.
Here is the full labeled diagram:
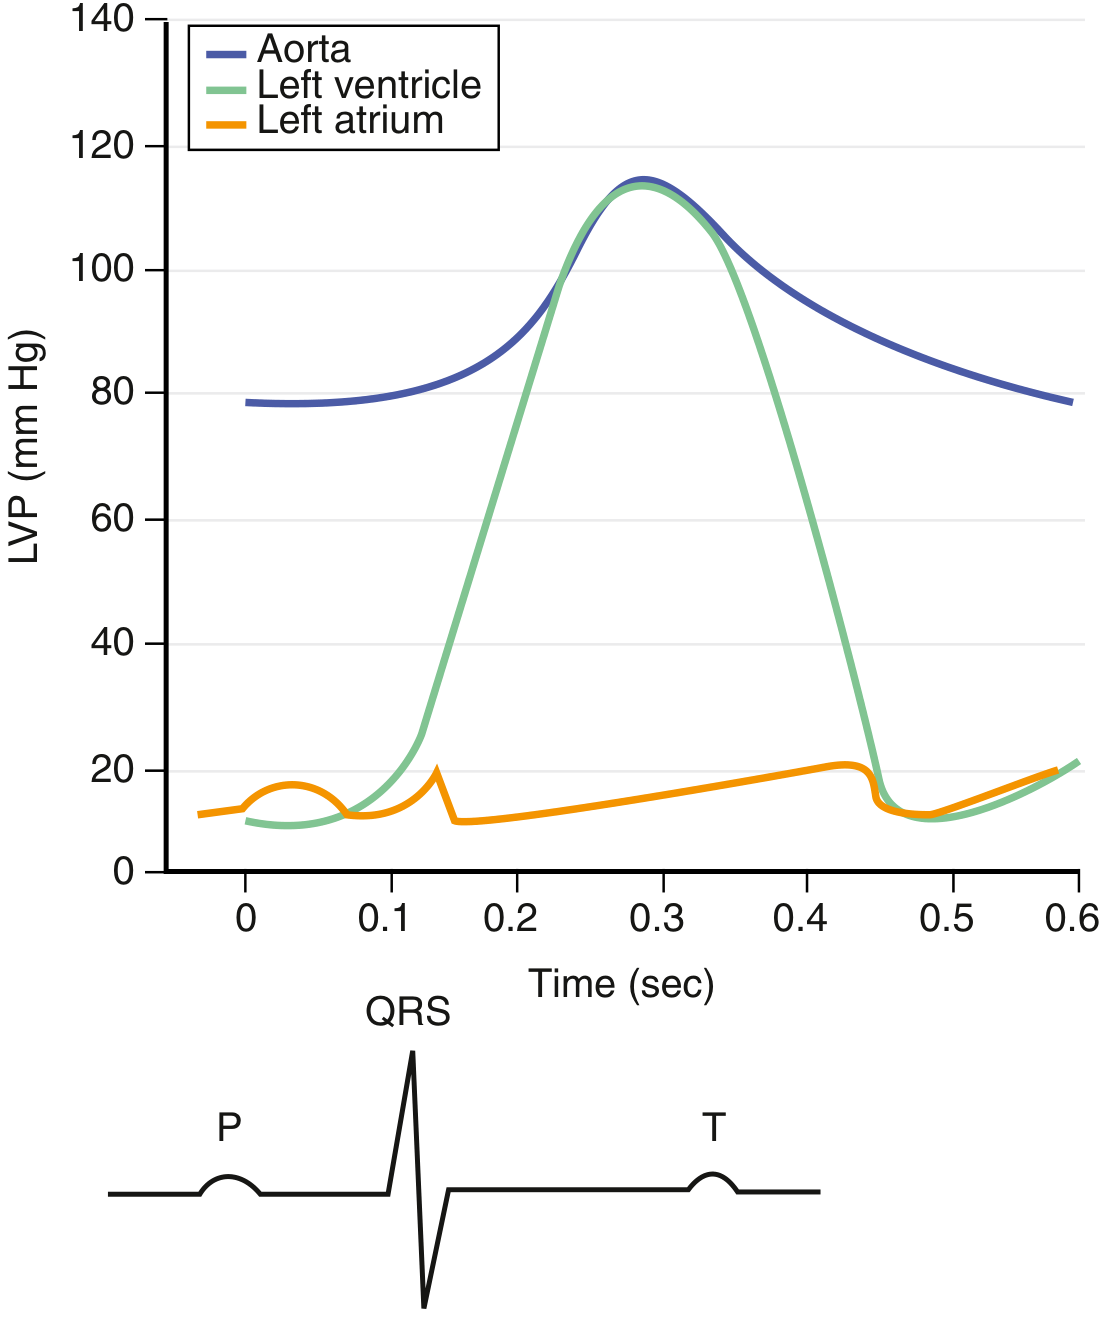
And from the Goldman-Cecil Medicine textbook, showing the pressure curves with ECG:
What the Diagram Contains
The diagram stacks six rows of information aligned to the same time axis:
| Row | What it shows |
|---|---|
| Aortic pressure | Stays between ~80 mmHg (diastole) and ~120 mmHg (systole); notch on the downstroke = dicrotic notch (aortic valve closure) |
| Left ventricular (LV) pressure | Rises from near 0 to ~120 mmHg during systole, then falls back |
| Left atrial (LA) pressure | Low (~8-15 mmHg); shows the a, c, and v waves |
| LV volume | Starts ~130 mL (end-diastolic), falls to ~50 mL (end-systolic) during ejection |
| ECG | P, QRS, T waves aligned to show which electrical event drives each mechanical event |
| Phonocardiogram | S1, S2, (S3, S4) sounds marked at the correct positions |
The Four Phases of the Cardiac Cycle
Phase 1 - Diastole (Ventricular Filling)
- The mitral and tricuspid (AV) valves open when LV pressure falls below LA pressure
- Three sub-phases:
- Rapid filling - blood rushes in passively; accounts for most of the LV volume increase
- Diastasis - pressures equalize, filling nearly stops
- Atrial systole (atrial kick) - triggered by the P wave on ECG; atria contract and add the final ~20% of ventricular filling; generates the a wave in LA pressure
- LV volume rises from ~50 mL toward ~130 mL (end-diastolic volume, EDV)
Phase 2 - Isovolumetric Contraction (start of Systole)
- Triggered by the QRS complex; ventricular myocytes depolarize and begin contracting
- LV pressure rises sharply
- Both AV and semilunar valves are closed - no blood exits or enters the ventricle
- Volume stays constant (hence "isovolumetric")
- When LV pressure exceeds aortic pressure (~80 mmHg), the aortic valve opens
- S1 ("lub") - caused by AV valve closure (mitral then tricuspid); marks the start of systole
Phase 3 - Ventricular Ejection (Systole continues)
- Aortic valve is open; blood is ejected into the aorta
- Sub-phases:
- Rapid ejection - LV pressure peaks (~120 mmHg); flow is fast
- Reduced ejection - LV starts to relax, ejection slows; the T wave corresponds to ventricular repolarization here
- When LV pressure falls below aortic pressure, the aortic valve closes - the dicrotic notch appears on the aortic pressure trace at this exact moment
- LV volume falls from ~130 mL to ~50 mL; the ~80 mL ejected = stroke volume; ejection fraction = ~60%
Phase 4 - Isovolumetric Relaxation (start of Diastole)
- Both valves again closed - volume constant while pressure falls rapidly
- LV pressure drops until it falls below LA pressure, then the mitral valve opens and Phase 1 begins again
- S2 ("dub") - caused by aortic then pulmonic valve closure; marks the start of diastole
The Atrial Pressure Waves (a, c, v)
| Wave | Cause |
|---|---|
| a wave | Atrial contraction (follows P wave) |
| c wave | Mitral valve bulging back into atrium at the start of isovolumetric contraction |
| v wave | Passive atrial filling while the mitral valve is closed during systole |
Heart Sounds Summary
| Sound | Timing | Cause |
|---|---|---|
| S1 ("lub") | Beginning of systole | Closure of mitral and tricuspid valves |
| S2 ("dub") | Beginning of diastole | Closure of aortic and pulmonic valves |
| S3 | Early diastole (after S2) | Rapid ventricular filling; normal in youth, pathologic in heart failure |
| S4 | Late diastole (before S1) | Atrial contraction against a stiff ventricle (e.g., hypertrophy) |
Key Clinical Correlations
-
Prolonged isovolumetric contraction with no ejection suggests outflow obstruction (e.g., aortic stenosis)
-
Loss of the a wave in atrial pressure suggests atrial fibrillation (no coordinated atrial contraction)
-
Prominent v wave in LA/pulmonary capillary wedge pressure suggests mitral regurgitation
-
Widened S2 splitting that does not change with breathing (fixed splitting) is a hallmark of ASD
-
Increased heart rate shortens diastole far more than systole - at very high rates the ventricle does not fill adequately before the next contraction
-
Medical Physiology (Boron & Boulpaep), Table 22-1 and Fig. 22-2 - Goldman-Cecil Medicine, E-Fig. 41-4
-
Braunwald's Heart Disease, Fig. 46.16 - Guyton and Hall Medical Physiology, Fig. 9.8
Explain cardiac cycle in detail
The cardiac cycle is the complete sequence of events from one heartbeat to the next, encompassing electrical activation, mechanical contraction, valve movements, pressure changes, and ventricular volume changes. It has two main phases - systole (contraction/ejection) and diastole (relaxation/filling) - and repeats ~72 times per minute at rest.
Searching sources...
Reading File
Finding Sources
Searching the Web
cardiac cycle detailed phases systole diastole pressure volume physiology
Good - I'll read from the best physiology sources (Costanzo, Medical Physiology/Boron, Guyton & Hall, and Braunwald's) in parallel, along with the echocardiography textbook for extra depth.
Reading File
Reading File
Reading File
Loading Image
Reading File
Reading File
Loading Image
Reading File
Finding Sources
Finding Sources
Reading File
Reading File
Loading Image
Excellent - I have the full Costanzo cardiac cycle diagram (phases A-G). Let me get the pressure-volume loop image and the remaining phase text.
Loading Image
Reading File
I now have all the content and images needed for a comprehensive, textbook-level explanation. Here is the complete answer:
The Cardiac Cycle - A Detailed Explanation
The cardiac cycle is the complete sequence of mechanical and electrical events that repeats with every heartbeat - from the beginning of one contraction to the beginning of the next. At a resting heart rate of 75 beats/min, one complete cycle lasts ~0.8 seconds (800 ms). The cycle is driven by the electrical pacemaker of the sinoatrial (SA) node and involves precisely timed changes in pressure, volume, valve positions, and blood flow across all four chambers.
The Wiggers Diagram - All Events Together
This is the full cardiac cycle (Costanzo Physiology, Fig. 4.25), showing all seven phases labeled A through G:
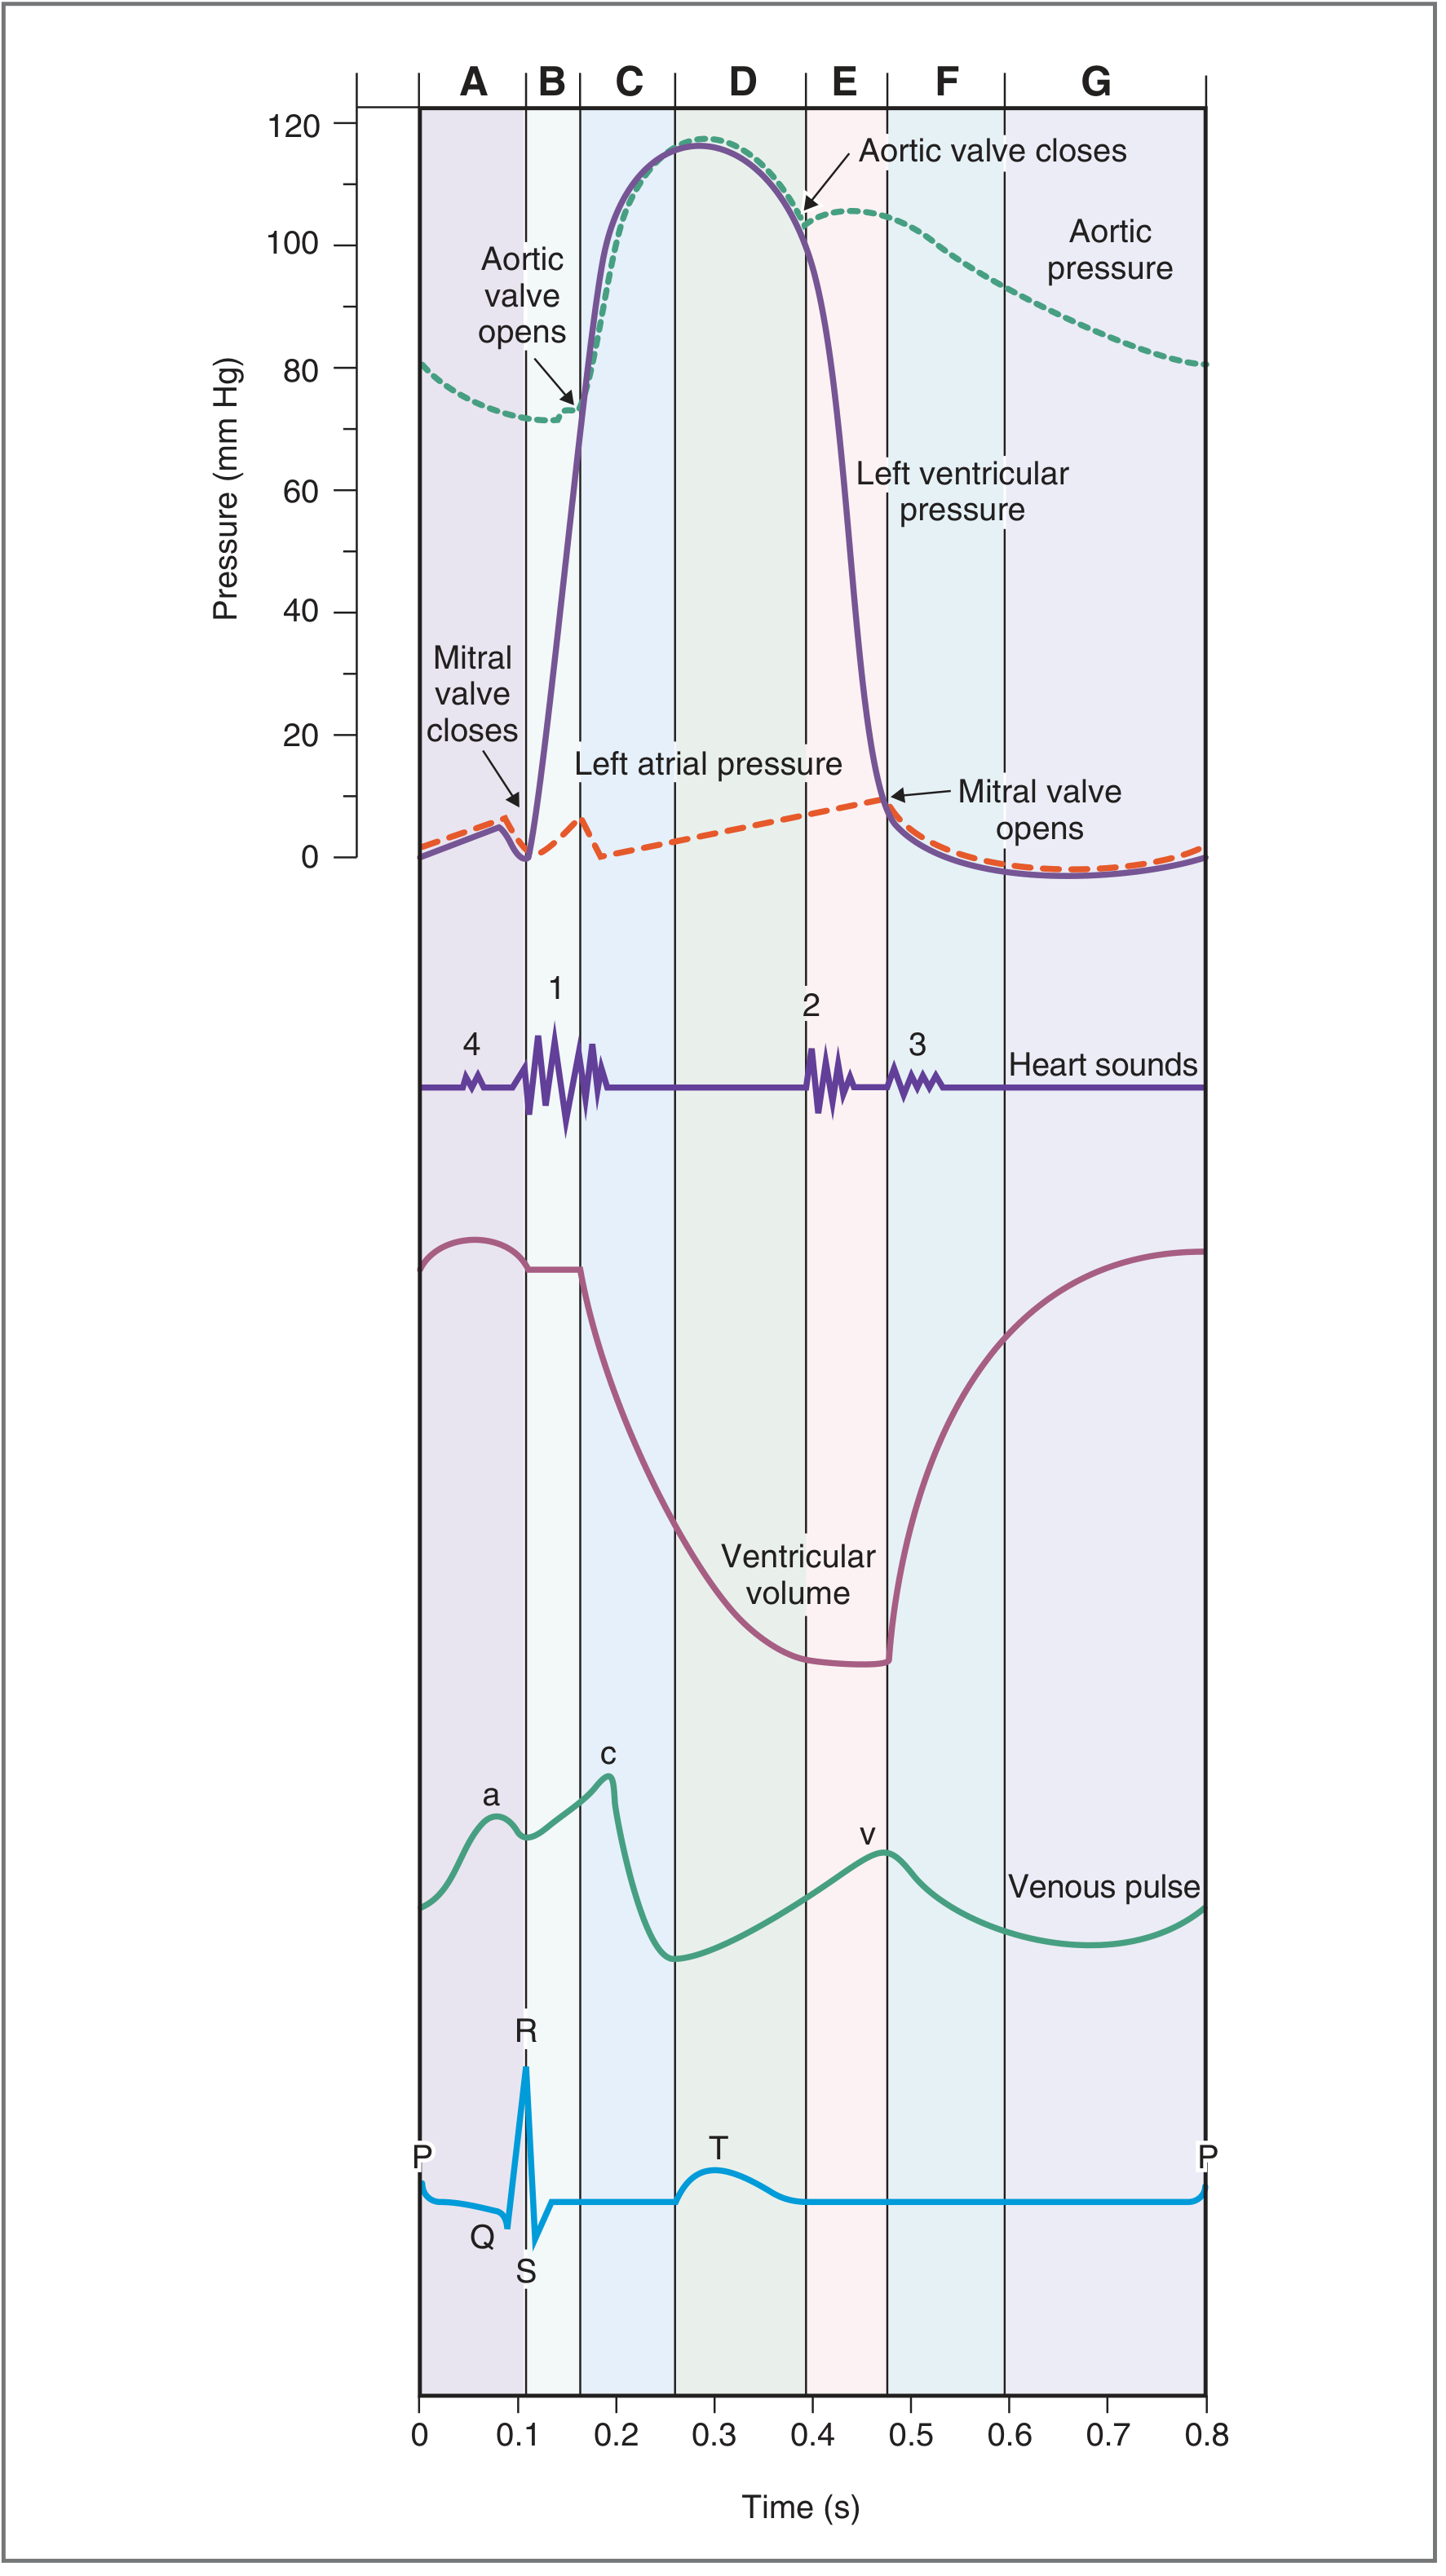
The diagram shows (top to bottom):
- Aortic pressure (dashed green): stays between ~80-120 mmHg
- Left ventricular (LV) pressure (purple): rises from near 0 to ~120 mmHg
- Left atrial (LA) pressure (orange dashed): low, ~5-15 mmHg
- Heart sounds (S1, S2, S3, S4)
- LV volume: rises during filling, falls during ejection
- Venous pulse (a, c, v waves)
- ECG (P, QRS, T)
The Seven Phases in Detail
DIASTOLE (Ventricular Relaxation and Filling)
Phase A - Atrial Systole
ECG marker: P wave (atrial depolarization)
Valve status: Mitral valve open | Aortic valve closed
The P wave triggers atrial depolarization and contraction. Left atrial pressure rises, pushing the final ~20-30% of blood volume into the already-partially filled left ventricle. This is the "atrial kick."
- LV pressure shows a small upward blip as extra volume enters
- Venous pulse shows the a wave - the back-pressure from atrial contraction reflected into the jugular veins
- S4 heart sound may be heard here in pathology (stiff ventricle); normally silent in healthy adults
- After atrial systole, the LV is at its maximum volume = End-Diastolic Volume (EDV) ≈ 130-140 mL
Phase B - Isovolumetric Ventricular Contraction
ECG marker: QRS complex (ventricular depolarization)
Valve status: ALL VALVES CLOSED
The QRS triggers ventricular depolarization. Calcium influx activates actin-myosin cross-bridge cycling and ventricular pressure rises sharply. Both the mitral and aortic valves are closed:
- Mitral valve closes when LV pressure exceeds LA pressure (~8-15 mmHg) → this produces S1 ("lub")
- The aortic valve is still closed because LV pressure hasn't yet exceeded aortic pressure (~80 mmHg diastolic)
- Volume stays constant (no blood can enter or leave) → "isovolumetric"
- This phase is brief (~50-80 ms) but represents all the energy invested before any ejection occurs
S1 is produced by vibrations in the AV valve leaflets and adjacent ventricular walls - not simply by valve leaflets slapping together. It has two components: mitral (M1) slightly before tricuspid (T1).
SYSTOLE (Ventricular Ejection)
Phase C - Rapid Ventricular Ejection
ECG marker: ST segment
Valve status: Aortic valve OPENS | Mitral valve closed
When LV pressure exceeds aortic pressure (~80 mmHg), the aortic valve opens silently. Blood rushes out into the aorta at peak velocities of ~100 cm/s and flows of ~30 L/min transiently. LV pressure climbs to its peak of ~120 mmHg at the same time as aortic pressure peaks. This is the rapid phase - most of the stroke volume is ejected here.
- LV volume falls rapidly
- Aortic pressure rises as the elastic aorta expands to accommodate the ejected blood (the Windkessel effect)
- In mid-systole, aortic pressure crosses over and exceeds LV pressure, yet forward flow continues due to the inertia of blood already in motion
Phase D - Reduced Ventricular Ejection
ECG marker: T wave (ventricular repolarization begins)
Valve status: Aortic valve still open | Mitral valve closed
The ventricle begins to relax. Ejection continues but slows. LV pressure and aortic pressure both start to fall as cardiac muscle relaxes and blood continues to run off into the arterial tree. LV volume reaches its minimum = End-Systolic Volume (ESV) ≈ 50-70 mL.
- Stroke Volume (SV) = EDV - ESV = 140 - 70 = ~70 mL
- Ejection Fraction (EF) = SV/EDV = 70/140 = ~50-65% (normal ≥ 55%)
When aortic pressure exceeds the falling LV pressure enough to produce a momentary reverse flow, the aortic valve leaflets snap shut → this creates the dicrotic notch on the aortic pressure tracing.
DIASTOLE (Relaxation - continued)
Phase E - Isovolumetric Ventricular Relaxation (IVRT)
ECG marker: After T wave - electrical silence
Valve status: ALL VALVES CLOSED again
The aortic valve closes at the dicrotic notch, producing S2 ("dub"). The mitral valve is still closed because LV pressure, though falling rapidly, has not yet fallen below LA pressure.
- LV pressure drops steeply from ~80 mmHg toward 0
- Volume stays constant (no inflow or outflow)
- IVRT (isovolumetric relaxation time) normally lasts ~70-90 ms
- S2 has two components: aortic (A2) before pulmonic (P2); the slight delay between them is called physiological splitting of S2, which widens on inspiration
The venous pulse shows the v wave during this phase - passive filling of the atrium while the mitral valve is still closed.
Phase F - Rapid Ventricular Filling
ECG marker: None (electrical silence)
Valve status: Mitral valve OPENS | Aortic valve closed
When LV pressure falls below LA pressure, the mitral valve opens. Blood rushes from the atrium (which has been filling passively throughout systole) into the relaxed ventricle driven by a pressure gradient and active ventricular suction (the LV apex "untwists" creating a negative pressure).
- LV volume rises rapidly; accounts for ~70-80% of total ventricular filling
- LV pressure remains low because the relaxed, compliant ventricle accepts volume with minimal pressure rise
- S3 heart sound - caused by rapid ventricular filling; normal in children and young adults; in adults over 40, S3 indicates volume overload (heart failure, MR, TR)
- The venous v wave descends as atrial blood empties into the ventricle (y descent)
Phase G - Reduced Ventricular Filling (Diastasis)
ECG marker: Flat period before next P wave
Valve status: Mitral valve open | Aortic valve closed
Pressures in the atrium and ventricle gradually equalize, and filling slows nearly to a standstill. This is the longest phase of the cardiac cycle at rest. LV fills slowly toward EDV.
Clinical pearl: This is the phase most affected by tachycardia. A fast heart rate shortens diastasis first; at very high heart rates, diastasis is eliminated entirely, reducing EDV, stroke volume, and cardiac output.
The cycle then restarts with Phase A (next P wave → atrial systole).
Summary Table of the Seven Phases
| Phase | Name | ECG | Mitral Valve | Aortic Valve | Key Event | Heart Sound |
|---|---|---|---|---|---|---|
| A | Atrial Systole | P wave | Open | Closed | Atrial kick; final LV filling | S4 (if present) |
| B | Isovolumetric Contraction | QRS | Closes | Closed | LV pressure rises; no ejection | S1 |
| C | Rapid Ejection | ST segment | Closed | Opens | Most SV ejected; peak LV pressure | — |
| D | Reduced Ejection | T wave | Closed | Open | Ejection slows; ESV reached | — |
| E | Isovolumetric Relaxation | Post-T | Closed | Closes | LV pressure drops; volume constant | S2 (dicrotic notch) |
| F | Rapid Filling | — | Opens | Closed | Passive LV filling; LA empties | S3 (if present) |
| G | Diastasis | Pre-P | Open | Closed | Slow filling; equilibration | — |
The Pressure-Volume (PV) Loop
The PV loop is a different way to represent the same events - LV pressure plotted against LV volume:
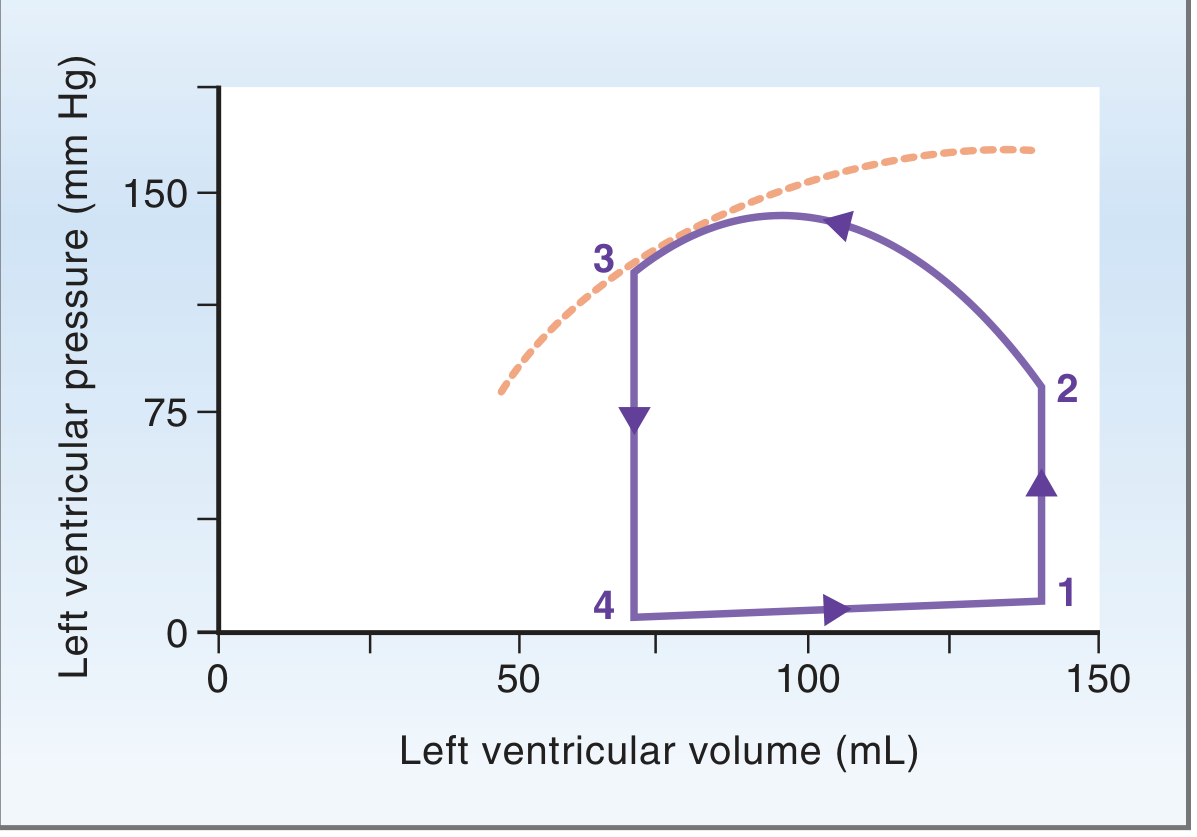
The loop traverses counterclockwise:
- Point 1 → 2 (right vertical line): Isovolumetric contraction - pressure rises, volume constant (EDV = 140 mL)
- Point 2 → 3 (top curve): Ejection - volume falls from 140 mL to 70 mL as pressure peaks
- Point 3 → 4 (left vertical line): Isovolumetric relaxation - pressure falls, volume constant (ESV = 70 mL)
- Point 4 → 1 (bottom curve): Ventricular filling - volume rises back to EDV
The width of the loop = Stroke Volume (~70 mL). The area enclosed by the loop = Stroke Work (external work done by the ventricle in one beat).
The Atrial Pressure Waves (a, c, v)
These small pressure waves are visible in the LA pressure trace and are reflected in the jugular venous pulse (JVP):
| Wave | Timing | Cause |
|---|---|---|
| a wave | Phase A | Atrial contraction (follows P wave) |
| c wave | Phase B | Mitral valve bulges back into LA during isovolumetric contraction |
| x descent | Phase C-D | Atrial relaxation + downward displacement of AV junction during ejection |
| v wave | Phase E-F | Passive atrial filling while mitral is closed |
| y descent | Phase F | Mitral valve opens; blood drains into ventricle |
The Cardiac Cycle from an Echocardiographic/Doppler Perspective
From the Textbook of Clinical Echocardiography:
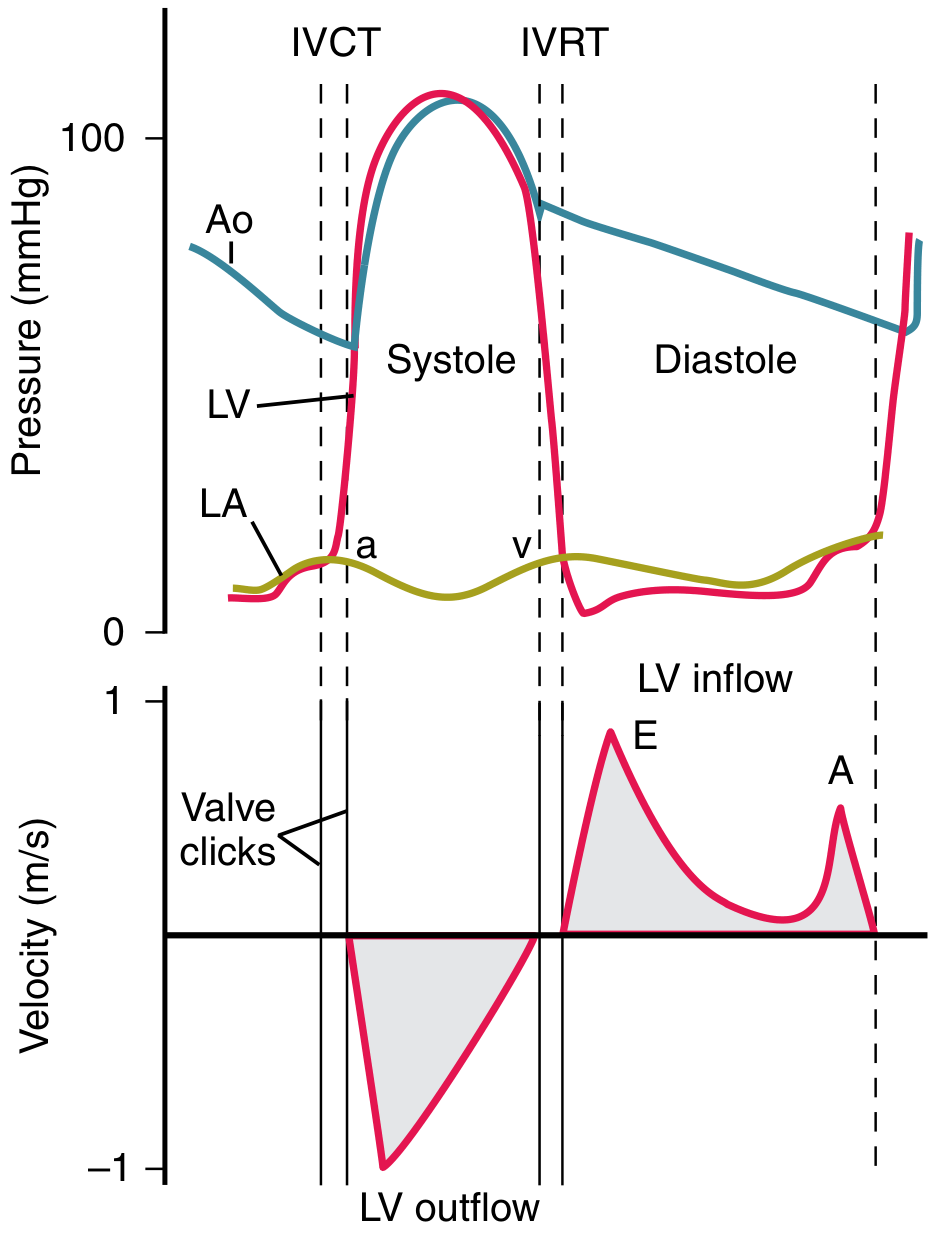
The upper panel shows LV, aortic (Ao), and LA pressures. The lower panel shows the Doppler velocity curves:
- LV outflow (downward): blood leaving LV during systole
- LV inflow (E and A waves): E wave = early passive filling (rapid filling phase); A wave = atrial kick (late diastole)
- IVCT (isovolumetric contraction time) = from mitral valve closure to aortic valve opening
- IVRT (isovolumetric relaxation time) = from aortic valve closure to mitral valve opening
The E/A ratio (normally >1 in young adults) is a key marker of diastolic function. Reversal of E/A ratio (E/A < 1) suggests impaired relaxation, seen in early diastolic dysfunction.
Key Numbers to Remember
| Parameter | Normal Value |
|---|---|
| Cycle duration (HR 75) | 800 ms |
| Systole duration | ~300 ms |
| Diastole duration | ~500 ms |
| End-diastolic volume (EDV) | 120-140 mL |
| End-systolic volume (ESV) | 50-70 mL |
| Stroke volume (SV) | ~70 mL |
| Ejection fraction (EF) | 55-65% |
| Peak LV pressure | ~120 mmHg |
| Aortic pressure (systolic/diastolic) | 120/80 mmHg |
| LA pressure | 5-15 mmHg |
| IVCT | 50-100 ms |
| IVRT | 70-90 ms |
Right Heart vs. Left Heart
The same seven phases occur in the right ventricle, but with lower pressures:
- RV peak pressure: ~25 mmHg (vs. 120 mmHg for LV)
- Pulmonary artery pressure: ~25/10 mmHg
- Because pulmonary vascular resistance is lower, the RV ejects at much lower pressure
- Pulmonic valve closes slightly after the aortic valve → this produces the physiological splitting of S2 (A2 before P2)
Clinical Correlations
| Finding | Mechanism | Clinical Condition |
|---|---|---|
| Absent a wave in JVP | No atrial contraction | Atrial fibrillation |
| Cannon a wave | Atria contracting against closed tricuspid | Complete heart block, VT |
| Prominent v wave | High atrial pressure during systole | Mitral regurgitation, TR |
| Prolonged IVRT | Impaired ventricular relaxation | Diastolic dysfunction |
| Short IVCT | Rapid pressure rise | Hyperdynamic states |
| Widened pulse pressure | High SV or low aortic compliance | AR, hyperthyroidism, aging |
| Fixed split S2 | No respiratory variation in pulmonic closure | Atrial septal defect |
| Paradoxical split S2 | A2 after P2 | LBBB, severe aortic stenosis |
Sources: Costanzo Physiology 7th Ed., pp. 156-163 | Medical Physiology (Boron & Boulpaep), pp. 745-752 | Textbook of Clinical Echocardiography, pp. 168-169 | Braunwald's Heart Disease, pp. 46-48 | Guyton & Hall Medical Physiology
This is a shared conversation. Sign in to Orris to start your own chat.