
1. ୩ଟି ଖାତା ଓ ୨ଟି ପେନ୍ର ଦାମ ମିଶି ୫୬ ଟଙ୍କା। ୫ଟି ଖାତା ଓ ୪ଟି ପେନ୍ର ଦାମ ମିଶି ୯୬ ଟଙ୍କା। ଗୋଟିଏ ପେନ୍ର ଦାମ କେତେ? 2. ୮୦ ଜଣ ଶ୍ରମିକ ଗୋଟିଏ ରାସ୍ତାକୁ ୪୫ ଦିନରେ ତିଆରି କରନ୍ତି। ୧୨୦ ଜଣ ଶ୍ରମିକ ସେହି କାମକୁ କେତେ ଦିନରେ ଶେଷ କରିବେ? 3. ୯୦ ଟଙ୍କାକୁ ୫ ଜଣ ବାଳକ ଓ ୫ ଜଣ ବାଳିକାଙ୍କ ମଧ୍ୟରେ ଏପରି ବଣ୍ଟନ କରାଗଲା ଯେ ପ୍ରତି ବାଳିକା ପ୍ରତି ବାଳକଠାରୁ ୪ ଟଙ୍କା ଅଧିକ ପାଇଲେ। ପ୍ରତ୍ୟେକ କେତେ ପାଇଲେ? 4. ୮ ଜଣ ଲୋକ ୫ ଦିନରେ ୨୦୦ଟି ଝୁଡ଼ି ବୁଣିପାରନ୍ତି। ୪ ଜଣ ଲୋକ ୧୦ ଦିନରେ କେତୋଟି ଝୁଡ଼ି ବୁଣିପାରିବେ? 5. ୪୮ ମିଟର କପଡ଼ାର ଦାମ ୭୨୦ ଟଙ୍କା ହେଲେ ୭.୫ ମିଟର କପଡ଼ାର ଦାମ କେତେ? 6. ୯୬୦ଟି ଆମ୍ବକୁ ୨୪ ଜଣ ପିଲାଙ୍କ ମଧ୍ୟରେ ସମାନ ଭାବେ ବାଣ୍ଟିଲେ ପ୍ରତ୍ୟେକ କେତୋଟି ଆମ୍ବ ପାଇବେ? 7. ୬୫୪୩୨ ସଂଖ୍ୟାରେ ଥିବା ୨ଟି ‘୪’ର ସ୍ଥାନୀୟ ମୂଲ୍ୟର ପ୍ରଭେଦ କେତେ? 8. ଗୋଟିଏ ବସ୍ତାରେ ୫୦ କିଲୋ ଚାଉଳ ଅଛି। ଏପରି ୩୬ଟି ବସ୍ତାରେ ମୋଟ କେତେ କିଲୋ ଚାଉଳ ରହିବ? 9. ୧୫ଟି କଲମର ଦାମ ୩୦୦ ଟଙ୍କା ହେଲେ ୮ଟି କଲମର ଦାମ କେତେ? 10. ୧୨ ଜଣ ଲୋକ ୧୮ ଦିନରେ ଗୋଟିଏ କାମ କରନ୍ତି। ୯ ଜଣ ଲୋକ ସେହି କାମ କେତେ ଦିନରେ କରିବେ? 11. ୪ଟି ବହି ଓ ୩ଟି ପେନ୍ସିଲ୍ର ଦାମ ମିଶି ୬୫ ଟଙ୍କା। ୬ଟି ବହି ଓ ୫ଟି ପେନ୍ସିଲ୍ର ଦାମ ମିଶି ୧୦୧ ଟଙ୍କା। ଗୋଟିଏ ପେନ୍ସିଲ୍ର ଦାମ କେତେ? 12. ୨୪୦ ଟଙ୍କାକୁ ୮ ଜଣ ପିଲାଙ୍କ ମଧ୍ୟରେ ସମାନ ଭାବରେ ବାଣ୍ଟିଲେ ପ୍ରତ୍ୟେକ କେତେ ଟଙ୍କା ପାଇବେ? 13. ୧୦ ଜଣ ଲୋକ ୮ ଦିନରେ ୩୨୦ଟି ଇଟା ତିଆରି କରନ୍ତି। ୫ ଜଣ ଲୋକ ୪ ଦିନରେ କେତୋଟି ଇଟା ତିଆରି କରିବେ? 14. ୨୫ ମିଟର ଦଉଡ଼ିର ଦାମ ୫୦୦ ଟଙ୍କା ହେଲେ ୧୮ ମିଟର ଦଉଡ଼ିର ଦାମ କେତେ ? 15. ୧୨୮୦ଟି ଲଡୁକୁ ୩୨ ଜଣ ପିଲାଙ୍କ ମଧ୍ୟରେ ସମାନ ଭାବରେ ବାଣ୍ଟିଲେ ପ୍ରତ୍ୟେକ କେତୋଟି ଲଡୁ ପାଇବେ? 16. ୮୦୮୦୮ ସଂଖ୍ୟାରେ ଥିବା ୨ଟି ‘୮’ର ସ୍ଥାନୀୟ ମୂଲ୍ୟର ପ୍ରଭେଦ କେତେ? 17. ୬ ଜଣ ଶ୍ରମିକ ୧୨ ଦିନରେ ଗୋଟିଏ କାମ କରନ୍ତି। ୧୮ ଜଣ ଶ୍ରମିକ ସେହି କାମ କେତେ ଦିନରେ କରିବେ? 18. ୪୨ ମିଟର କପଡ଼ାର ଦାମ ୮୪୦ ଟଙ୍କା ହେଲେ ୧୫ ମିଟର କପଡ଼ାର ଦାମ କେତେ? 19. ୧୫୦ ଟଙ୍କାକୁ ୬ ଜଣ ବାଳକ ଓ ୪ ଜଣ ବାଳିକାଙ୍କ ମଧ୍ୟରେ ଏପରି ବଣ୍ଟନ କରାଗଲା ଯେ ପ୍ରତି ବାଳିକା ପ୍ରତି ବାଳକଠାରୁ ୫ ଟଙ୍କା ଅଧିକ ପାଇଲେ। ପ୍ରତ୍ୟେକ କେତେ ଟଙ୍କା ପାଇଲେ? 20. ୧୪ ଜଣ ଲୋକ ୭ ଦିନରେ ୧୯୬ଟି ଚଟେଇ ବୁଣିପାରନ୍ତି। ୨୧ ଜଣ ଲୋକ ୪ ଦିନରେ କେତୋଟି ଚଟେଇ ବୁଣିପାରିବେ?
ଉତ୍ତର (Answers)
- 3x + 2y = 56 ... (i)
- 5x + 4y = 96 ... (ii)
- ପ୍ରତି ବାଳକ = 7 ଟଙ୍କା
- ପ୍ରତି ବାଳିକା = 11 ଟଙ୍କା
- 65432 → ଯୁଟି '4' ଅଛି: ୬5_4_32 ← ହଜାର ସ୍ଥାନରେ 4 = 4000; ଦଶ ସ୍ଥାନ... ଠିକ ଭାବରେ ଦେଖିଲେ:
- ଦଶ ହଜାର ସ୍ଥାନ: 6, ହଜାର: 4 (= 4000), ଶହ: 4 (= 400), ଦଶ: 3, ଏକ: 2
- ପ୍ରଭେଦ = 4000 - 400 = 3600
- 4b + 3p = 65 ... (i)
- 6b + 5p = 101 ... (ii)
- ଦଶ ହଜାର ସ୍ଥାନ: 8 = 80000
- ଶହ ସ୍ଥାନ: 8 = 800
- ଏକ ସ୍ଥାନ: 8 = 8
- ପ୍ରତି ବାଳକ = 13 ଟଙ୍କା
- ପ୍ରତି ବାଳିକା = 18 ଟଙ୍କା
ସଂକ୍ଷିପ୍ତ ଉତ୍ତର ତାଲିକା
| ପ୍ର. | ଉତ୍ତର |
|---|---|
| 1 | 4 ଟଙ୍କା |
| 2 | 30 ଦିନ |
| 3 | ବାଳକ 7, ବାଳିକା 11 ଟଙ୍କା |
| 4 | 200ଟି |
| 5 | 112.50 ଟଙ୍କା |
| 6 | 40ଟି |
| 7 | 3600 |
| 8 | 1800 କିଲୋ |
| 9 | 160 ଟଙ୍କା |
| 10 | 24 ଦିନ |
| 11 | 7 ଟଙ୍କା |
| 12 | 30 ଟଙ୍କା |
| 13 | 80ଟି |
| 14 | 360 ଟଙ୍କା |
| 15 | 40ଟି |
| 16 | 79200 |
| 17 | 4 ଦିନ |
| 18 | 300 ଟଙ୍କା |
| 19 | ବାଳକ 13, ବାଳିକା 18 ଟଙ୍କା |
| 20 | 168ଟି |
Oxygen dissociation curve long question 20mark in easy words with importanc p50e of
oxygen hemoglobin dissociation curve sigmoid P50 shift left right
Oxygen Dissociation Curve (Oxygen-Hemoglobin Dissociation Curve) — 20 Marks
Introduction
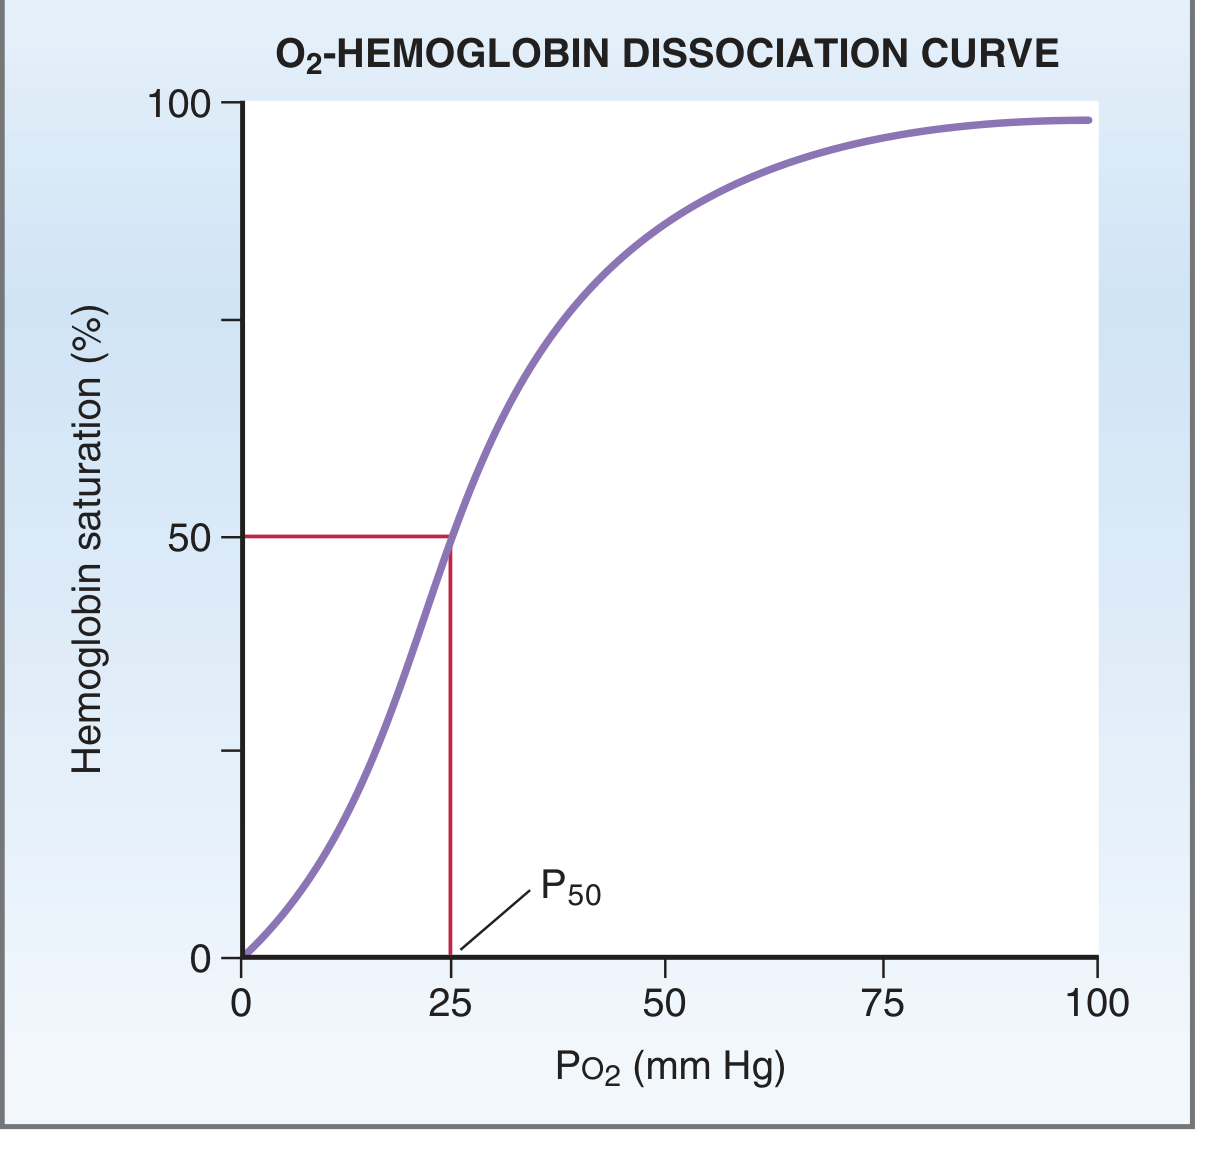
Why is it S-shaped (Sigmoid)?
- Binding of the 1st O2 molecule slightly changes the shape of hemoglobin, which increases its affinity for the 2nd O2 molecule.
- Binding of the 2nd increases affinity for the 3rd, and so on.
- The 4th O2 binds with the highest affinity.
- Steep part (10-40 mmHg): small drop in PO2 causes large release of O2 - this is what happens in tissues.
- Flat part (70-100 mmHg): hemoglobin stays almost fully saturated even if alveolar PO2 varies a lot - this gives a safety margin in the lungs (Guyton calls this the "oxygen buffer function" of blood - even if alveolar PO2 falls from 104 to 60 mmHg, saturation only drops from 97% to 89%).
Normal Values on the Curve
| PO2 (mmHg) | Saturation (%) | Site |
|---|---|---|
| 100 | 97-98 | Arterial blood (lungs) |
| 40 | 75 | Mixed venous blood (resting tissue) |
| 26 | 50 | P50 |
| 27 (fetal ~18-20) | - | - |
P50 - Definition and Importance
Why P50 is important:
-
Measures affinity of hemoglobin for oxygen - it is the simplest way to quantify whether hemoglobin is binding O2 tightly or loosely.
- Low P50 = increased affinity (hemoglobin holds onto O2 more strongly) = curve shifts LEFT.
- High P50 = decreased affinity (hemoglobin releases O2 more easily) = curve shifts RIGHT.
-
Tells us how well O2 is delivered to tissues - a rightward shift (high P50) helps unload more O2 into tissues at a given PO2; a leftward shift (low P50) helps hemoglobin pick up more O2 in the lungs but makes it hold on to O2 more tightly (less unloading at tissue level).
-
Clinical/diagnostic value - P50 helps identify conditions like abnormal hemoglobin variants, hemoglobinopathies with high or low oxygen affinity, and helps explain compensatory changes in anemia, altitude adaptation, and fetal physiology.
-
Comparing different hemoglobins - e.g., fetal hemoglobin (HbF) has a P50 of about 18-20 mmHg (lower than adult HbA's 26-27 mmHg), meaning HbF has higher affinity for O2, letting the fetus pull oxygen from the mother's blood across the placenta (Miller's Anesthesia).
Factors Shifting the Curve (Right and Left) - and their effect on P50
Shift to the RIGHT (Increase P50, Decreased affinity, easier unloading of O2 to tissues)
- Increased CO2 (Bohr effect)
- Increased H+ / decreased pH (acidosis) - Bohr Effect
- Increased 2,3-BPG (bisphosphoglycerate)
- Increased temperature
- Exercise
Shift to the LEFT (Decrease P50, Increased affinity, hemoglobin holds O2 tighter)
- Decreased CO2
- Decreased H+ / increased pH (alkalosis)
- Decreased 2,3-BPG
- Decreased temperature
- Fetal hemoglobin (HbF)
- Carbon monoxide (CO) poisoning - CO has ~200x affinity for Hb compared to O2
Bohr Effect (important sub-topic)
Physiological/Clinical Significance of the ODC (summary points for exam)
- Explains loading of O2 in lungs (flat part, high PO2) and unloading in tissues (steep part, low PO2).
- Explains the oxygen buffering function of hemoglobin - keeps tissue PO2 fairly constant despite large swings in alveolar PO2 (e.g., high altitude).
- P50 as a single quantitative marker of hemoglobin-O2 affinity, useful in comparing normal vs abnormal hemoglobins.
- Explains adaptation to high altitude (increased 2,3-BPG shifts curve right, more O2 delivery to tissues despite low atmospheric PO2).
- Explains fetal oxygen transport (HbF's leftward-shifted curve/lower P50 lets it extract O2 from maternal blood).
- Helps understand anemia and exercise physiology (increased 2,3-BPG compensates by improving O2 unloading).
- Important in CO poisoning (curve shifts left, CO2 curve also affected, causing tissue hypoxia despite normal PO2).
- Useful in ICU/anesthesia for interpreting pulse oximetry and blood gas values, and in diagnosing hemoglobinopathies with abnormal P50.
Conclusion

Ans the 20 number question
Q20. Oxygen Dissociation Curve of Hemoglobin and Myoglobin (10 Marks)
Introduction
The Two Curves
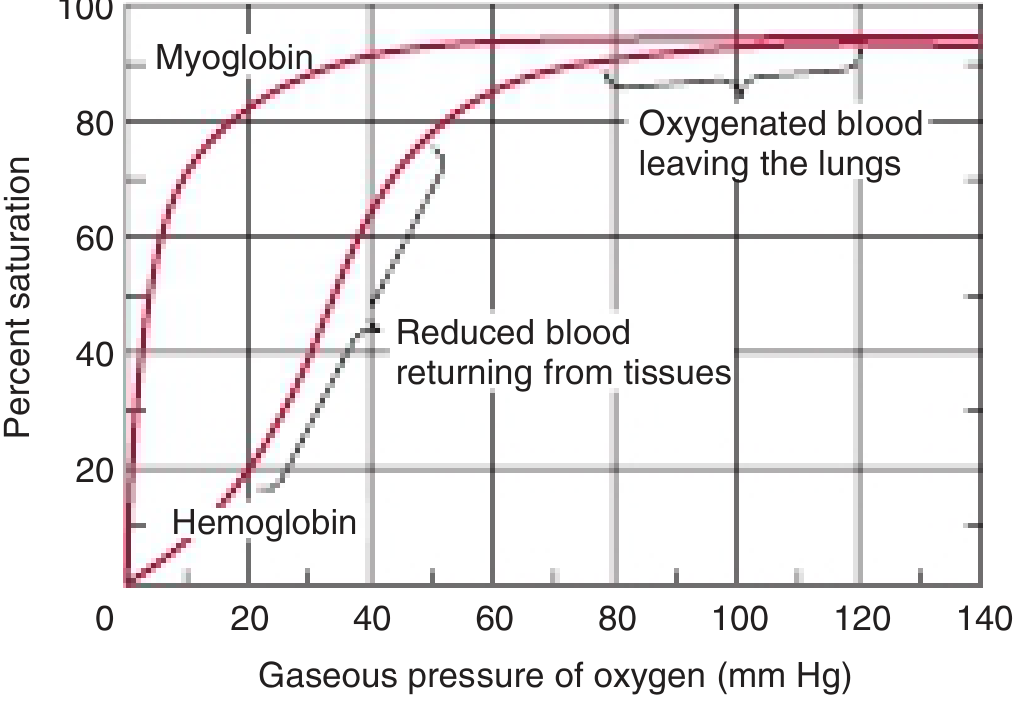
1. Myoglobin curve — Hyperbolic shape
- Myoglobin is a single polypeptide chain with one heme group, so it binds only 1 molecule of O2.
- Since there is only one binding site, there is no cooperativity between subunits.
- The relationship between PO2 and % saturation is a simple hyperbola (like any single-site protein-ligand binding).
- Myoglobin has a very high affinity for O2 even at low PO2 — it loads O2 readily at lung capillary PO2 (100 mmHg) but does not release much O2 at PO2 of active muscle (20 mmHg) or resting tissue (40 mmHg).
- Only when PO2 falls very low (~5 mmHg, as in strenuous exercise) does myoglobin release its O2 — which then supports mitochondrial ATP synthesis via cytochrome oxidase.
- This makes myoglobin an O2 storage protein, not a good O2 transporter.
2. Hemoglobin curve — Sigmoid (S-shaped)
- Hemoglobin is a tetramer (4 polypeptide chains, 4 heme groups), so it can bind 4 molecules of O2.
- Binding shows positive cooperativity: binding of the 1st O2 increases affinity for the 2nd, and so on till the 4th binds with highest affinity. This transitions Hb from a low-affinity T (taut) state to a high-affinity R (relaxed) state.
- This cooperative behavior produces the characteristic S-shaped (sigmoid) curve.
- At high PO2 (lungs, ~100 mmHg) — Hb is in R state, ~97-98% saturated, loading O2 efficiently.
- At low PO2 (tissues, ~40 mmHg and below) — Hb shifts toward T state and releases a large proportion of bound O2.
- This dynamic R ↔ T interconversion is exactly what makes hemoglobin an excellent O2 transport protein — because it can pick up large amounts of O2 in the lungs and unload a large amount in the tissues, over the physiological PO2 range.
Key Comparative Points
| Feature | Myoglobin | Hemoglobin |
|---|---|---|
| Structure | Monomer, 1 heme | Tetramer, 4 heme |
| O2 binding sites | 1 | 4 |
| Curve shape | Hyperbolic | Sigmoid |
| Cooperativity | Absent | Present (positive) |
| O2 affinity | Very high | Moderate, allosterically regulated |
| P50 | Very low (~1-3 mmHg) | ~26-27 mmHg |
| Function | O2 storage (muscle) | O2 transport (blood) |
| Effect of 2,3-BPG, CO2, H+, temp | Minimal | Significant (shifts curve) |
| Bohr effect | Absent | Present |
Physiological Significance
- Hb's sigmoid curve with cooperativity allows efficient loading in lungs (flat upper part, high PO2 tolerance) and efficient unloading in tissues (steep middle part).
- Mb's hyperbolic curve with very high affinity means it holds on to O2 tightly, acting as a reserve store, releasing O2 only when tissue PO2 drops critically low (severe exercise/hypoxia) — providing a short-term O2 supply to muscle mitochondria.
- The allosteric regulation of Hb (by 2,3-BPG, H+, CO2, temperature — Bohr effect) fine-tunes O2 delivery to match tissue metabolic demand, a property myoglobin lacks because it has no allosteric partners (single chain).
- Association of single globin chains into a tetrameric hemoglobin therefore results in much greater oxygen delivery capacity than would be possible with isolated myoglobin-like chains.