Neuroglial cells Dura matter and modifications (various folds) Arachnoid modification CSF circulation Modifications of pia matter in spinal cord External features of spinal cord Draw visual pathway Oculomotor nerve

Reading File
Finding Sources
Finding Sources
Finding Sources
Finding Sources
Finding Sources
Finding Sources
Finding Sources
Finding Sources
Reading File
Reading File
Reading File
Reading File
Finding Sources
Finding Sources
Searching Images

visual pathway optic nerve chiasm tract lateral geniculate diagram
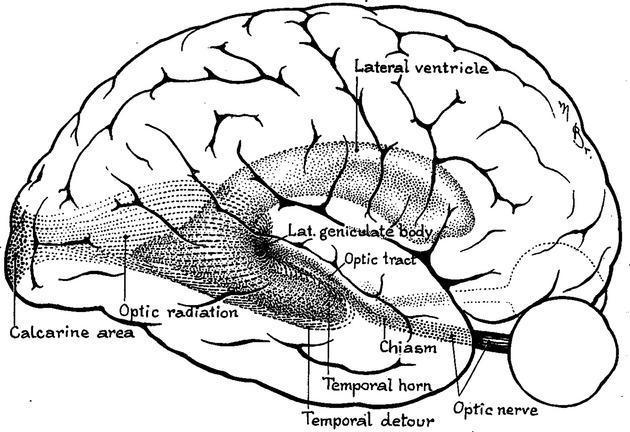
This anatomical diagram provides a lateral view of the human brain, specifically illustrating the visual pathway and the spatial distribution of the optic radiation. Based on Harvey Cushing's 1921 drawing, the illustration highlights the geniculocalcarine tract from its origin at the lateral geniculate body (LGB) to its termination in the primary visual cortex (calcarine area). A key educational focus is the 'temporal detour' or Meyer’s loop, where the ventral fibers of the optic radiation arc anteriorly around the temporal horn of the lateral ventricle before heading posteriorly toward the occipital lobe. Other labeled anatomical landmarks include the optic nerve, optic chiasm, optic tract, and the main body of the lateral ventricle. This diagram is significant for understanding neuroanatomy related to visual field deficits (e.g., quadrantanopia) that may arise from lesions or neurosurgical procedures in the temporal lobe, such as epilepsy surgery or tumor resection.
This anatomical diagram provides a lateral view of the human brain, specifically illustrating the visual pathway and the spatial distribution of the optic radiation. Based on Harvey Cushing's 1921 drawing, the illustration highlights the geniculocalcarine tract from its origin at the lateral geniculate body (LGB) to its termination in the primary visual cortex (calcarine area). A key educational focus is the 'temporal detour' or Meyer’s loop, where the ventral fibers of the optic radiation arc anteriorly around the temporal horn of the lateral ventricle before heading posteriorly toward the occipital lobe. Other labeled anatomical landmarks include the optic nerve, optic chiasm, optic tract, and the main body of the lateral ventricle. This diagram is significant for understanding neuroanatomy related to visual field deficits (e.g., quadrantanopia) that may arise from lesions or neurosurgical procedures in the temporal lobe, such as epilepsy surgery or tumor resection.

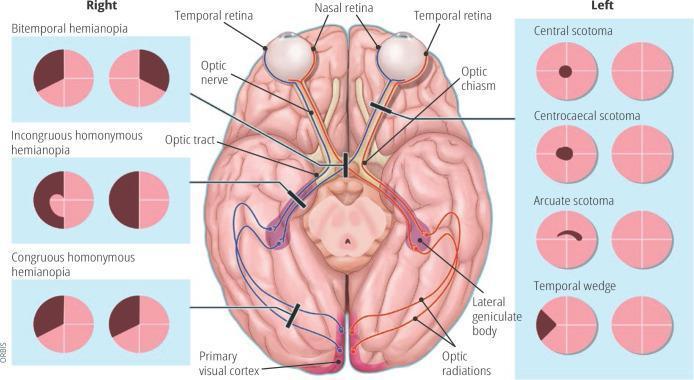
Anatomical diagram and educational infographic detailing the human visual pathway and associated visual field defects. The central illustration shows a superior (dorsal) view of the brain, highlighting the optic nerve, optic chiasm (decussation point), optic tract, lateral geniculate body, optic radiations, and the primary visual cortex in the occipital lobes. Pathways are color-coded (red and blue) to demonstrate the transition from nasal and temporal retinal fibers to the contralateral and ipsilateral hemispheres. Black lesion bars indicate specific sites of damage along this pathway. Flanking the central diagram are clinical representations of visual field loss patterns. The 'Right' panel displays bilateral defects including bitemporal hemianopia, incongruous homonymous hemianopia, and congruous homonymous hemianopia. The 'Left' panel displays unilateral or localized defects including central scotoma, centrocaecal scotoma, arcuate scotoma, and temporal wedge. This diagram serves as a neuro-ophthalmological guide for localizing lesions within the central nervous system based on perimetry findings.
Anatomical diagram and educational infographic detailing the human visual pathway and associated visual field defects. The central illustration shows a superior (dorsal) view of the brain, highlighting the optic nerve, optic chiasm (decussation point), optic tract, lateral geniculate body, optic radiations, and the primary visual cortex in the occipital lobes. Pathways are color-coded (red and blue) to demonstrate the transition from nasal and temporal retinal fibers to the contralateral and ipsilateral hemispheres. Black lesion bars indicate specific sites of damage along this pathway. Flanking the central diagram are clinical representations of visual field loss patterns. The 'Right' panel displays bilateral defects including bitemporal hemianopia, incongruous homonymous hemianopia, and congruous homonymous hemianopia. The 'Left' panel displays unilateral or localized defects including central scotoma, centrocaecal scotoma, arcuate scotoma, and temporal wedge. This diagram serves as a neuro-ophthalmological guide for localizing lesions within the central nervous system based on perimetry findings.

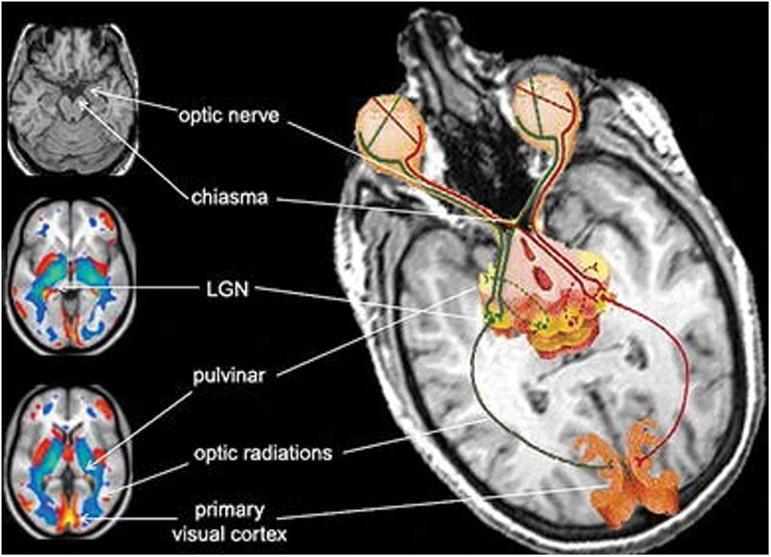
This composite diagnostic and pathophysiology diagram illustrates the anatomical structures and neuroplastic changes of the human visual pathway, specifically focusing on atrophy in congenitally blind individuals. The primary image is a transversal T1-weighted MRI slice with a superimposed schematic of the visual system. Key structures are labeled: the optic nerves originating from the globes, the optic chiasm, the lateral geniculate nucleus (LGN) and pulvinar of the thalamus, the optic radiations (geniculocalcarine tract), and the primary visual cortex in the occipital lobe. Three smaller axial brain scans on the left provide additional context. The top scan is a structural MRI identifying the optic nerve and chiasm. The middle and bottom scans are color-coded statistical parametric maps (likely VBM or PET) showing regional brain volume differences. Blue shading indicates areas of significant gray matter volume reduction (atrophy) in the thalamic relays and visual cortex, while red/yellow highlights show areas of metabolic or structural divergence. This visual is designed for advanced medical education regarding neuroanatomy and the effects of long-term sensory deprivation on the central nervous system.

This composite diagnostic and pathophysiology diagram illustrates the anatomical structures and neuroplastic changes of the human visual pathway, specifically focusing on atrophy in congenitally blind individuals. The primary image is a transversal T1-weighted MRI slice with a superimposed schematic of the visual system. Key structures are labeled: the optic nerves originating from the globes, the optic chiasm, the lateral geniculate nucleus (LGN) and pulvinar of the thalamus, the optic radiations (geniculocalcarine tract), and the primary visual cortex in the occipital lobe. Three smaller axial brain scans on the left provide additional context. The top scan is a structural MRI identifying the optic nerve and chiasm. The middle and bottom scans are color-coded statistical parametric maps (likely VBM or PET) showing regional brain volume differences. Blue shading indicates areas of significant gray matter volume reduction (atrophy) in the thalamic relays and visual cortex, while red/yellow highlights show areas of metabolic or structural divergence. This visual is designed for advanced medical education regarding neuroanatomy and the effects of long-term sensory deprivation on the central nervous system.

Searching Images

oculomotor nerve CN3 anatomy

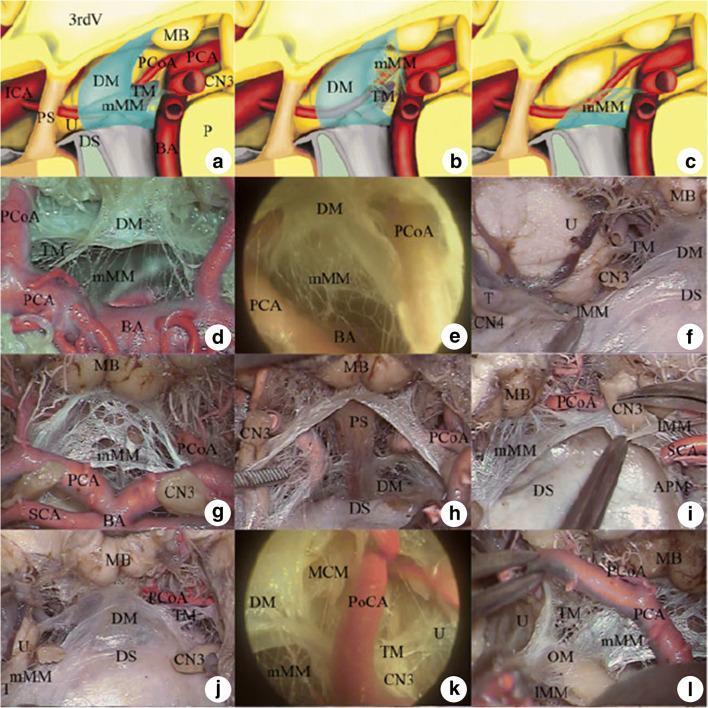
Educational composite image consisting of schematic drawings, anatomical dissections, and endoscopic views illustrating the complex microanatomy of Liliequist's membrane. Panels (a-c) present Zhang's classification: Type I (oblique Y-shaped/inverted L-shaped) and Type II configurations. Panels (d-i) demonstrate surgical anatomy of Type I membranes, highlighting the diencephalic (DM) and medial mesencephalic (mMM) leaflets. Key neurovascular relationships are visible, including the proximity of the membrane to the basilar artery (BA), oculomotor nerve (CN3), mamillary bodies (MB), and the posterior cerebral (PCA) and posterior communicating (PCoA) arteries. High-resolution dissections (j-l) specifically detail the temporal membrane (TM) and its origin from the lateral border of the diencephalic leaflet. The images emphasize the membrane’s role as an arachnoid barrier between the interpeduncular and prepontine cisterns, providing critical anatomical landmarks for neurosurgical procedures such as third ventriculostomy and skull base approaches.
Educational composite image consisting of schematic drawings, anatomical dissections, and endoscopic views illustrating the complex microanatomy of Liliequist's membrane. Panels (a-c) present Zhang's classification: Type I (oblique Y-shaped/inverted L-shaped) and Type II configurations. Panels (d-i) demonstrate surgical anatomy of Type I membranes, highlighting the diencephalic (DM) and medial mesencephalic (mMM) leaflets. Key neurovascular relationships are visible, including the proximity of the membrane to the basilar artery (BA), oculomotor nerve (CN3), mamillary bodies (MB), and the posterior cerebral (PCA) and posterior communicating (PCoA) arteries. High-resolution dissections (j-l) specifically detail the temporal membrane (TM) and its origin from the lateral border of the diencephalic leaflet. The images emphasize the membrane’s role as an arachnoid barrier between the interpeduncular and prepontine cisterns, providing critical anatomical landmarks for neurosurgical procedures such as third ventriculostomy and skull base approaches.

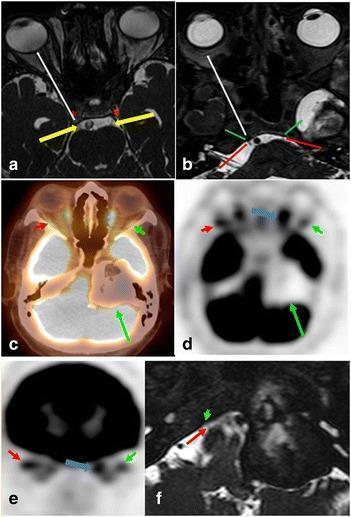
This composite of diagnostic images illustrates the neuroanatomy of the oculomotor (CN III) and abducens (CN VI) nerves and their clinical involvement in pathology. Panels (a) and (b) utilize axial FIESTA MRI to demonstrate normal anatomy: yellow arrows track CN III from its cisternal segment into the cavernous sinus (asterisk), while red arrows show CN VI entering Dorello’s canal (green arrow). The white arrows indicate their anterior trajectory toward the superior orbital fissure. Panels (c) through (e) present axial and coronal fused FDG PET/CT and PET-only images of a 73-year-old male with diplopia. A large, peripherally ossified, hypometabolic mass is visible in the left petrous apex and cerebellopontine angle (long green arrow). Functional denervation is demonstrated by reduced FDG uptake in the left lateral rectus muscle (short green arrow) compared to the normal right side (red arrow), with compensatory hypermetabolism in the left medial rectus muscle. High-resolution MRI (f) confirms the mass involves the expected anatomical course of the left abducens nerve, contrasting with the visible normal right nerve.

This composite of diagnostic images illustrates the neuroanatomy of the oculomotor (CN III) and abducens (CN VI) nerves and their clinical involvement in pathology. Panels (a) and (b) utilize axial FIESTA MRI to demonstrate normal anatomy: yellow arrows track CN III from its cisternal segment into the cavernous sinus (asterisk), while red arrows show CN VI entering Dorello’s canal (green arrow). The white arrows indicate their anterior trajectory toward the superior orbital fissure. Panels (c) through (e) present axial and coronal fused FDG PET/CT and PET-only images of a 73-year-old male with diplopia. A large, peripherally ossified, hypometabolic mass is visible in the left petrous apex and cerebellopontine angle (long green arrow). Functional denervation is demonstrated by reduced FDG uptake in the left lateral rectus muscle (short green arrow) compared to the normal right side (red arrow), with compensatory hypermetabolism in the left medial rectus muscle. High-resolution MRI (f) confirms the mass involves the expected anatomical course of the left abducens nerve, contrasting with the visible normal right nerve.

Searching Images

neuroglial cells types astrocyte oligodendrocyte microglia
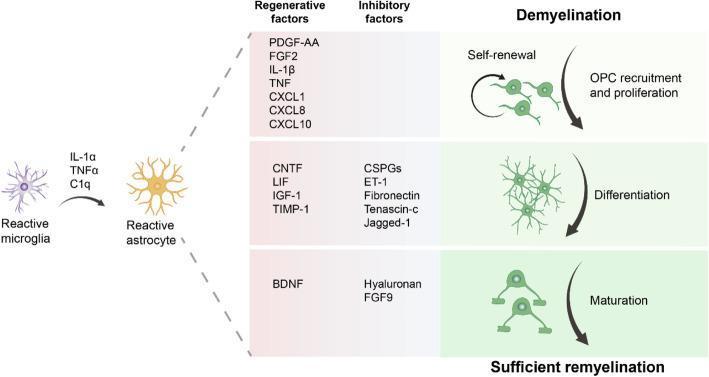
A medical pathophysiology diagram illustrating the role of reactive astrocytes in Central Nervous System (CNS) remyelination following demyelinating insults. The process begins on the left with reactive microglia (purple) inducing the formation of reactive astrocytes (yellow) via the secretion of cytokines IL-1̑, TNF̑, and C1q. The central portion of the diagram details how these reactive astrocytes influence oligodendrocyte precursor cell (OPC) development through two categories of secreted molecules: regenerative and inhibitory factors. The diagram is divided into three horizontal stages corresponding to OPC progression: 1) Recruitment and proliferation (facilitated by PDGF-AA, FGF2, and various interleukins/chemokines), 2) Differentiation (regulated by CNTF, IGF-1, and CSPGs), and 3) Maturation into myelin-forming cells (influenced by BDNF, hyaluronan, and FGF9). The right-hand column visually depicts the morphological evolution of OPCs from simple proliferative cells to mature, branching oligodendrocytes capable of sufficient remyelination, emphasizing the astrocyte's dual role in promoting or hindering neural repair.
A medical pathophysiology diagram illustrating the role of reactive astrocytes in Central Nervous System (CNS) remyelination following demyelinating insults. The process begins on the left with reactive microglia (purple) inducing the formation of reactive astrocytes (yellow) via the secretion of cytokines IL-1̑, TNF̑, and C1q. The central portion of the diagram details how these reactive astrocytes influence oligodendrocyte precursor cell (OPC) development through two categories of secreted molecules: regenerative and inhibitory factors. The diagram is divided into three horizontal stages corresponding to OPC progression: 1) Recruitment and proliferation (facilitated by PDGF-AA, FGF2, and various interleukins/chemokines), 2) Differentiation (regulated by CNTF, IGF-1, and CSPGs), and 3) Maturation into myelin-forming cells (influenced by BDNF, hyaluronan, and FGF9). The right-hand column visually depicts the morphological evolution of OPCs from simple proliferative cells to mature, branching oligodendrocytes capable of sufficient remyelination, emphasizing the astrocyte's dual role in promoting or hindering neural repair.

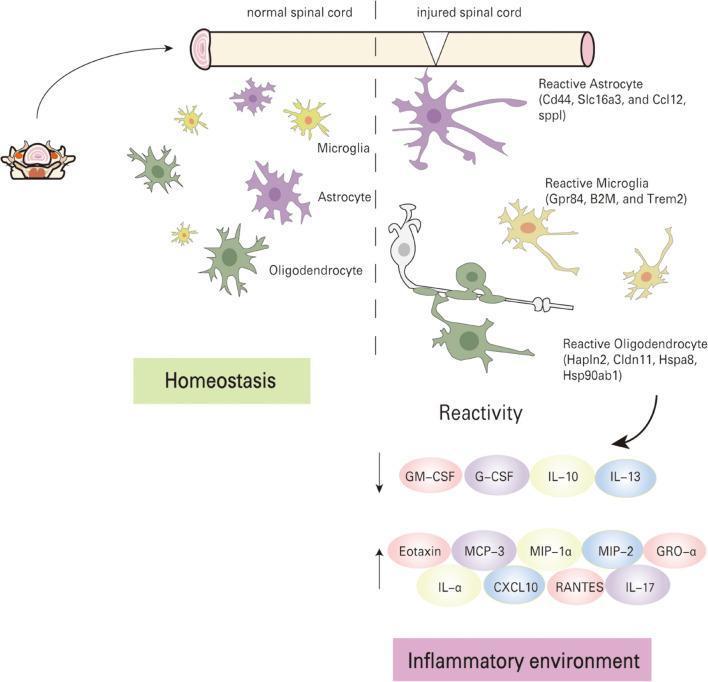
This pathophysiology diagram summarizes the molecular and cellular changes following spinal cord injury (SCI). The illustration is divided into two sections: 'normal spinal cord' (Homeostasis) and 'injured spinal cord' (Reactivity). In the normal state, microglia, astrocytes, and oligodendrocytes are shown with small, branched morphologies. In the injured state, these cells transition into activated forms: 'Reactive Astrocyte' (marked by Cd44, Slc16a3, Ccl12), 'Reactive Microglia' (Gpr84, B2M, Trem2), and 'Reactive Oligodendrocyte' (Hapln2, Cldn11, Hspa8, Hsp90ab1), characterized by enlarged bodies and irregular processes. The lower portion details the dysregulated inflammatory environment. Factors promoting recovery (GM-CSF, G-CSF, IL-10, IL-13) are shown with downward arrows, indicating downregulation. Factors hindering repair (Eotaxin, MCP-3, MIP-1α, MIP-2, GRO-α, IL-α, CXCL10, RANTES, IL-17) are shown with upward arrows, indicating upregulation. The diagram effectively illustrates the cellular activation and cytokine imbalance that characterize the acute inflammatory phase of SCI, providing educational context for secondary injury mechanisms.

This pathophysiology diagram summarizes the molecular and cellular changes following spinal cord injury (SCI). The illustration is divided into two sections: 'normal spinal cord' (Homeostasis) and 'injured spinal cord' (Reactivity). In the normal state, microglia, astrocytes, and oligodendrocytes are shown with small, branched morphologies. In the injured state, these cells transition into activated forms: 'Reactive Astrocyte' (marked by Cd44, Slc16a3, Ccl12), 'Reactive Microglia' (Gpr84, B2M, Trem2), and 'Reactive Oligodendrocyte' (Hapln2, Cldn11, Hspa8, Hsp90ab1), characterized by enlarged bodies and irregular processes. The lower portion details the dysregulated inflammatory environment. Factors promoting recovery (GM-CSF, G-CSF, IL-10, IL-13) are shown with downward arrows, indicating downregulation. Factors hindering repair (Eotaxin, MCP-3, MIP-1α, MIP-2, GRO-α, IL-α, CXCL10, RANTES, IL-17) are shown with upward arrows, indicating upregulation. The diagram effectively illustrates the cellular activation and cytokine imbalance that characterize the acute inflammatory phase of SCI, providing educational context for secondary injury mechanisms.

Searching Images

spinal cord external features gross anatomy
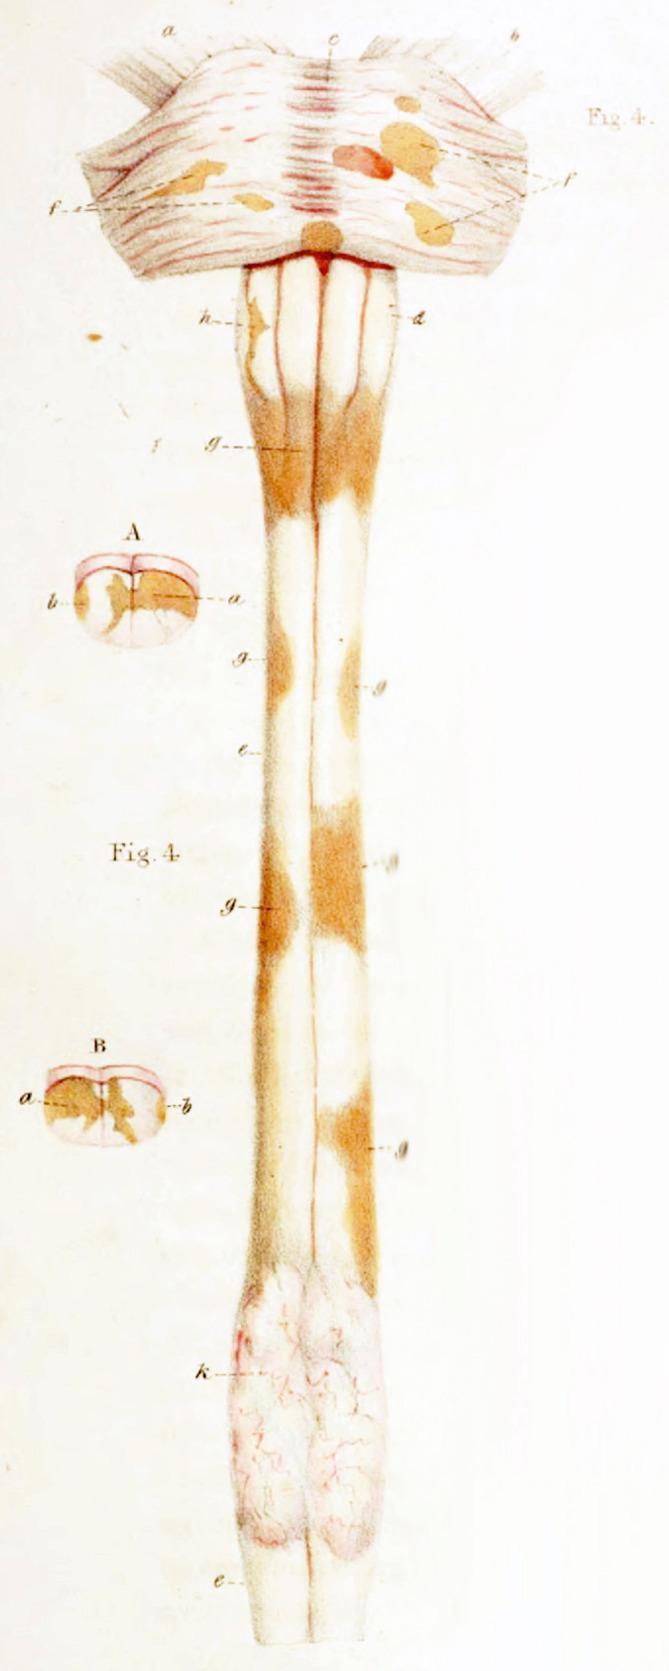
This historical medical illustration by Sir Robert Carswell depicts pathological gross specimens of the human spinal cord and brainstem, demonstrating spinal sclerotic lesions associated with Multiple Sclerosis (MS). The primary image shows a posterior view of the spinal cord, from the medulla oblongata to the conus medullaris. Key features include multifocal, irregular patches of brownish-tan discoloration (labeled 'g') representing demyelinated plaques, which contrast with the surrounding white, healthy-appearing tissue. The brainstem region displays similar sclerotic markings and vascular congestion. Two transverse cross-sections, labeled 'A' and 'B', illustrate the deep extension of these lesions into the spinal parenchyma, involving both white and gray matter tracts. The distal spinal cord shows a more vascularized, slightly bulbous appearance with visible surface microvasculature. This illustration is a seminal anatomical-pathological record of neuro-inflammatory disease progression, highlighting the morphology and distribution of demyelinating lesions in the central nervous system.
This historical medical illustration by Sir Robert Carswell depicts pathological gross specimens of the human spinal cord and brainstem, demonstrating spinal sclerotic lesions associated with Multiple Sclerosis (MS). The primary image shows a posterior view of the spinal cord, from the medulla oblongata to the conus medullaris. Key features include multifocal, irregular patches of brownish-tan discoloration (labeled 'g') representing demyelinated plaques, which contrast with the surrounding white, healthy-appearing tissue. The brainstem region displays similar sclerotic markings and vascular congestion. Two transverse cross-sections, labeled 'A' and 'B', illustrate the deep extension of these lesions into the spinal parenchyma, involving both white and gray matter tracts. The distal spinal cord shows a more vascularized, slightly bulbous appearance with visible surface microvasculature. This illustration is a seminal anatomical-pathological record of neuro-inflammatory disease progression, highlighting the morphology and distribution of demyelinating lesions in the central nervous system.

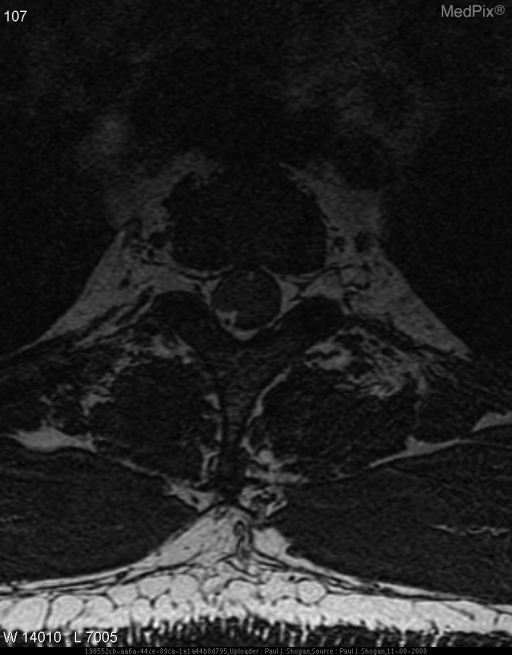
**Imaging Modality:** Magnetic Resonance Imaging (MRI), axial T1-weighted sequence.

**Anatomical Region:** Thoracic spine at the level of the vertebral body and neural canal.

**Observed Pathology:** There is a well-circumscribed, lobulated mass located within the spinal canal. The lesion is situated in the intradural extramedullary space. It demonstrates heterogeneous signal intensity, primarily isointense to the spinal cord, with focal areas of hyperintensity.

**Characteristic Visual Features:** The mass occupies a significant portion of the spinal canal, causing secondary compression and displacement of the spinal cord (the "cord flattening" sign). The lesion appears to be closely associated with the nerve roots or the meningeal lining. There is no evidence of gross vertebral body destruction or paravertebral extension in this specific slice. 

**Key Diagnostic Features:** The location within the thecal sac but external to the cord parenchyma is characteristic of intradural extramedullary neoplasms such as schwannoma, meningioma, or neurofibroma. The preservation of the epidural fat plane and the displacement of the subarachnoid CSF space are key indicators of the intradural compartment origin.

**Imaging Modality:** Magnetic Resonance Imaging (MRI), axial T1-weighted sequence. **Anatomical Region:** Thoracic spine at the level of the vertebral body and neural canal. **Observed Pathology:** There is a well-circumscribed, lobulated mass located within the spinal canal. The lesion is situated in the intradural extramedullary space. It demonstrates heterogeneous signal intensity, primarily isointense to the spinal cord, with focal areas of hyperintensity. **Characteristic Visual Features:** The mass occupies a significant portion of the spinal canal, causing secondary compression and displacement of the spinal cord (the "cord flattening" sign). The lesion appears to be closely associated with the nerve roots or the meningeal lining. There is no evidence of gross vertebral body destruction or paravertebral extension in this specific slice. **Key Diagnostic Features:** The location within the thecal sac but external to the cord parenchyma is characteristic of intradural extramedullary neoplasms such as schwannoma, meningioma, or neurofibroma. The preservation of the epidural fat plane and the displacement of the subarachnoid CSF space are key indicators of the intradural compartment origin.

Reading File
Reading File
Loading Image
Loading Image
Searching Images

dura mater falx cerebri tentorium cerebelli dural folds diagram
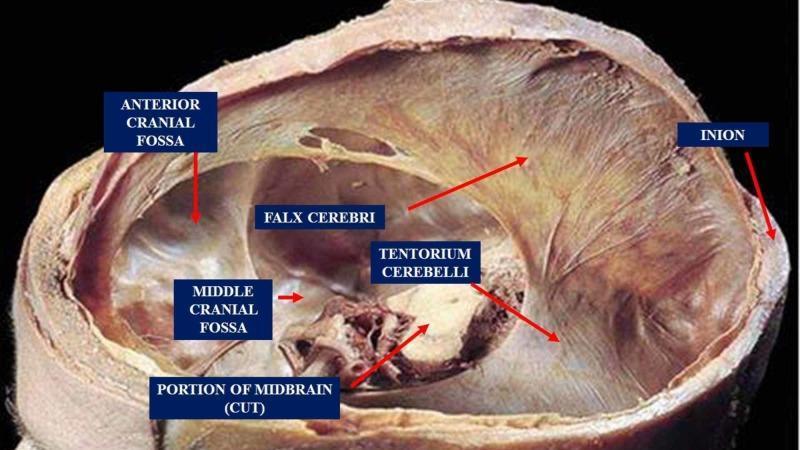
This clinical anatomical photograph displays a superior view of the internal cranial base and dural folds within a human cadaveric specimen. The image highlights the compartmentalization of the cranial cavity by the dura mater. Key structures identified include the falx cerebri, a vertical dural fold separating the cerebral hemispheres, and the tentorium cerebelli, a horizontal, semi-circular transverse septum that divides the occipital lobes from the cerebellum. The anatomical landmarks of the skull base are visible, specifically the anterior cranial fossa and the middle cranial fossa. A cross-section of the midbrain is shown passing through the tentorial notch. The posterior attachment point at the internal occipital protuberance, or inion, is also labeled. This visual serves as an educational tool for neuroanatomy and neurosurgery, illustrating the relationship between the dural membranes, the brainstem, and the bony fossae of the skull.
This clinical anatomical photograph displays a superior view of the internal cranial base and dural folds within a human cadaveric specimen. The image highlights the compartmentalization of the cranial cavity by the dura mater. Key structures identified include the falx cerebri, a vertical dural fold separating the cerebral hemispheres, and the tentorium cerebelli, a horizontal, semi-circular transverse septum that divides the occipital lobes from the cerebellum. The anatomical landmarks of the skull base are visible, specifically the anterior cranial fossa and the middle cranial fossa. A cross-section of the midbrain is shown passing through the tentorial notch. The posterior attachment point at the internal occipital protuberance, or inion, is also labeled. This visual serves as an educational tool for neuroanatomy and neurosurgery, illustrating the relationship between the dural membranes, the brainstem, and the bony fossae of the skull.

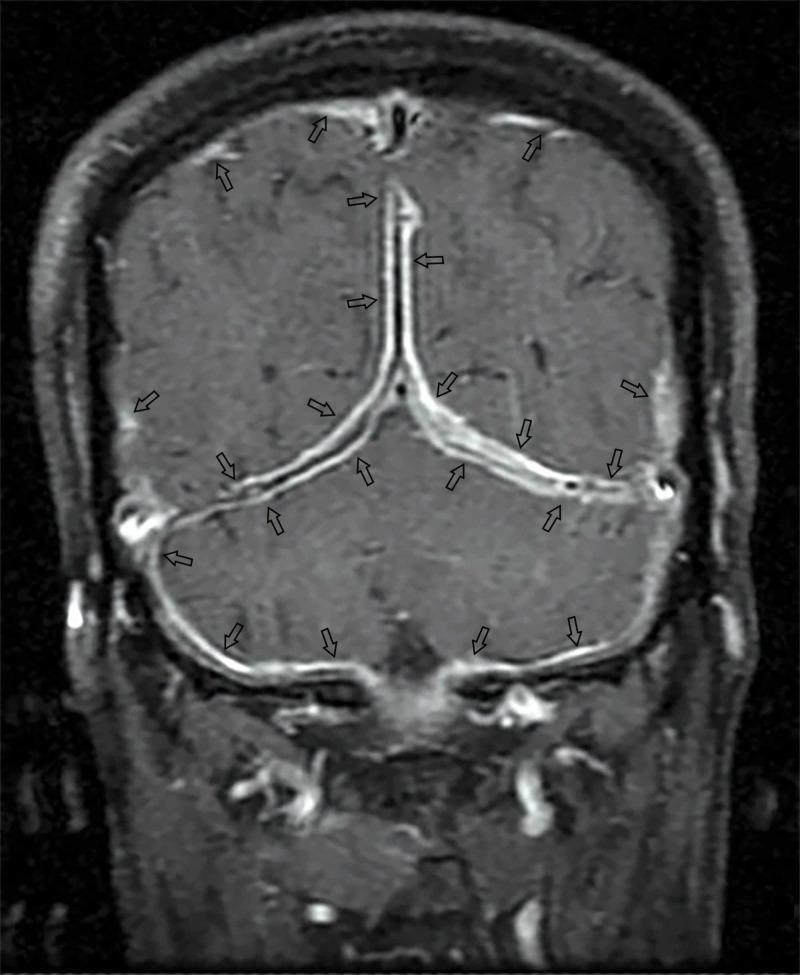
This diagnostic image is a post-gadolinium coronal T1-weighted MRI of the brain, demonstrating diffuse pachymeningeal enhancement. The visual findings show prominent, thick, linear enhancement along the dura mater, specifically involving the falx cerebri, the tentorium cerebelli, and the inner table of the skull in the posterior fossa. Multiple black arrows highlight these areas of high signal intensity, which follow the curvilinear contours of the dural folds. The enhancement is consistent with dural thickening, characteristic of conditions such as hypertrophic pachymeningitis, which in this clinical context was secondary to tuberculosis. The image serves as an educational example of how contrast-enhanced MRI identifies meningeal pathology by highlighting the uniform and diffuse distribution of contrast uptake within the dura mater rather than the deeper leptomeningeal spaces.

This diagnostic image is a post-gadolinium coronal T1-weighted MRI of the brain, demonstrating diffuse pachymeningeal enhancement. The visual findings show prominent, thick, linear enhancement along the dura mater, specifically involving the falx cerebri, the tentorium cerebelli, and the inner table of the skull in the posterior fossa. Multiple black arrows highlight these areas of high signal intensity, which follow the curvilinear contours of the dural folds. The enhancement is consistent with dural thickening, characteristic of conditions such as hypertrophic pachymeningitis, which in this clinical context was secondary to tuberculosis. The image serves as an educational example of how contrast-enhanced MRI identifies meningeal pathology by highlighting the uniform and diffuse distribution of contrast uptake within the dura mater rather than the deeper leptomeningeal spaces.

Searching Images

CSF cerebrospinal fluid circulation ventricles choroid plexus arachnoid granulations
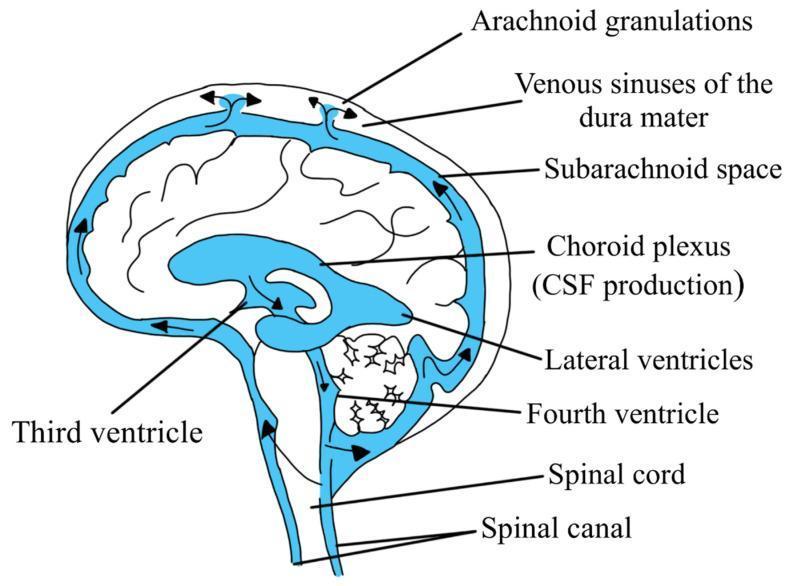
An anatomical diagram illustrating the production and circulation pathway of cerebrospinal fluid (CSF) in the human brain. The illustration depicts a sagittal view of the central nervous system with blue-shaded regions representing the CSF spaces. Production is identified at the choroid plexus within the lateral ventricles. Arrows demonstrate the flow through the ventricular system, including the third ventricle and fourth ventricle. The pathway continues as CSF exits into the subarachnoid space surrounding the brain and spinal cord, and into the spinal canal. Reabsorption is shown at the superior aspect via arachnoid granulations into the venous sinuses of the dura mater. Labeled structures include the lateral and third ventricles, fourth ventricle, subarachnoid space, spinal cord, spinal canal, and the dural venous sinuses. This educational material serves as a visual guide for neuroanatomy and physiological fluid dynamics.
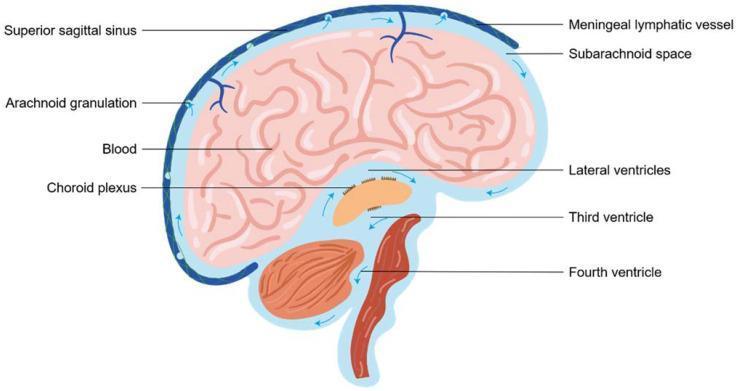
An anatomical diagram illustrating the production and circulation pathway of cerebrospinal fluid (CSF) in the human brain. The illustration depicts a sagittal view of the central nervous system with blue-shaded regions representing the CSF spaces. Production is identified at the choroid plexus within the lateral ventricles. Arrows demonstrate the flow through the ventricular system, including the third ventricle and fourth ventricle. The pathway continues as CSF exits into the subarachnoid space surrounding the brain and spinal cord, and into the spinal canal. Reabsorption is shown at the superior aspect via arachnoid granulations into the venous sinuses of the dura mater. Labeled structures include the lateral and third ventricles, fourth ventricle, subarachnoid space, spinal cord, spinal canal, and the dural venous sinuses. This educational material serves as a visual guide for neuroanatomy and physiological fluid dynamics.

This medical anatomical diagram illustrates the production, circulation, and drainage pathways of cerebrospinal fluid (CSF) in the human brain via a sagittal section view. The illustration highlights the CSF flow starting from the choroid plexus within the lateral, third, and fourth ventricles. Blue arrows indicate the directional movement of fluid into the subarachnoid space (SAS) surrounding the cerebral cortex and cerebellum. Key drainage mechanisms are depicted: the traditional venous pathway where arachnoid granulations protrude into the superior sagittal sinus (containing blood), and the emerging lymphatic pathway via meningeal lymphatic vessels. The diagram provides a comprehensive overview of neuroanatomy and physiology related to intracranial pressure regulation and metabolite clearance, suitable for neuroscience and clinical neurology education.

This medical anatomical diagram illustrates the production, circulation, and drainage pathways of cerebrospinal fluid (CSF) in the human brain via a sagittal section view. The illustration highlights the CSF flow starting from the choroid plexus within the lateral, third, and fourth ventricles. Blue arrows indicate the directional movement of fluid into the subarachnoid space (SAS) surrounding the cerebral cortex and cerebellum. Key drainage mechanisms are depicted: the traditional venous pathway where arachnoid granulations protrude into the superior sagittal sinus (containing blood), and the emerging lymphatic pathway via meningeal lymphatic vessels. The diagram provides a comprehensive overview of neuroanatomy and physiology related to intracranial pressure regulation and metabolite clearance, suitable for neuroscience and clinical neurology education.

Searching Images

spinal cord denticulate ligament filum terminale pia mater
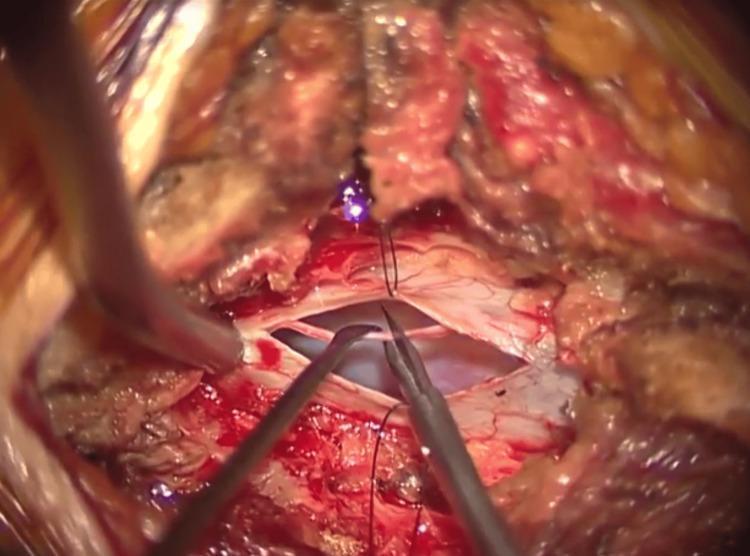
This intraoperative clinical photograph captures a microsurgical procedure for tethered cord syndrome, specifically the untethering of the filum terminale at the L5/S1 vertebral level. The surgical field demonstrates a longitudinal durotomy, with the edges of the incision retracted by stay sutures to expose the underlying neural elements. The filum terminale, appearing as a thin, whitish-grey fibrous band, is being meticulously isolated and manipulated using specialized microsurgical instruments, including a nerve hook and microscissors. The surrounding dura mater is visible as a translucent white membrane with fine vasculature, while the deeper surgical bed shows the dark void of the spinal canal. Hemorrhagic staining and soft tissue dissection planes are evident at the margins of the incision. This image illustrates the critical step of identifying and sectioning the filum terminale to relieve tension on the spinal cord, a key procedure in neurosurgery and orthopedic spine surgery.
This intraoperative clinical photograph captures a microsurgical procedure for tethered cord syndrome, specifically the untethering of the filum terminale at the L5/S1 vertebral level. The surgical field demonstrates a longitudinal durotomy, with the edges of the incision retracted by stay sutures to expose the underlying neural elements. The filum terminale, appearing as a thin, whitish-grey fibrous band, is being meticulously isolated and manipulated using specialized microsurgical instruments, including a nerve hook and microscissors. The surrounding dura mater is visible as a translucent white membrane with fine vasculature, while the deeper surgical bed shows the dark void of the spinal canal. Hemorrhagic staining and soft tissue dissection planes are evident at the margins of the incision. This image illustrates the critical step of identifying and sectioning the filum terminale to relieve tension on the spinal cord, a key procedure in neurosurgery and orthopedic spine surgery.

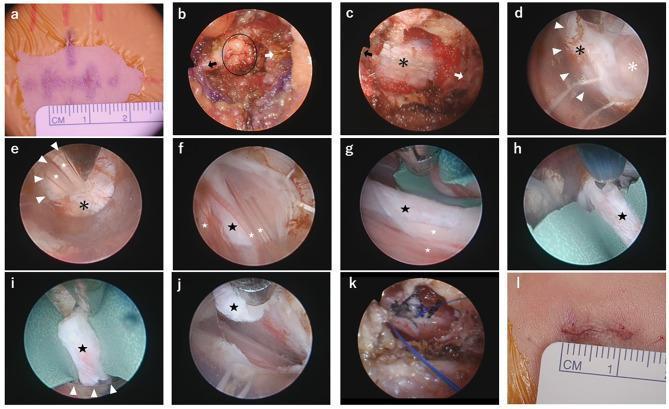
A 12-panel intraoperative visual sequence (a-l) documenting an endoscopic filum terminale resection for a tethered spinal cord. The sequence begins with skin incision marking (a) and progresses through extradural exposure (b, c), showing resection of the interspinous ligament and exposure of epidural fat and the dural sac. The intradural phase begins with a dural incision (d), revealing the arachnoid membrane and the cauda equina nerve roots (e). The filum terminale is identified by its distinctive pale, thickened appearance (f) and is isolated using a green rubber protective underlay (g). The surgical procedure continues with coagulation (h), cutting (i), and resection of the filum segment (j). Final frames demonstrate primary dural suturing using nylon sutures (k) and the closed surgical incision (l). This clinical content illustrates a minimally invasive neurosurgical approach for pediatric spinal dysraphism, highlighting key anatomical landmarks and the step-by-step transition from superficial tissues to the intradural space.

A 12-panel intraoperative visual sequence (a-l) documenting an endoscopic filum terminale resection for a tethered spinal cord. The sequence begins with skin incision marking (a) and progresses through extradural exposure (b, c), showing resection of the interspinous ligament and exposure of epidural fat and the dural sac. The intradural phase begins with a dural incision (d), revealing the arachnoid membrane and the cauda equina nerve roots (e). The filum terminale is identified by its distinctive pale, thickened appearance (f) and is isolated using a green rubber protective underlay (g). The surgical procedure continues with coagulation (h), cutting (i), and resection of the filum segment (j). Final frames demonstrate primary dural suturing using nylon sutures (k) and the closed surgical incision (l). This clinical content illustrates a minimally invasive neurosurgical approach for pediatric spinal dysraphism, highlighting key anatomical landmarks and the step-by-step transition from superficial tissues to the intradural space.

Searching Images

oculomotor nerve palsy eye examination findings pupil
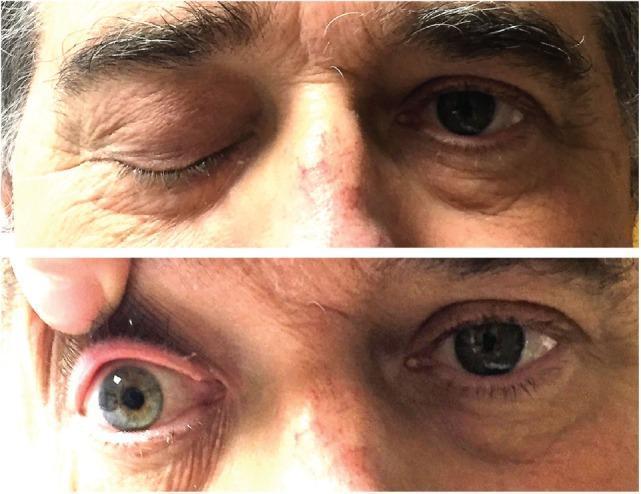
This clinical photograph consists of a two-panel vertical comparison demonstrating a cranial nerve III (oculomotor nerve) palsy. The top panel shows a front-facing view of a patient with complete right-sided ptosis, where the right upper eyelid is fully closed in contrast to the normal eyelid position and appearance of the left eye. The bottom panel shows the clinician manually elevating the right upper eyelid, revealing an ipsilateral fixed and dilated pupil (mydriasis) and a slightly bloodshot sclera. The left pupil appears smaller and reactive. These visual findings—ptosis and a large, non-reactive pupil—are characteristic signs of oculomotor nerve dysfunction, often associated with compressive lesions or infiltrative processes such as cavernous sinus involvement or skull base tumors. This material is used in medical education to teach the clinical presentation of multiple cranial neuropathies and the physical examination techniques for neuro-ophthalmological assessment.
This clinical photograph consists of a two-panel vertical comparison demonstrating a cranial nerve III (oculomotor nerve) palsy. The top panel shows a front-facing view of a patient with complete right-sided ptosis, where the right upper eyelid is fully closed in contrast to the normal eyelid position and appearance of the left eye. The bottom panel shows the clinician manually elevating the right upper eyelid, revealing an ipsilateral fixed and dilated pupil (mydriasis) and a slightly bloodshot sclera. The left pupil appears smaller and reactive. These visual findings—ptosis and a large, non-reactive pupil—are characteristic signs of oculomotor nerve dysfunction, often associated with compressive lesions or infiltrative processes such as cavernous sinus involvement or skull base tumors. This material is used in medical education to teach the clinical presentation of multiple cranial neuropathies and the physical examination techniques for neuro-ophthalmological assessment.

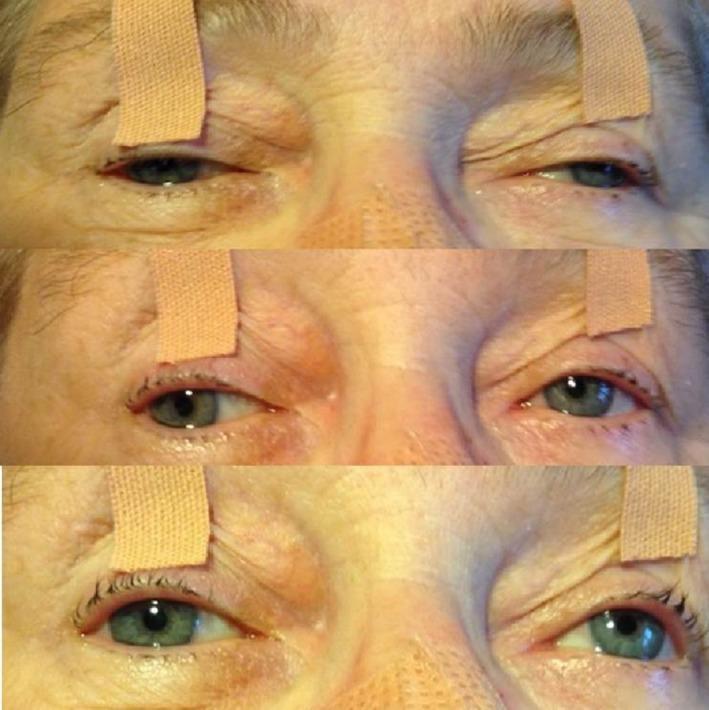
This clinical photograph consists of three vertically stacked snapshots of a patient's eyes, illustrating a complex pattern of ophthalmoplegia. The patient exhibits severe bilateral ptosis, necessitated by the use of medical tape to keep the upper eyelids elevated for examination. Close-up views reveal pupillary anisocoria, with the right pupil notably larger than the left, and a lack of reactivity. The sequence demonstrates multiple ocular motility deficits: the top and middle panels show weak adduction bilaterally, while the bottom panel highlights a right-sided upward gaze palsy where the right eye fails to elevate as effectively as the left. These findings are characteristic of brainstem involvement, specifically midbrain infarction affecting the oculomotor nerve nuclei and the medial longitudinal fasciculus (MLF), leading to bilateral internuclear ophthalmoplegia and internal ophthalmoplegia. The image serves as an educational tool for identifying neuro-ophthalmological signs associated with vertebrobasilar ischemia and Weber syndrome.

This clinical photograph consists of three vertically stacked snapshots of a patient's eyes, illustrating a complex pattern of ophthalmoplegia. The patient exhibits severe bilateral ptosis, necessitated by the use of medical tape to keep the upper eyelids elevated for examination. Close-up views reveal pupillary anisocoria, with the right pupil notably larger than the left, and a lack of reactivity. The sequence demonstrates multiple ocular motility deficits: the top and middle panels show weak adduction bilaterally, while the bottom panel highlights a right-sided upward gaze palsy where the right eye fails to elevate as effectively as the left. These findings are characteristic of brainstem involvement, specifically midbrain infarction affecting the oculomotor nerve nuclei and the medial longitudinal fasciculus (MLF), leading to bilateral internuclear ophthalmoplegia and internal ophthalmoplegia. The image serves as an educational tool for identifying neuro-ophthalmological signs associated with vertebrobasilar ischemia and Weber syndrome.

Loading Image
Loading Image
Loading Image
Loading Image
Your credits are exhausted. You can purchase a top-up or subscribe to a plan to continue using Orris. If you're already subscribed, your daily credits will reset tomorrow.
This is a shared conversation. Sign in to Orris to start your own chat.