Explain 10 heart disease with ECG change and ECG images those disease
Reading File
Finding Sources
Searching Images
ECG electrocardiogram myocardial infarction ST elevation
Finding Sources
Searching Images
atrial fibrillation ECG irregular rhythm absent P waves
Searching Images
heart block complete third degree AV block ECG
Searching Images
Wolff-Parkinson-White syndrome delta wave pre-excitation ECG
Searching Images
pericarditis saddle shaped ST elevation diffuse ECG
Searching Images
ventricular tachycardia wide complex tachycardia ECG
Searching Images
hypertrophic cardiomyopathy ECG left ventricular hypertrophy deep Q waves
Searching Images
pulmonary embolism ECG S1Q3T3 right heart strain sinus tachycardia
Searching Images
hyperkalemia tall peaked T waves ECG widened QRS sine wave
Searching Images
Brugada syndrome coved ST elevation right bundle branch block V1 V2 V3
Searching Images
dilated cardiomyopathy ECG left bundle branch block poor R wave progression
Here is a comprehensive overview of 10 heart diseases with their characteristic ECG changes, each accompanied by an ECG image.
10 Heart Diseases with ECG Changes
1. 🫀 ST-Elevation Myocardial Infarction (STEMI)
ECG Changes
- Hyperacute T waves (earliest sign — tall, broad, peaked T waves)
- ST-segment elevation ≥1 mm in ≥2 contiguous limb leads, or ≥2 mm in ≥2 contiguous precordial leads
- Pathological Q waves (>40 ms wide, >25% of QRS amplitude) — develop within hours
- Reciprocal ST depression in opposing leads
- T-wave inversion in the evolutionary phase
- Localization by leads:
- Anterior STEMI: V1–V4 (LAD occlusion)
- Inferior STEMI: II, III, aVF (RCA or LCx)
- Lateral STEMI: I, aVL, V5–V6
- Posterior STEMI: tall R wave + ST depression in V1–V2
ECG Image — Anterior STEMI (LAD occlusion)

Classic anterolateral STEMI: convex ST elevation V1–V6, hyperacute T waves in V2–V4, reciprocal ST depression in inferior leads (II, III, aVF).
ECG Image — Inferolateral STEMI (RCA/LCx occlusion)
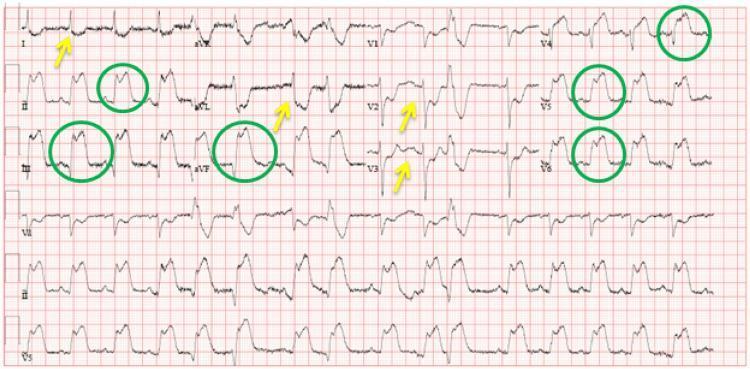
ST elevation in II, III, aVF and V4–V6 (green circles), reciprocal ST depression in I, aVL, V2–V3 (yellow arrows).
2. 💓 Atrial Fibrillation (AF)
ECG Changes
- Absent P waves — replaced by fibrillatory baseline (chaotic f-waves, best seen in V1 and II)
- Irregularly irregular RR intervals — the hallmark
- Narrow QRS (unless aberrant conduction/WPW)
- Rate: slow (<60 bpm), controlled (60–100 bpm), or rapid ventricular response (>100 bpm)
- Fibrillatory baseline most prominent in V1
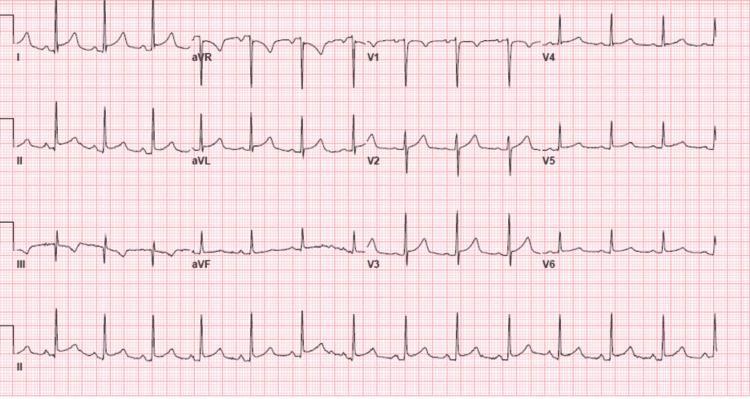
ECG Image — Atrial Fibrillation with Rapid Ventricular Response
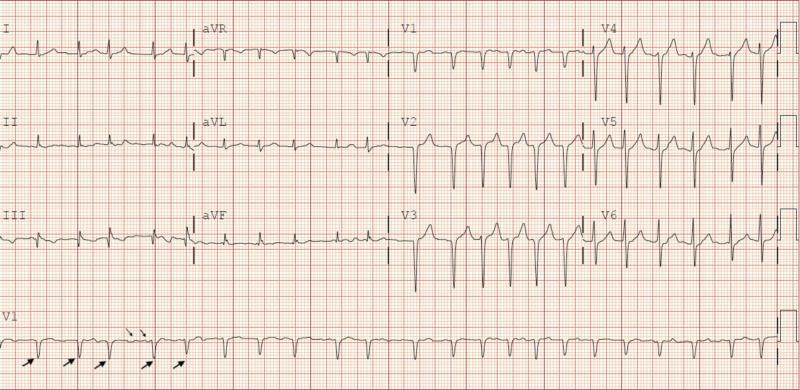
Irregular RR intervals, absent P waves replaced by fibrillatory baseline, narrow QRS at ~134 bpm.
3. 🔴 Complete (Third-Degree) Heart Block
ECG Changes
- Complete AV dissociation — P waves and QRS complexes are independent of each other
- P waves march through QRS complexes and T waves with no fixed PR interval
- Slow ventricular escape rhythm:
- Junctional escape: narrow QRS, rate 40–60 bpm
- Ventricular escape: wide QRS (>120 ms), rate 20–40 bpm
- Atrial rate faster than ventricular rate
- No P-to-QRS relationship
ECG Image — Complete (Third-Degree) AV Block
P waves visible but completely dissociated from wide QRS complexes (~55 bpm ventricular escape rhythm with infra-Hisian origin).
4. ⚡ Wolff-Parkinson-White (WPW) Syndrome
ECG Changes
- Short PR interval (<120 ms) — early ventricular pre-excitation via accessory pathway
- Delta wave — slurred upstroke at the beginning of the QRS complex
- Widened QRS (>120 ms) due to fusion of normal conduction + accessory pathway conduction
- Secondary ST-T changes discordant to the delta wave direction
- Pseudo-infarct Q waves in inferior leads (type B WPW)
- Risk of rapid AF conducting down the accessory pathway → ventricular fibrillation
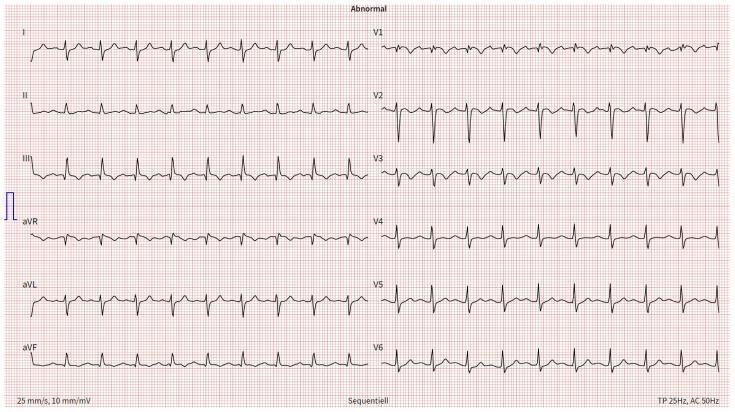
ECG Image — WPW Syndrome with Classic Delta Waves
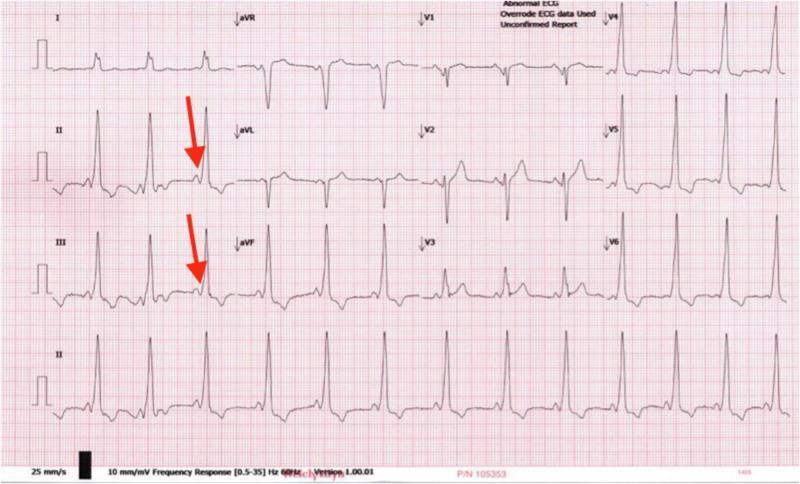
Short PR interval, slurred delta waves (red arrows in II and III), wide QRS — pre-excitation via accessory Bundle of Kent.
5. 🔥 Acute Pericarditis
ECG Changes
- Diffuse, concave (saddle-shaped) ST elevation in most leads except aVR and V1
- PR segment depression in II, V4–V6 (and PR elevation in aVR) — highly specific
- No reciprocal ST depression (unlike STEMI) — key differentiator
- Spodick's sign — downward slope of the TP segment
- Temporal stages: ST elevation → T-wave flattening → T-wave inversion → normalization
- No pathological Q waves
- Sinus tachycardia common due to inflammation
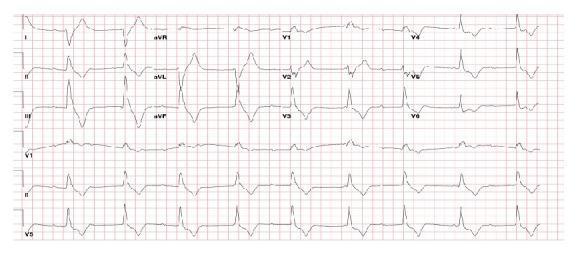
ECG Image — Acute Pericarditis
Diffuse concave ST elevation in I, II, III, aVF, V2–V6; PR depression in II/III/aVF; reciprocal ST depression and PR elevation in aVR.
6. 🌡️ Pulmonary Embolism (PE)
ECG Changes
- Sinus tachycardia — most common finding (>70% of cases)
- S1Q3T3 pattern (McGinn-White sign): prominent S wave in I, Q wave in III, T inversion in III
- Right bundle branch block (RBBB) — complete or incomplete
- T-wave inversions in V1–V4 — right ventricular strain pattern
- Right axis deviation
- P pulmonale (tall, peaked P wave >2.5 mm in II)
- New AF can occur
- Normal ECG does NOT exclude PE
ECG Image — Pulmonary Embolism with S1Q3T3 and Right Heart Strain
Sinus tachycardia at ~116 bpm; S1Q3T3 pattern; T inversion V1–V3; incomplete RBBB morphology — classic acute PE findings.
7. 💪 Hypertrophic Cardiomyopathy (HCM)
ECG Changes
- Left ventricular hypertrophy (LVH) voltage criteria — tall R in V5/V6 + deep S in V1 (Sokolow-Lyon >35 mm)
- Giant symmetric T-wave inversions in precordial and lateral leads (especially apical HCM/Yamaguchi syndrome — V2–V5, depth >10 mm)
- Pathological Q waves in lateral and inferior leads (due to septal hypertrophy)
- Left axis deviation
- Absence of septal Q waves in V5–V6 (loss of normal septal activation)
- ST-segment depression with strain pattern
ECG Image — HCM with Giant T-Wave Inversions (Yamaguchi/Apical HCM)
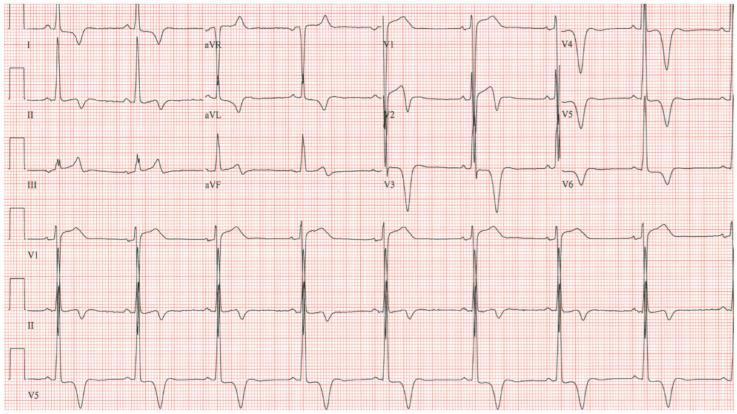
Sinus bradycardia; high voltage LVH (Sokolow-Lyon >50 mm); giant T inversions deepest in V3 (~15 mm) — apical HCM hallmark.
8. 🧬 Brugada Syndrome
ECG Changes
- Type 1 (diagnostic "coved" pattern):
- ST elevation ≥2 mm in ≥1 of V1–V3 with a coved (downward sloping) morphology
- ST descends into a negative T wave — the coved shape
- Type 2 ("saddleback" pattern) — not diagnostic alone, needs sodium channel blocker provocation
- Incomplete or complete RBBB morphology
- Changes often intermittent — may require fever, Na-channel blocker unmasking
- Risk: polymorphic VT and sudden cardiac death (especially during sleep)
- No structural heart disease
ECG Image — Brugada Syndrome Type 1 (Coved Pattern)
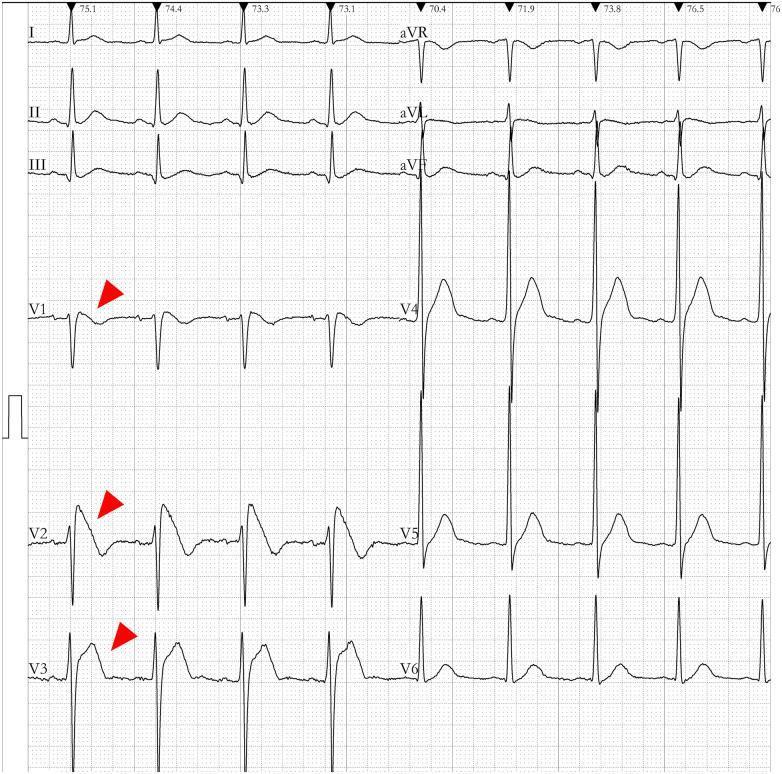
Type 1 Brugada: coved ST elevation >2 mm (red arrows) in V1–V2 transitioning to inverted T waves. Sinus rhythm.
9. ⚡ Ventricular Tachycardia (VT)
ECG Changes
- Wide QRS tachycardia (QRS >120 ms) at rate >100 bpm (usually 140–200 bpm)
- AV dissociation — P waves independent from QRS (pathognomonic when present)
- Capture beats — occasional narrow QRS (normal sinus beat "captures" ventricles)
- Fusion beats — hybrid QRS between sinus and VT complex
- Concordance in precordial leads (all positive or all negative) — strongly suggests VT
- Northwest axis (extreme axis deviation) — common in VT
- Brugada criteria, Vereckei algorithm used for VT vs SVT with aberrancy
ECG Image — Monomorphic Ventricular Tachycardia
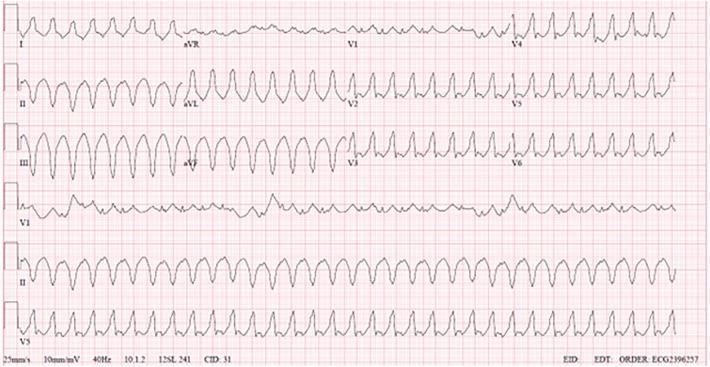
Monomorphic VT: rapid wide QRS, positive concordance V1–V6, no visible P waves, superior axis — ectopic ventricular origin.
10. 🧪 Hyperkalemia (Cardiac Manifestations)
ECG Changes — Progressive with Rising K⁺
| K⁺ Level | ECG Finding |
|---|---|
| 5.5–6.5 mEq/L | Tall, peaked ("tented") T waves — narrow base, high amplitude |
| 6.5–7.0 mEq/L | P wave flattening/widening, prolonged PR |
| 7.0–8.0 mEq/L | Wide QRS (intraventricular conduction delay), deepening |
| >8.0–9.0 mEq/L | Sine wave pattern — QRS merges with T wave |
| >10 mEq/L | Ventricular fibrillation or asystole |
ECG Image — Progressive Hyperkalemia Changes (Harrison's Internal Medicine)
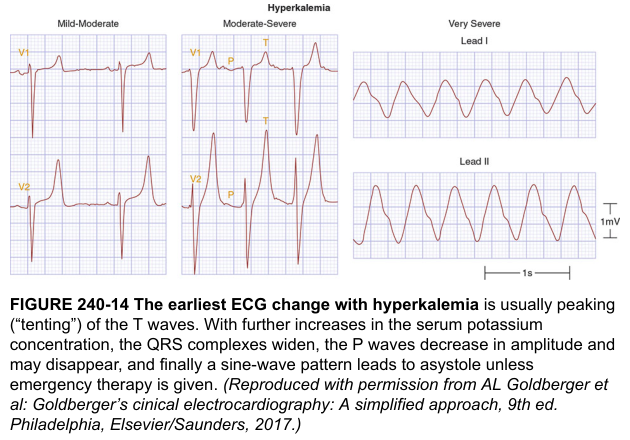
Classic ECG progression of hyperkalemia from peaked T waves (mild) → QRS widening → absent P waves → sine wave (very severe). — Harrison's Principles of Internal Medicine
ECG Image — Severe Hyperkalemia Before and After Treatment
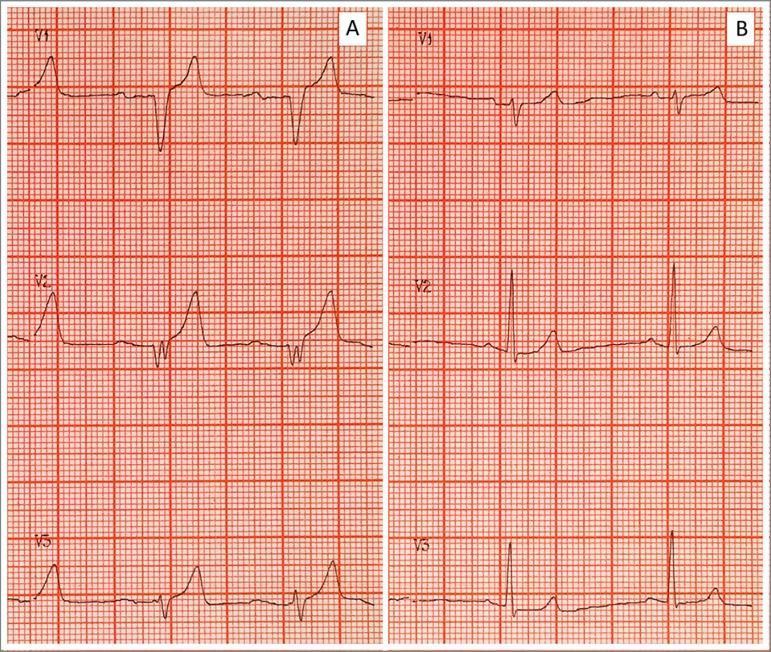
Panel A (pretreatment): peaked T waves, wide QRS, sine wave pattern at K⁺ 9.25 mEq/L. Panel B (post-treatment): normalization with calcium gluconate, insulin/glucose, and bicarbonate.
Quick Reference Summary Table
| # | Disease | Key ECG Features |
|---|---|---|
| 1 | STEMI | ST elevation (convex), Q waves, reciprocal depression, hyperacute T waves |
| 2 | Atrial Fibrillation | Absent P waves, irregularly irregular RR, fibrillatory baseline |
| 3 | Complete Heart Block | AV dissociation, slow escape rhythm, P waves unrelated to QRS |
| 4 | WPW Syndrome | Short PR, delta wave, widened QRS, secondary ST-T changes |
| 5 | Acute Pericarditis | Diffuse saddle-shaped ST elevation, PR depression, no Q waves |
| 6 | Pulmonary Embolism | Sinus tachycardia, S1Q3T3, RBBB, T inversion V1–V4 |
| 7 | HCM | LVH voltage, giant T inversions, pathological Q waves, strain pattern |
| 8 | Brugada Syndrome | Coved ST elevation V1–V3, RBBB morphology, normal between episodes |
| 9 | Ventricular Tachycardia | Wide QRS tachycardia, AV dissociation, concordance, capture/fusion beats |
| 10 | Hyperkalemia | Peaked T waves → PR prolongation → wide QRS → sine wave → VF/asystole |
Clinical note: ECG interpretation must always be correlated with the clinical presentation, history, and other investigations. This overview is for educational purposes. The ECG images are sourced from peer-reviewed clinical databases and Harrison's Principles of Internal Medicine.
This is a shared conversation. Sign in to Orris to start your own chat.