
Mi ecg changes explain
Reading File
The query "MI ECG changes" is broad - myocardial infarction has several stages and multiple ECG findings. Let me search the library comprehensively.
Finding Sources
Finding Sources
Reading File
Reading File
Finding Sources
Excellent content found. Let me now read the key Harrison's section on MI ECG changes and the Frameworks diagram:
Reading File
Reading File
Reading File
I have comprehensive content. Now let me fetch the key ECG evolution diagram and the current-of-injury diagram:
Loading Image
Loading Image
I now have all the key information and diagrams. Here is a thorough, well-organized answer.
ECG Changes in Myocardial Infarction (MI)
The Big Picture - Why the ECG Changes
Ischemia changes the electrical properties of myocardial cells - it lowers the resting membrane potential and shortens action potential duration. This creates a voltage gradient between normal and ischemic zones, producing "currents of injury" that show up on the ECG as ST-segment deviations.
Current of injury - subendocardial vs transmural:
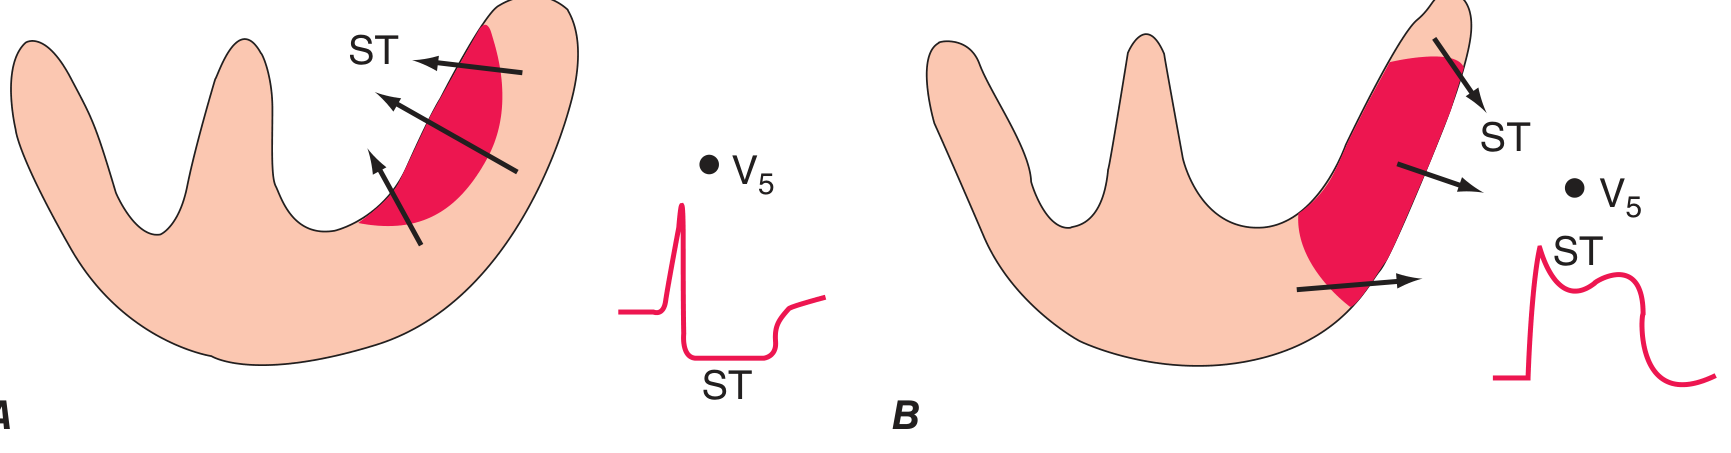
- Panel A (subendocardial): ST vector points inward → leads overlying the area show ST depression
- Panel B (transmural/epicardial): ST vector points outward → overlying leads show ST elevation
Temporal Evolution of ECG Changes in STEMI
This is the classic sequence you must know:
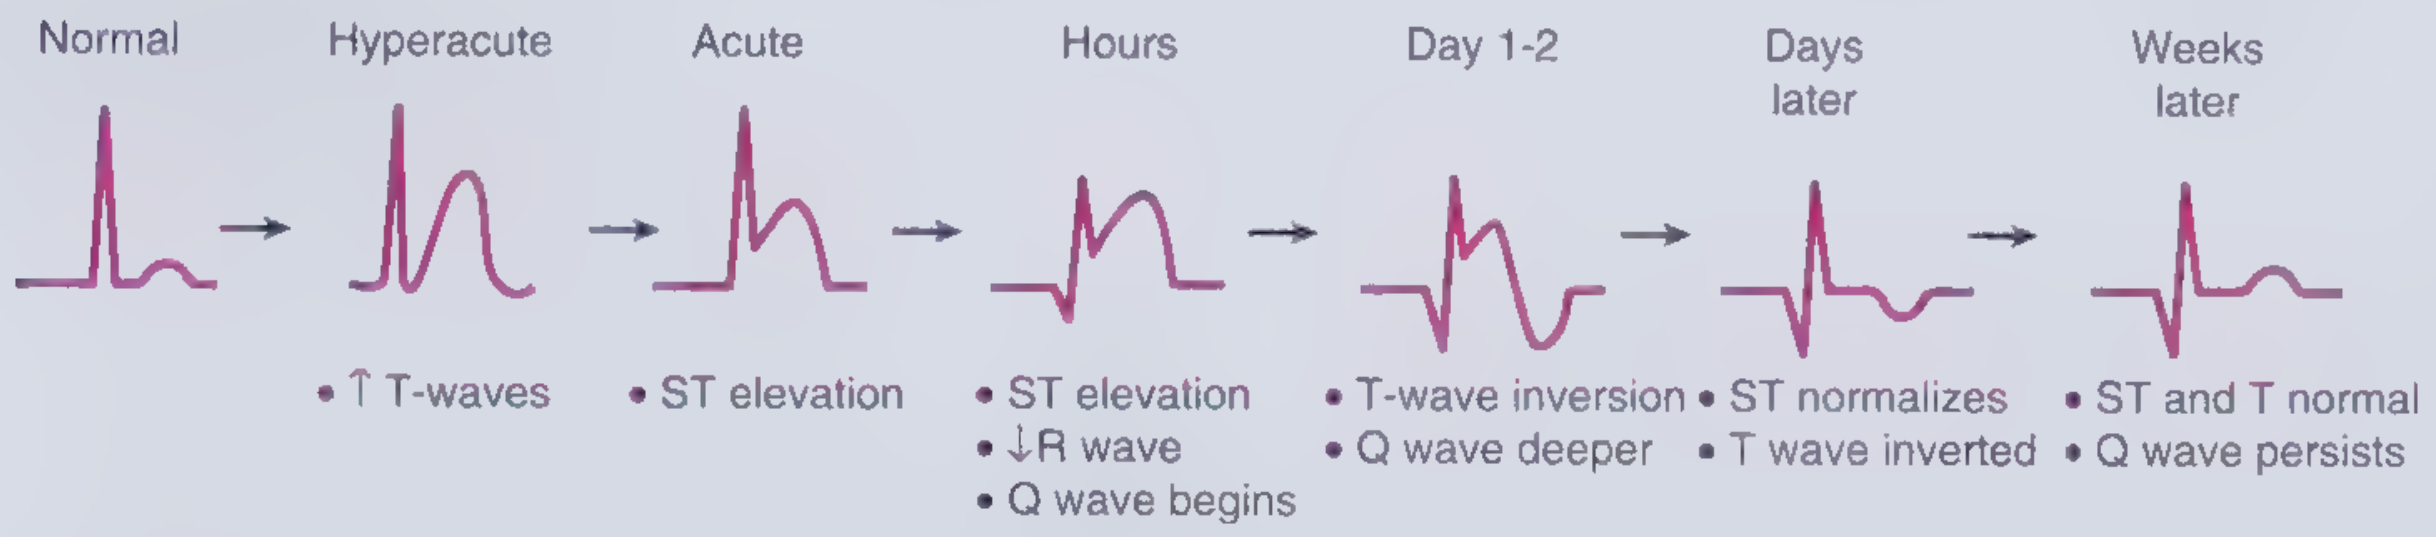
| Stage | Time | ECG Change | Mechanism |
|---|---|---|---|
| Hyperacute | Minutes | Tall, broad, peaked "hyperacute" T waves | Early ischemia - increased T-wave positivity over ischemic zone |
| Acute | Minutes-hours | ST elevation (tombstone pattern) | Transmural injury current; epicardial injury shifts ST vector outward |
| Hours | Several hours | ST elevation persists + R-wave loss begins + Q wave starts forming | Necrosis begins; electrically silent myocardium loses R-wave contribution |
| Day 1-2 | ~24-48 hrs | T-wave inversion develops + Q wave deepens | Repolarization abnormality over necrotic/peri-necrotic tissue |
| Days later | Days | ST normalizes + T wave still inverted | Injury current resolves but repolarization still disturbed |
| Weeks later | Weeks-months | ST and T normal; Q wave persists | Scar = permanent electrical silence; Q wave is the permanent scar marker |
The Three Major ECG Findings Explained
1. ST Elevation
The ischemic myocyte (cell B in the two-cell model) has a more positive resting potential than normal (cell A). During the TP/PR interval, the damaged cell is partially depolarized, which depresses the baseline. The ST segment appears elevated relative to this depressed baseline. This is the hallmark of transmural injury (STEMI).
Diagnostic criteria for STEMI:
- ≥2 mm ST elevation in V1-V3
- ≥1 mm ST elevation in other leads (≥1.5 mm in women in V2-V3; ≥0.5 mm with new LBBB)
2. Pathological Q Waves
The infarcted zone becomes electrically silent - no action potentials can propagate into dead tissue. The net depolarization vector is now pulled away from the infarcted zone. Leads overlying the infarct see this as a large initial negative deflection = pathological Q wave.
- Pathological Q = duration >0.04 s (40 ms) OR depth >25% of the R wave
- Q waves appear in leads facing the infarcted territory
- They represent irreversible necrosis (unlike ST changes which can be transient)
3. T-Wave Inversion
After the acute phase, repolarization of the peri-infarct zone is delayed and altered. The T-wave vector flips relative to the QRS = symmetric T-wave inversion in the leads facing the infarcted zone. This can persist for weeks.
A special pattern - Wellens' T waves (deep symmetric anterior T-wave inversions in V1-V4) - indicates critical proximal LAD stenosis even without completed infarction.
Localization by Lead
| Territory | Occluded Vessel | Leads with ST Elevation |
|---|---|---|
| Anteroseptal | LAD (proximal) | V1, V2 (±V3) |
| Anterior | LAD | V1-V4 |
| Anterolateral | LAD + diagonal or LCx | V1-V6, I, aVL |
| Lateral | LCx | I, aVL (±V5, V6) |
| Inferior | RCA (80%) or LCx (20%) | II, III, aVF |
| Inferolateral | RCA + LCx | II, III, aVF + V5, V6 |
| True posterior | LCx or RCA | Tall R in V1-V2 + ST depression V1-V3 (mirror image) |
| Right ventricular | RCA (proximal) | ST elevation in V3R-V6R; seen with inferior MI |
Posterior MI does NOT produce Q waves in conventional leads - it produces tall R waves and ST depression in V1-V2 as a "mirror" of the true changes.
NSTEMI / UA ECG Changes
In NSTEMI (subendocardial infarction), there is no ST elevation. The findings are:
- New horizontal or downsloping ST depression ≥0.05 mV in 2 contiguous leads
- T-wave inversion ≥0.1 mV in 2 contiguous leads with prominent R wave or R/S >1
- The ECG can even be normal; the diagnosis depends on elevated troponin
Reciprocal Changes
Leads opposite to the infarcted zone typically show reciprocal ST depression - these are mirror-image changes, not additional ischemia. For example:
- Inferior STEMI (II, III, aVF elevation) → reciprocal depression in I, aVL
- Anterior STEMI → reciprocal depression in inferior leads
- Reciprocal changes increase diagnostic confidence for STEMI
ECG Mimics to Exclude (False Positives)
- Early repolarization (benign, common in young males)
- Left bundle branch block (LBBB) - use Sgarbossa criteria
- Acute pericarditis (saddle-shaped, diffuse, no reciprocal changes)
- LVH with strain pattern
- Brugada syndrome (V1-V2 pseudo-RBBB + ST elevation)
- Hyperkalemia
- Takotsubo syndrome
Sources:
- Harrison's Principles of Internal Medicine, 22E, Chapter 247 (ECG in Ischemia)
- Frameworks for Internal Medicine, Chapter 2 (Acute Coronary Syndrome)
- Medical Physiology (Boron & Boulpaep), Box 21-3 (Myocardial Infarction)
- Tintinalli's Emergency Medicine, Table 49-4 (ECG ST criteria for AMI)
This is a shared conversation. Sign in to Orris to start your own chat.