
Discuss the factors responsible for the origin and movement of ocean currents. Give an account of the major currents of the North Atlantic Ocean with a suitable map.(20 Marks,300 Words)
factors responsible for origin and movement of ocean currents geography
major ocean currents North Atlantic Ocean map circulation system
major ocean currents North Atlantic gyre map Gulf Stream
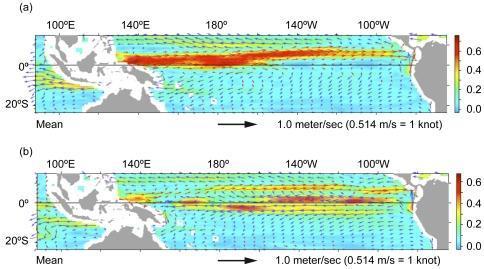
Two comparison maps illustrate mean surface ocean currents in the Pacific region (15°N–24°S) to explain the passive dispersal of green sea turtles. Map (a) shows the July–December 1997 period during an intense El Niño event, characterized by a prominent, high-velocity eastward-flowing North Equatorial Counter-current (NECC), indicated by a dense band of red vector arrows and warm contour colors (approaching 0.6 m/s). Map (b) shows July–December 2000 under common non-El Niño conditions, where the NECC is significantly weaker and reduced in spatial extent, with a stronger presence of westward-flowing equatorial currents indicated by blue vector arrows. The vertical color scale on the right quantifies current speed from 0.0 to 0.6 meters per second. These oceanographic patterns are used to understand the genetic connectivity and recruitment of juvenile green turtles at foraging grounds like Gorgona Island, illustrating how climatic variations in equatorial currents facilitate transpacific migration from western to eastern rookeries.
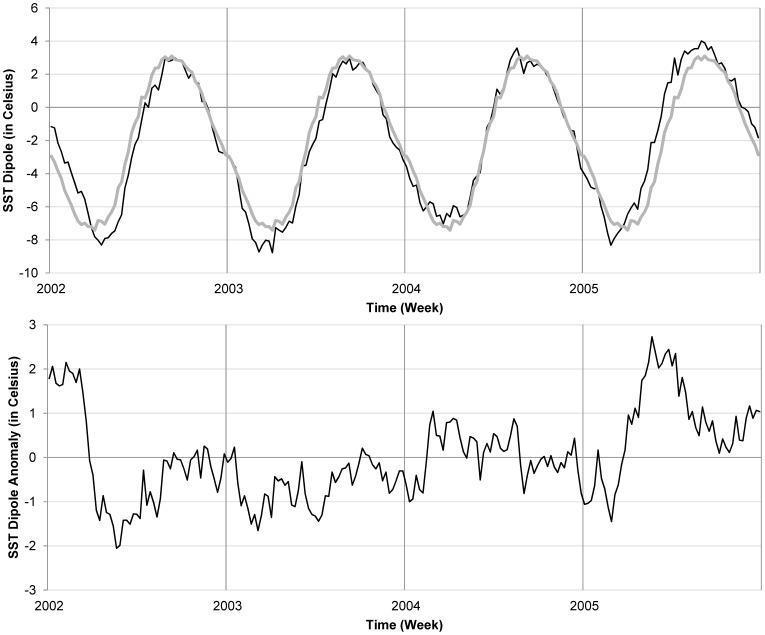
This figure presents two panels showing Sea Surface Temperature (SST) data in the tropical Atlantic Ocean between 2002 and 2005, serving as a climate-health indicator for environmental epidemiology studies, specifically related to cholera outbreaks in Western Africa. The top panel illustrates the SST dipole time series (black line) and the four-year seasonal mean (grey line) measured in degrees Celsius. The data displays a clear annual cyclicity with peaks around +4°C and troughs reaching -8°C. The bottom panel depicts the SST dipole anomaly, highlighting deviations from the seasonal average. Of clinical relevance is the year 2005, which shows a prolonged and distinct positive anomaly starting in early 2005 and peaking in late summer. This positive SST gradient in the tropical north Atlantic is associated with the northward migration of the Intertropical Convergence Zone, leading to heavy rainfall and flooding. These environmental conditions are identified as drivers for the resurgence and amplification of water-borne disease transmission, such as Vibrio cholerae, by contaminating water facilities in regions like Dakar, Senegal.
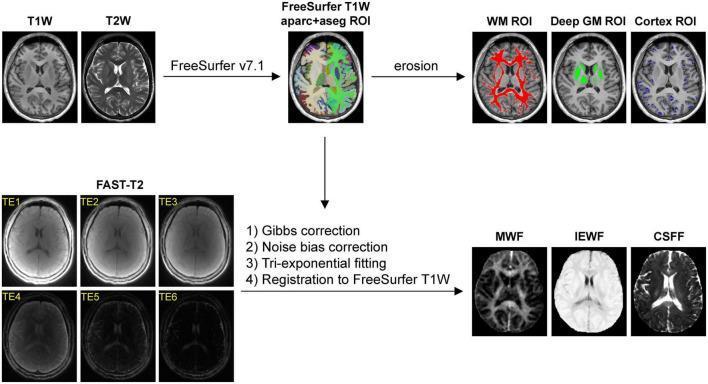
This diagram illustrates an automated neuroimaging post-processing pipeline for multi-compartment water fraction mapping. The process is divided into two main parallel streams. Stream 1 focuses on anatomical segmentation: T1-weighted (T1W) and T2-weighted (T2W) MRI inputs are processed via FreeSurfer v7.1 to generate an 'aparc+aseg' region of interest (ROI) map. Subsequent erosion operations create three refined binary tissue masks: cerebral white matter (WM), deep gray matter (GM), and cortex. Stream 2 involves processing FAST-T2 data across six echo times (TE1-TE6). This branch includes Gibbs correction, noise bias correction, tri-exponential fitting, and registration to the FreeSurfer T1W space. The final outputs of the pipeline are quantitative maps of compartmental water fractions: Myelin Water Fraction (MWF), Intra/Extracellular Water Fraction (IEWF), and Cerebrospinal Fluid Fraction (CSFF). The pipeline serves as a standardized method to quantify microstructural brain tissue changes and glymphatic clearance markers in research and clinical neuroimaging.
A detailed geography map of the major ocean currents of the North Atlantic Ocean. Show and label the following currents with directional arrows: North Equatorial Current (flowing westward near the equator), Gulf Stream (flowing northward along the eastern coast of North America), North Atlantic Drift (flowing northeast across the Atlantic toward Europe), Canary Current (flowing southward along the western coast of Europe and Africa), Labrador Current (flowing southward along eastern Canada), Irminger Current, Norwegian Current, and the North Atlantic Gyre (clockwise circulation). Use warm colors (red/orange) for warm currents and cool colors (blue) for cold currents. Include a legend, compass rose, and label key geographic features: Gulf of Mexico, Florida, Newfoundland, British Isles, Canary Islands, Cape Verde. Clean academic geography map style with clear annotations.
Ocean Currents: Origin, Movement, and the North Atlantic System
Part I: Factors Responsible for the Origin and Movement of Ocean Currents
1. Planetary Winds (Primary Cause)
2. Coriolis Effect (Deflection)
3. Thermohaline Circulation (Density Differences)
- Temperature: Warm water (less dense) tends to rise; cold water (denser) sinks.
- Salinity: High-salinity water is denser; when sea ice forms, salt is expelled into surrounding water, increasing its density and causing it to sink.
4. Gravity and Pressure Gradient
5. Ocean Floor Topography and Coastline Configuration
6. Insolation (Solar Heating)
7. Centrifugal Force and Earth's Shape
Part II: Major Currents of the North Atlantic Ocean
Map of Major North Atlantic Ocean Currents
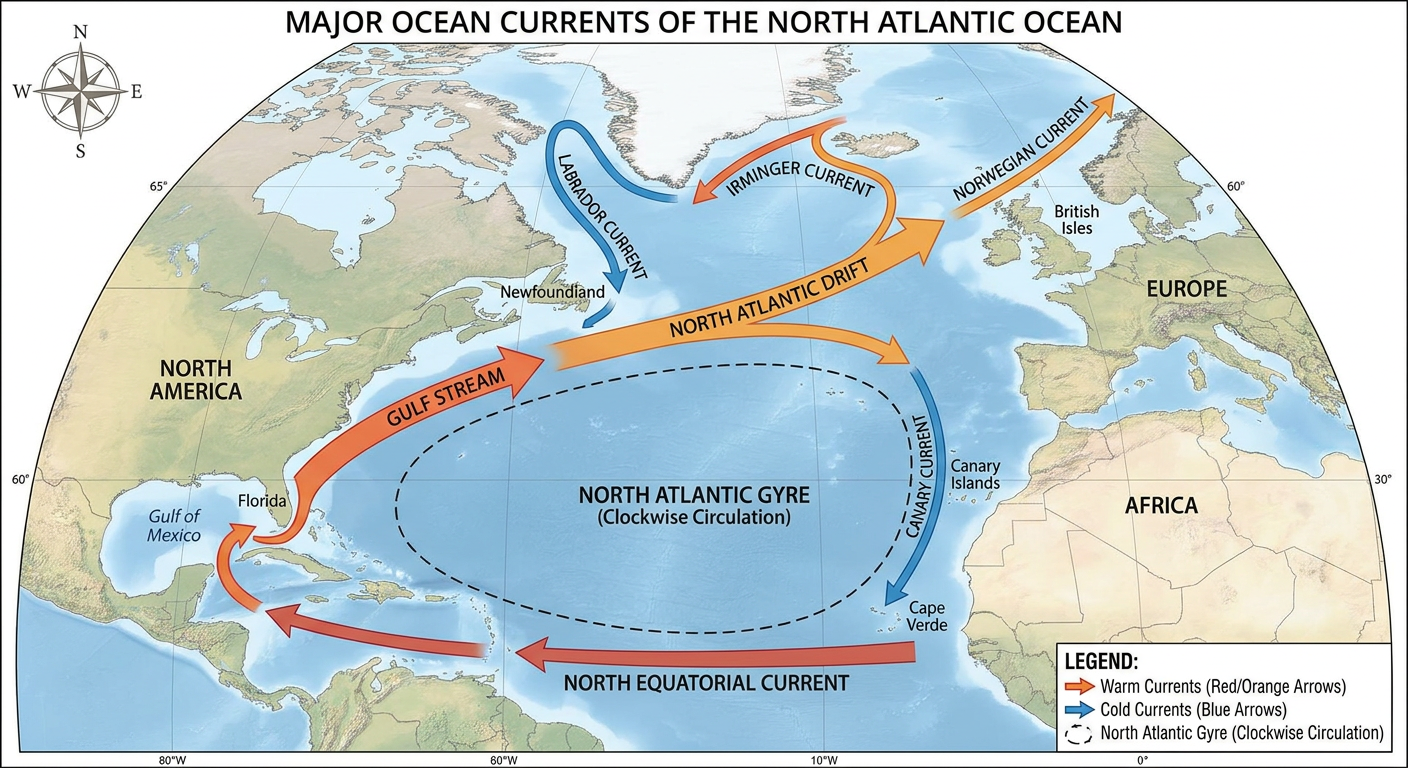
1. North Equatorial Current (Warm)
- Originates near the Cape Verde Islands (~10°N).
- Driven westward by the Northeast Trade Winds.
- Flows from the west coast of Africa toward the Caribbean Sea and Gulf of Mexico.
- This is the starting point of the entire North Atlantic gyre.
2. Gulf Stream (Warm) - The Dominant Current
- The most powerful current in the North Atlantic, sometimes called the "river in the ocean."
- Formed when the North Equatorial Current enters the Gulf of Mexico and exits through the Florida Straits between Florida and Cuba.
- Flows northward along the eastern coast of the United States at speeds of 1-6 knots.
- Carries enormous volumes of warm, saline tropical water northward.
- The warmth of the Gulf Stream moderates the climate of the US East Coast.
- As GEOMAR notes, it carries more water than all the rivers on Earth combined.
3. North Atlantic Drift (North Atlantic Current) (Warm)
- The Gulf Stream weakens as it crosses the Atlantic and becomes the North Atlantic Drift (also called the North Atlantic Current) east of the Grand Banks of Newfoundland.
- Flows northeast toward the British Isles and northwestern Europe.
- This warm current keeps ports like London and Amsterdam ice-free in winter and gives Western Europe a much warmer climate than its latitude would otherwise permit.
- Splits into branches: the Norwegian Current (going north to the Arctic) and the Irminger Current (looping toward Iceland and Greenland).
4. Norwegian Current (Warm)
- A branch of the North Atlantic Drift flowing into the Norwegian Sea.
- Keeps the fjords and ports of Norway ice-free throughout the year.
- Eventually cools, sinks, and feeds the deep thermohaline circulation.
5. Irminger Current (Warm)
- Another branch of the North Atlantic Drift that flows northwest toward Iceland and along the south and west coasts of Greenland.
- Moderates the Icelandic climate.
6. Labrador Current (Cold)
- Originates in the Arctic Ocean and flows southward along the coast of Labrador and eastern Canada.
- Carries cold, fresh water from melting ice sheets and Arctic seas.
- Meets the warm Gulf Stream near the Grand Banks off Newfoundland - this collision of cold and warm water creates dense fog and one of the world's richest fishing grounds.
- The Labrador Current is responsible for keeping ports like Halifax cooler and transporting icebergs southward into shipping lanes (notable in the Titanic disaster).
7. Canary Current (Cold)
- Flows southward along the western coasts of Spain, Portugal, Morocco, and West Africa.
- It is the eastern limb of the North Atlantic gyre, completing the clockwise circulation.
- A cold current that creates upwelling of nutrient-rich deep water off the African coast, supporting productive fisheries.
- It eventually feeds back into the North Equatorial Current near the Canary Islands, completing the circuit.
8. Antilles Current (Warm)
- Flows northwestward along the outer edge of the Caribbean island chain.
- Merges with the Gulf Stream near Florida, reinforcing it.
Summary: The North Atlantic Gyre
North Equatorial Current (W) → Gulf Stream (N) → North Atlantic Drift (NE) → Canary Current (S) → (back to start)
| Current | Type | Direction | Significance |
|---|---|---|---|
| North Equatorial Current | Warm | Westward | Initiates the gyre |
| Gulf Stream | Warm | Northward | Warms eastern USA coast |
| North Atlantic Drift | Warm | Northeast | Warms Western Europe |
| Norwegian Current | Warm | Northward | Keeps Norway ice-free |
| Irminger Current | Warm | Northwest | Moderates Iceland |
| Labrador Current | Cold | Southward | Creates Grand Banks fog & fisheries |
| Canary Current | Cold | Southward | Creates upwelling; completes gyre |