CO2 transport diffusion and dissociation curve full details for md exams 15marks
Reading File
Finding Sources
Finding Sources
Finding Sources
Reading File
Searching Images
CO2 transport carbon dioxide dissociation curve Haldane effect
Reading File
Reading File
Loading Image
Loading Image
I now have all the content and diagrams needed. Here is a comprehensive 15-mark answer:
CO₂ Transport, Diffusion, and Dissociation Curve
1. Overview
CO₂ is produced continuously in tissue cells as a byproduct of oxidative metabolism. Under resting conditions, 4 mL of CO₂ is transported from tissues to lungs per 100 mL of blood. Unlike O₂, CO₂ combines with chemical substances in the blood that amplify its transport 15–20-fold.
2. Diffusion of CO₂ — From Tissues to Blood
CO₂ transport begins with simple diffusion driven by partial pressure gradients:
| Site | PCO₂ | Direction |
|---|---|---|
| Tissue cells | ~46 mm Hg | → into capillaries |
| Venous blood | 45 mm Hg | → toward lungs |
| Alveolar air | 40 mm Hg | CO₂ diffuses out |
| Arterial blood | 40 mm Hg | equilibrates with alveoli |
- In tissue capillaries: PCO₂ rises from 40 → 45 mm Hg as CO₂ diffuses in
- In pulmonary capillaries: PCO₂ falls from 45 → 40 mm Hg as CO₂ diffuses out into alveoli
- CO₂ is 20× more soluble in body fluids than O₂, so diffusion is rarely a limiting factor
3. Chemical Forms of CO₂ Transport
CO₂ is transported in three forms:
A. Dissolved CO₂ — 7%
- CO₂ dissolves directly in plasma as molecular CO₂
- Venous blood: 2.7 mL/100 mL; arterial: 2.4 mL/100 mL
- Net transport: 0.3 mL/100 mL → ~7% of total CO₂
B. Bicarbonate Ion (HCO₃⁻) — 70% ★ Most Important
This is the dominant pathway. The sequence inside red blood cells (RBCs):
CO₂ + H₂O →[carbonic anhydrase]→ H₂CO₃ → H⁺ + HCO₃⁻
Key steps:
- CO₂ enters RBCs and reacts with H₂O via carbonic anhydrase (5000× faster than in plasma)
- H₂CO₃ dissociates into H⁺ and HCO₃⁻ almost instantaneously
- H⁺ is buffered by hemoglobin (powerful acid-base buffer)
- HCO₃⁻ diffuses out into plasma in exchange for Cl⁻ via the bicarbonate-chloride carrier protein
- This exchange is called the Hamburger Shift (Chloride Shift)
In the lungs, the entire process reverses: HCO₃⁻ re-enters RBCs, recombines with H⁺ (released from oxyhemoglobin) → H₂CO₃ → CO₂ + H₂O → CO₂ exhaled
C. Carbamino Compounds — 23% (Carbaminohemoglobin)
- CO₂ reacts directly with –NH₂ (amino) groups of hemoglobin and plasma proteins
- Forms carbaminohemoglobin (also called carbhemoglobin):
Hb–NH₂ + CO₂ ⇌ Hb–NH–COOH (carbaminohemoglobin)
- This reaction is rapid but smaller in capacity than the bicarbonate pathway
- Deoxygenated Hb (in tissues) binds more CO₂ than oxygenated Hb
- Carries ~20–23% of total CO₂ transport
4. Summary Table: Proportions of CO₂ Transport
| Form | % Transported | Location |
|---|---|---|
| Dissolved CO₂ | ~7% | Plasma |
| Bicarbonate (HCO₃⁻) | ~70% | Plasma (formed in RBCs) |
| Carbaminohemoglobin | ~23% | RBCs |
5. CO₂ Dissociation Curve
The CO₂ dissociation curve plots total blood CO₂ (all forms) vs. PCO₂:
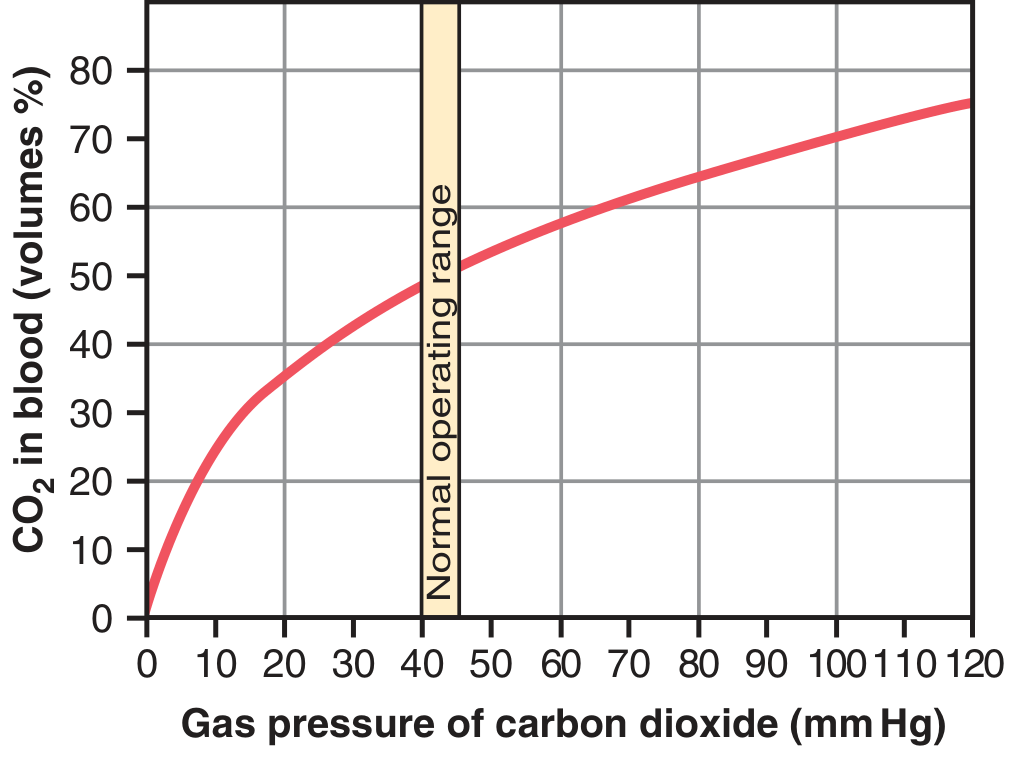
CO₂ dissociation curve — normal operating range highlighted between 40–45 mm Hg. — Guyton & Hall, Fig. 41.14
Key Features:
| Feature | Detail |
|---|---|
| Shape | Steep, nearly linear (unlike O₂ sigmoid curve) |
| Normal PCO₂ range | 40 mm Hg (arterial) → 45 mm Hg (venous) |
| Total CO₂ in blood | ~50 vol% |
| CO₂ exchanged per cycle | ~4 vol% (rises from 48 → 52 vol% in tissues) |
| No plateau at physiological range | Blood can keep absorbing CO₂ even at high PCO₂ |
Comparison with O₂ Dissociation Curve:
| Feature | O₂ Curve | CO₂ Curve |
|---|---|---|
| Shape | S-shaped (sigmoid) | Steep, almost linear |
| Binding molecule | Hemoglobin (heme) | Multiple (HCO₃⁻, Hb amino, dissolved) |
| Plateau | Yes (above ~70 mm Hg) | No plateau in physiological range |
| Factors shifting curve | Bohr effect | Haldane effect |
6. The Haldane Effect ★★ (High-Yield Exam Topic)
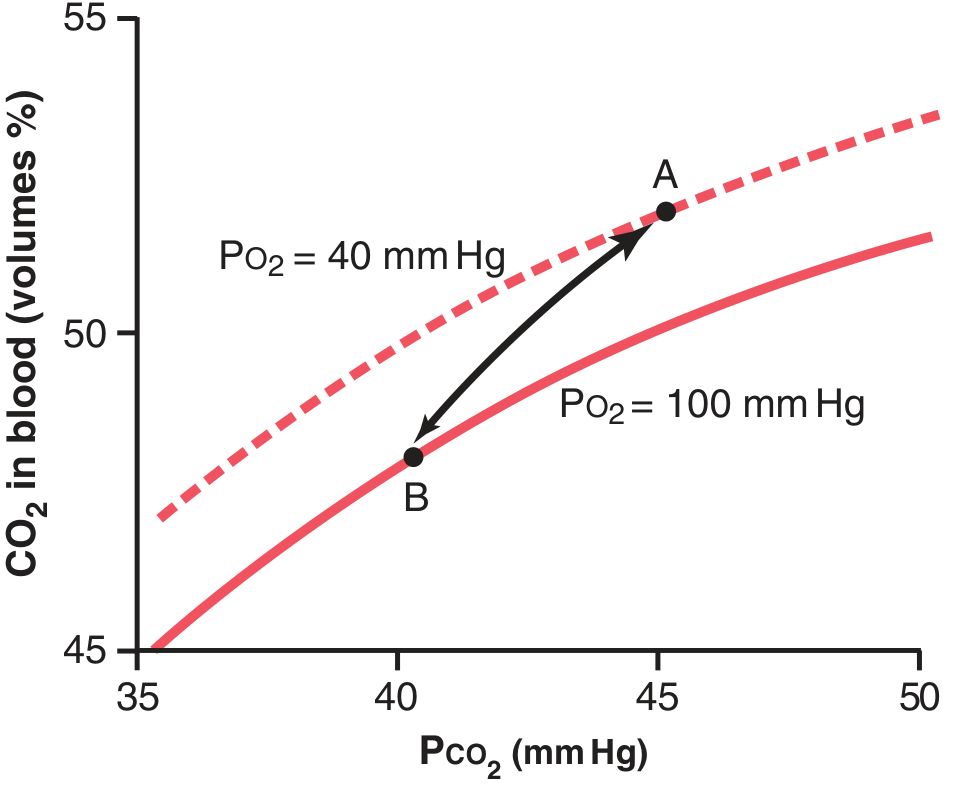
Haldane effect: At PO₂ = 40 mm Hg (tissues), blood carries more CO₂ at any given PCO₂ (Point A) than at PO₂ = 100 mm Hg (lungs, Point B). — Guyton & Hall, Fig. 41.15
Definition: Oxygenation of hemoglobin in the lungs promotes CO₂ release from blood.
Mechanism:
- When O₂ binds Hb in the lungs → Hb becomes a stronger acid (oxyhemoglobin is more acidic)
- More acidic Hb has less affinity for CO₂ → carbamino-CO₂ is displaced from Hb
- More acidic Hb releases excess H⁺ → H⁺ + HCO₃⁻ → H₂CO₃ → CO₂ + H₂O → CO₂ exhaled
Clinical significance: The Haldane effect is quantitatively more important than the Bohr effect. At tissues, deoxygenated Hb picks up more CO₂; in the lungs, oxygenated Hb dumps CO₂.
7. The Bohr Effect (Related — Exam Favorite)
- Increased CO₂ (↑ PCO₂) and decreased pH → O₂ dissociation curve shifts RIGHT
- Hb releases O₂ more readily to tissues
- The Haldane and Bohr effects are complementary and reinforce each other
8. Factors Affecting the CO₂ Dissociation Curve
| Factor | Effect on Curve |
|---|---|
| ↑ Oxygenation (PO₂) | Shifts curve DOWN (less CO₂ carried) — Haldane effect |
| ↓ Oxygenation (PO₂) | Shifts curve UP (more CO₂ carried) |
| ↑ Temperature | ↑ CO₂ release from blood |
| ↑ 2,3-DPG | Slight effect |
9. CO₂ Transport — Tissue vs. Lung Summary
| Event | Tissues | Lungs |
|---|---|---|
| PCO₂ gradient | Cell > capillary → CO₂ enters blood | Blood > alveolus → CO₂ leaves blood |
| Carbonic anhydrase | CO₂ + H₂O → H₂CO₃ | H₂CO₃ → CO₂ + H₂O |
| Chloride shift | Cl⁻ into RBC; HCO₃⁻ out | HCO₃⁻ into RBC; Cl⁻ out |
| Hb state | Deoxy-Hb (better CO₂ carrier) | Oxy-Hb (releases CO₂) |
| Net CO₂ movement | Into blood | Out of blood |
10. Clinical Correlations
- Hypercapnia (↑ PCO₂): impaired CO₂ transport → respiratory acidosis
- Carbonic anhydrase inhibitors (e.g., acetazolamide): slow HCO₃⁻ formation → used in altitude sickness, glaucoma
- Carbon monoxide poisoning: Hb occupied by CO → less carbaminohemoglobin formation, impaired CO₂ transport
- Shock/hypoperfusion: stagnant blood → CO₂ accumulates in tissues
Sources: Guyton and Hall Textbook of Medical Physiology (Ch. 41 — Transport of O₂ and CO₂ in Blood and Tissue Fluids)
This is a shared conversation. Sign in to Orris to start your own chat.