O2 transport diffusion and dissociation curve full details for md exams 15marks
Reading File
Finding Sources
Finding Sources
Finding Sources
Reading File
Reading File
Reading File
Reading File
Reading File
Reading File
Reading File
Reading File
Loading Image
Loading Image
Here is a comprehensive 15-mark answer on O₂ Transport, Diffusion, and the Dissociation Curve, based on Guyton & Hall and Fishman's Pulmonary Diseases.
Oxygen Transport, Diffusion, and the Oxygen-Haemoglobin Dissociation Curve
I. FORMS OF OXYGEN TRANSPORT IN BLOOD
Oxygen is relatively insoluble in aqueous solutions. Two forms carry O₂ in blood:
1. Dissolved O₂ (Physical Solution)
- Oxygen dissolves directly in plasma and intracellular fluid of RBCs.
- Amount dissolved = 0.003 mL O₂ per 100 mL blood per 1 mmHg PO₂
- At arterial PO₂ of 100 mmHg → only ~0.3 mL O₂/100 mL blood — grossly insufficient to meet tissue demands.
- However, dissolved O₂ is physiologically critical: it is the only form that diffuses across alveolar-capillary membranes and RBC membranes; haemoglobin cannot traverse membranes itself.
2. O₂ Bound to Haemoglobin (Chemical Combination)
- Each haemoglobin (Hb) molecule (MW ~68,000) carries 4 haem groups, each binding one O₂.
- At Hb = 15 g/100 mL blood, ~20 mL O₂/100 mL blood can be carried — approximately 60–100× more than dissolved alone.
- Binding is reversible and cooperative: binding of the first O₂ increases affinity for subsequent O₂ molecules — this produces the characteristic sigmoid (S-shaped) curve.
- O₂ binds to the ferrous (Fe²⁺) iron of haem; this is oxygenation, not oxidation.
II. DIFFUSION OF O₂ — ALVEOLI TO BLOOD TO TISSUES
Fick's Law of Diffusion
Rate of diffusion ∝ (Surface area × Pressure gradient × Diffusion coefficient) / Membrane thickness
A. Alveolar to Pulmonary Capillary
| Location | PO₂ |
|---|---|
| Alveolar air | 104 mmHg |
| Pulmonary capillary blood (entering) | 40 mmHg |
| Pulmonary capillary blood (leaving) | ~104 mmHg |
| Systemic arterial blood | ~95 mmHg (slight right-to-left shunt effect) |
- Pressure gradient driving O₂ into blood = 64 mmHg initially.
- O₂ equilibration occurs within 0.2–0.4 s; transit time through pulmonary capillary at rest = ~0.75 s → full equilibration well within available time.
- During heavy exercise (transit time ↓ to ~0.3 s), equilibration is still usually achieved, though it may become diffusion-limited in disease.
B. Pulmonary Capillary to Red Cell
- O₂ diffuses through plasma, crosses the RBC membrane, then diffuses inside the cell.
- Inside the RBC, high Hb concentration makes the cytoplasm 3× more viscous than water, reducing the O₂ diffusion coefficient to one-third of its aqueous value.
- Despite the short distances (few microns), significant diffusion gradients may exist within the RBC interior.
C. Systemic Capillary to Tissue Cells
| Location | PO₂ |
|---|---|
| Arterial end of tissue capillary | 95 mmHg |
| Interstitial fluid | ~40 mmHg |
| Venous end of capillary | ~40 mmHg |
| Intracellular | 5 mmHg (average); critical minimum ~1 mmHg |
- Gradient of ~55 mmHg drives O₂ out of capillary into interstitium, then into cells.
- Tissue cells are usually ≤50 µm from a capillary; greater distance causes diffusion-limited O₂ delivery.
- Intracellular PO₂ of just >1 mmHg is sufficient for normal oxidative phosphorylation — below this, metabolism becomes O₂-limited.
III. THE OXYGEN-HAEMOGLOBIN DISSOCIATION CURVE
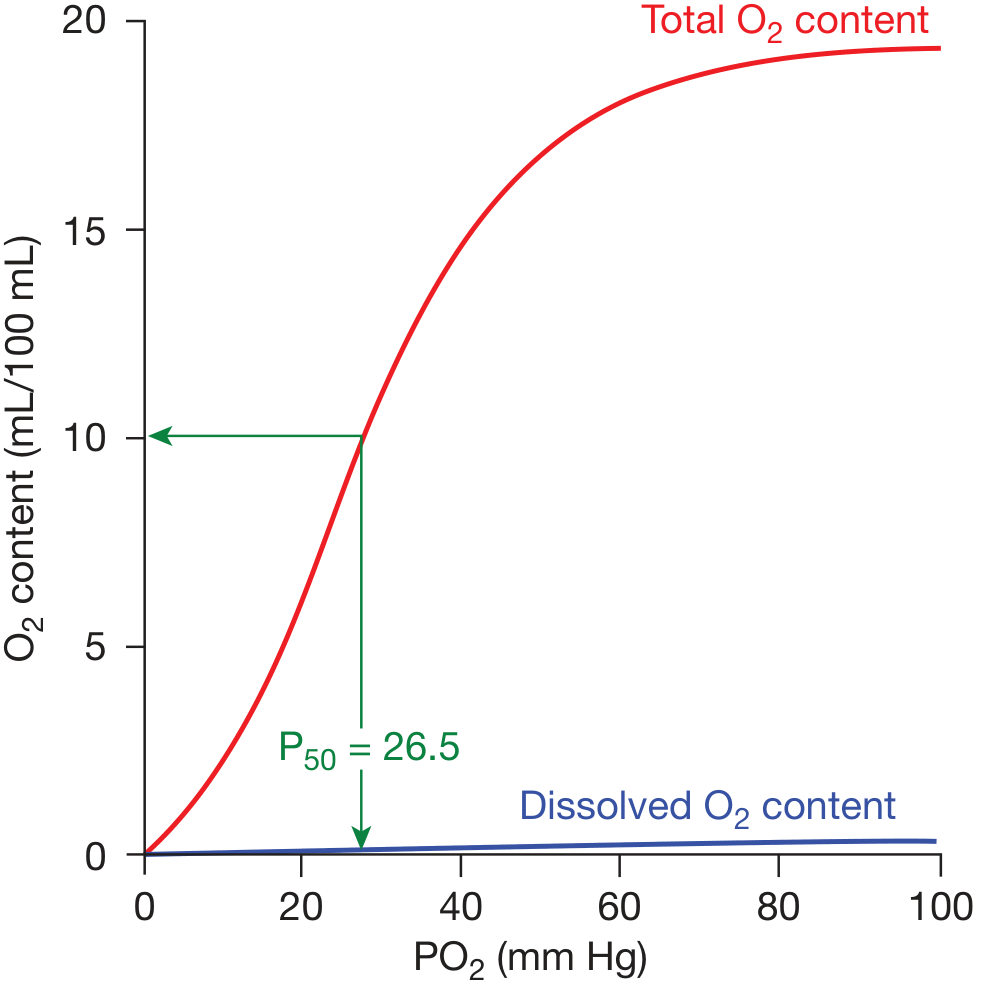
Oxygen dissociation curve — Fishman's Pulmonary Diseases
Key Features of the Sigmoid Curve
| Parameter | Value |
|---|---|
| P50 (PO₂ at 50% Hb saturation) | 26.5 mmHg (standard conditions) |
| Hb saturation at arterial PO₂ (95 mmHg) | 97% |
| Hb saturation at venous PO₂ (40 mmHg) | 75% |
| O₂ unloaded per 100 mL blood at rest | ~5 mL (arteriovenous difference) |
| Maximum O₂ carrying capacity | ~20 mL/100 mL blood |
Physiological Significance of the Sigmoid Shape
-
Upper flat portion (PO₂ 60–100 mmHg): Hb remains ~90–97% saturated despite large drops in alveolar PO₂ — protective against hypoxia at altitude or in lung disease. This is why patients maintain near-normal SaO₂ until PO₂ falls below ~60 mmHg.
-
Steep middle portion (PO₂ 20–60 mmHg): Small drops in PO₂ cause large O₂ release — ideal for unloading O₂ at the tissue level where PO₂ is 40 mmHg.
-
Cooperative binding (quaternary structure): Deoxygenated Hb (T-state, tense) has low affinity; as O₂ binds, Hb shifts to R-state (relaxed), increasing affinity for subsequent O₂ — produces the positive cooperativity reflected in the sigmoid shape.
IV. FACTORS SHIFTING THE DISSOCIATION CURVE
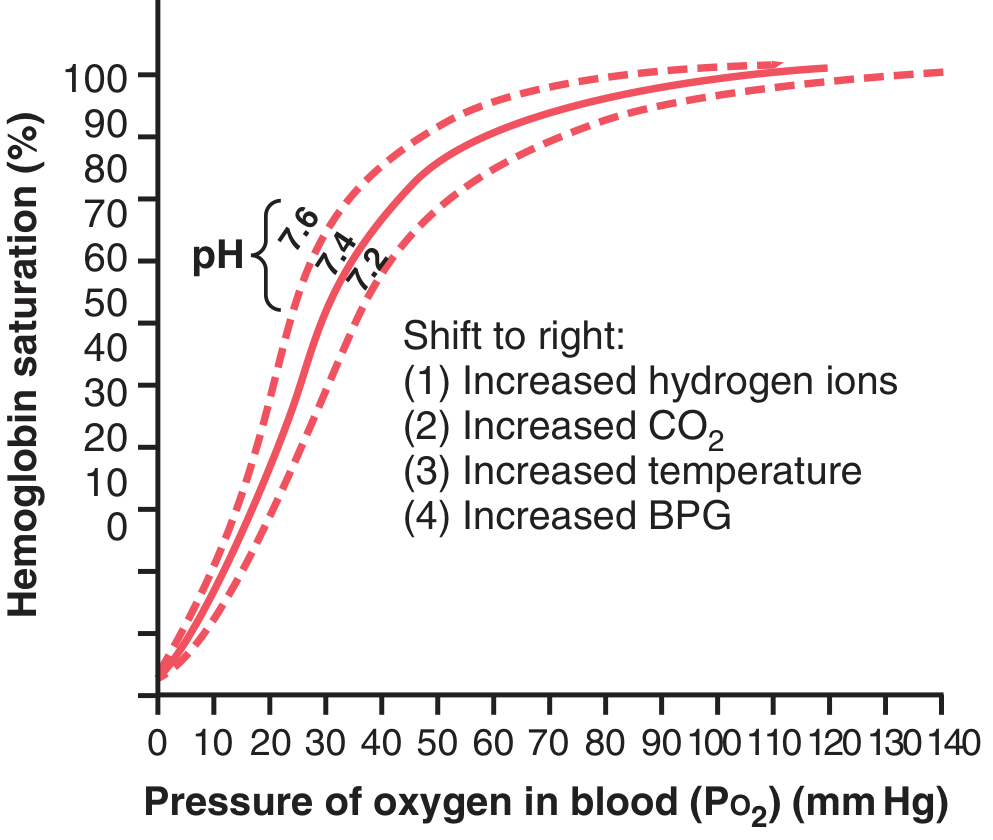
Shifts of the O₂-Hb dissociation curve — Guyton & Hall
Right Shift (↑P50 = decreased affinity = more O₂ unloaded to tissues)
| Factor | Mechanism |
|---|---|
| ↑ H⁺ (↓pH) | Bohr effect: H⁺ binds Hb β-chains, stabilising T-state |
| ↑ PCO₂ | Directly + via H⁺ (Bohr effect) |
| ↑ Temperature | Thermal destabilisation of Hb-O₂ bond |
| ↑ 2,3-BPG (2,3-Bisphosphoglycerate) | Binds deoxyHb, stabilises T-state; shifts curve right |
Mnemonic: CADET face RIGHT — CO₂, Acid, DPG/BPG, Exercise, Temperature
Left Shift (↓P50 = increased affinity = less O₂ released)
| Factor |
|---|
| ↓ H⁺ (↑pH) |
| ↓ PCO₂ |
| ↓ Temperature |
| ↓ 2,3-BPG |
| Fetal Hb (HbF) — γ-chains bind BPG less → left shift → extracts O₂ from maternal blood |
| CO poisoning — carboxyHb shifts remaining curve left (double penalty) |
| MetHaemoglobinaemia |
V. ROLE OF 2,3-BISPHOSPHOGLYCERATE (2,3-BPG)
- Produced in RBCs via the Rapoport-Luebering shunt of glycolysis.
- Normal BPG maintains a tonic rightward shift of the ODC, facilitating O₂ delivery.
- In chronic hypoxia (altitude, anaemia, cardiorespiratory disease), BPG levels rise within hours, shifting the curve further right — this is a key adaptive mechanism allowing O₂ release at up to 10 mmHg higher tissue PO₂ than without BPG.
- Stored blood (bank blood) loses BPG → curve shifts left → O₂ not readily released to tissues (corrected within ~24 hours of transfusion).
VI. THE BOHR EFFECT
- In metabolically active tissues: CO₂ and H⁺ are produced → local acidosis → right shift → Hb releases more O₂ exactly where needed.
- In pulmonary capillaries: CO₂ is lost to alveoli → local pH rises → left shift → Hb picks up more O₂.
- This tissue-specific modulation of Hb affinity is the Bohr effect — a self-regulating, demand-driven O₂ delivery mechanism.
VII. O₂ DELIVERY AND UTILISATION
O₂ Delivery (DO₂) = Cardiac Output × O₂ Content of arterial blood
O₂ Content (CaO₂) = (1.34 × Hb × SaO₂) + (0.003 × PaO₂)
- 1.34 mL O₂ is bound per gram of fully saturated Hb.
- At rest: DO₂ = 5 L/min × 20 mL/dL = ~1000 mL O₂/min
- Resting consumption (VO₂) = ~250 mL/min
- O₂ extraction ratio = VO₂/DO₂ = ~25% at rest (can rise to ~75% during maximal exercise)
Effect on tissue O₂ usage:
- Intracellular PO₂ only needs to exceed ~1 mmHg for normal mitochondrial function; O₂ usage is primarily controlled by ADP concentration (energy demand), not O₂ availability under normal circumstances.
- Cells ≤50 µm from capillaries receive adequate O₂ by diffusion; greater distances lead to diffusion-limited O₂ delivery.
VIII. CLINICAL CORRELATIONS
| Condition | Effect on ODC/O₂ transport |
|---|---|
| Anaemia | ↓ Hb → ↓ O₂ content; compensatory tachycardia, ↑ BPG (right shift) |
| CO poisoning | COHb reduces capacity + left shifts curve → critical O₂ deficit |
| High altitude | Hypoxia → ↑ BPG → right shift; also stimulates erythropoiesis |
| Alkalosis | Left shift → ↓ O₂ release (e.g., over-ventilation in ICU) |
| HbF (neonates) | Left shift → extracts O₂ from maternal Hb |
| Stored blood transfusion | ↓ BPG → transient left shift; reverses in 24 h |
| Methaemoglobinaemia | Fe³⁺ cannot bind O₂; left shifts functional Hb; treat with methylene blue |
Summary Table
| Key Value | Figure |
|---|---|
| Alveolar PO₂ | 104 mmHg |
| Arterial PO₂ | 95 mmHg |
| Venous PO₂ | 40 mmHg |
| Tissue PO₂ | ~40 mmHg |
| Critical intracellular PO₂ | ~1 mmHg |
| P50 (normal) | 26.5 mmHg |
| Arterial O₂ saturation | 97% |
| Mixed venous O₂ saturation | 75% |
| O₂ capacity of blood | ~20 mL/100 mL |
| O₂ dissolved at 100 mmHg | ~0.3 mL/100 mL |
Sources: Guyton and Hall Textbook of Medical Physiology (Guyton & Hall); Fishman's Pulmonary Diseases and Disorders, Chapter 15 — Blood Gas Transport
This is a shared conversation. Sign in to Orris to start your own chat.