
ECG
I'll start by reading the medical library skill, then search for ECG content.
Reading File
The query "ECG" is broad - it could mean interpretation basics, specific findings, arrhythmias, or something else. Let me clarify before diving in.
Asking for Preferences
What aspect of ECG are you looking for?
Finding Sources
Good. Now let me read the main ECG sections in parallel - Costanzo Physiology (basics), Braunwald's (cardiology), and search for arrhythmias/ischemia headings.
Reading File
Reading File
Finding Sources
Good. Now let me read more from Costanzo (axis, leads) and search for arrhythmias + ischemia headings in parallel.
Reading File
Finding Sources
Finding Sources
Finding Sources
Finding Sources
Reading File
Let me search more specifically for ECG-related content in major cardiology textbooks.
Finding Sources
Finding Sources
Finding Sources
Finding Sources
I found the Goldman-Cecil ECG section. Let me read it along with the Costanzo ECG image and the Tintinalli ECG section.
Reading File
Loading Image
Excellent - I have rich content from Goldman-Cecil and Costanzo. Let me also read more Goldman-Cecil content (leads, axis, abnormalities) and fetch the Goldman-Cecil ECG diagram.
Reading File
Loading Image
I have very rich content now from Goldman-Cecil including intervals table, lead descriptions, axis, and abnormalities. Let me read more of this section covering leads, axis, and abnormalities.
Reading File
I now have comprehensive content. Let me fetch the normal ECG image from Goldman-Cecil and read a bit more about ischemia/hypertrophy patterns.
Loading Image
Reading File
I now have comprehensive ECG content. Let me also read the section covering leads, axis, hypertrophy, and ischemia patterns from the Goldman-Cecil text that was truncated.
Reading File
I now have comprehensive content. Let me mark todos and compile the full overview.Here is a full overview of ECG - from basics through clinical interpretation.
Electrocardiogram (ECG) - Full Overview
What is an ECG?
The ECG (or EKG) measures tiny potential differences on the body surface that reflect the electrical activity of the heart. These voltages are detectable because depolarization and repolarization of the myocardium do not occur simultaneously - the atria depolarize before the ventricles, and both depolarize and repolarize in a specific sequence, creating potential differences that can be sensed by surface electrodes.
A standard ECG records 10 seconds of cardiac activity at 25 mm/sec on calibrated paper where:
- Horizontal axis: time - each small box (1 mm) = 0.04 sec; each big box (5 mm) = 0.2 sec
- Vertical axis: voltage - 10 mm = 1 mV (standard calibration)
The Normal ECG Waveform

Waves, Segments, and Intervals
| Component | What it represents | Normal value |
|---|---|---|
| P wave | Atrial depolarization | Duration < 0.12 sec |
| PR interval | Onset of atrial depolarization to onset of ventricular depolarization; includes AV nodal conduction | 0.09-0.20 sec (90-200 ms) |
| QRS complex | Ventricular depolarization | 0.075-0.11 sec (75-110 ms) |
| ST segment | Isoelectric plateau between ventricular depolarization and repolarization | Isoelectric (flat) |
| T wave | Ventricular repolarization | Upright and concordant with QRS in most leads |
| QT interval | Onset of QRS to end of T wave (full ventricular electrical activity) | QTc males: 390-450 ms; females: 390-460 ms |
| J point | Junction between end of QRS and beginning of ST segment | - |
Key notes:
- Atrial repolarization is not visible - it is buried under the QRS complex
- Capital letters (Q, R, S) = amplitude ≥5 mm; lowercase (q, r, s) = amplitude <5 mm
- The PR interval = time through atrial muscle + AV node + His-Purkinje system
- Sympathetic stimulation shortens PR (speeds AV conduction); parasympathetic lengthens it
- The QT interval must be corrected for heart rate using Bazett's formula: QTc = QT / √RR
Heart Rate Calculation
Heart rate (bpm) = 60,000 / RR interval (msec)
On a standard 10-second ECG: HR = number of QRS complexes × 6
Normal resting adult HR: 50-100 bpm (physiologically, 50-90 may be more accurate).
The 12-Lead System
The standard ECG uses 12 leads viewing the heart from different angles:
Limb Leads (frontal plane)
| Lead | View |
|---|---|
| I | Left lateral (0°) |
| II | Inferior/left (60°) |
| III | Inferior/right (120°) |
| aVR | Right shoulder (-150°) |
| aVL | Left shoulder (-30°) |
| aVF | Inferior (90°) |
Precordial (Chest) Leads (horizontal plane)
| Lead | Position | View |
|---|---|---|
| V1 | 4th ICS, right sternal border | Septal |
| V2 | 4th ICS, left sternal border | Septal/anterior |
| V3 | Between V2 and V4 | Anterior |
| V4 | 5th ICS, midclavicular line | Anterior |
| V5 | Anterior axillary line | Lateral |
| V6 | Mid-axillary line | Lateral |
Regional groupings for interpretation:
- Septal: V3, V4
- Anterior: V2, V3, V4
- Lateral: I, aVL, V5, V6
- Inferior: II, III, aVF
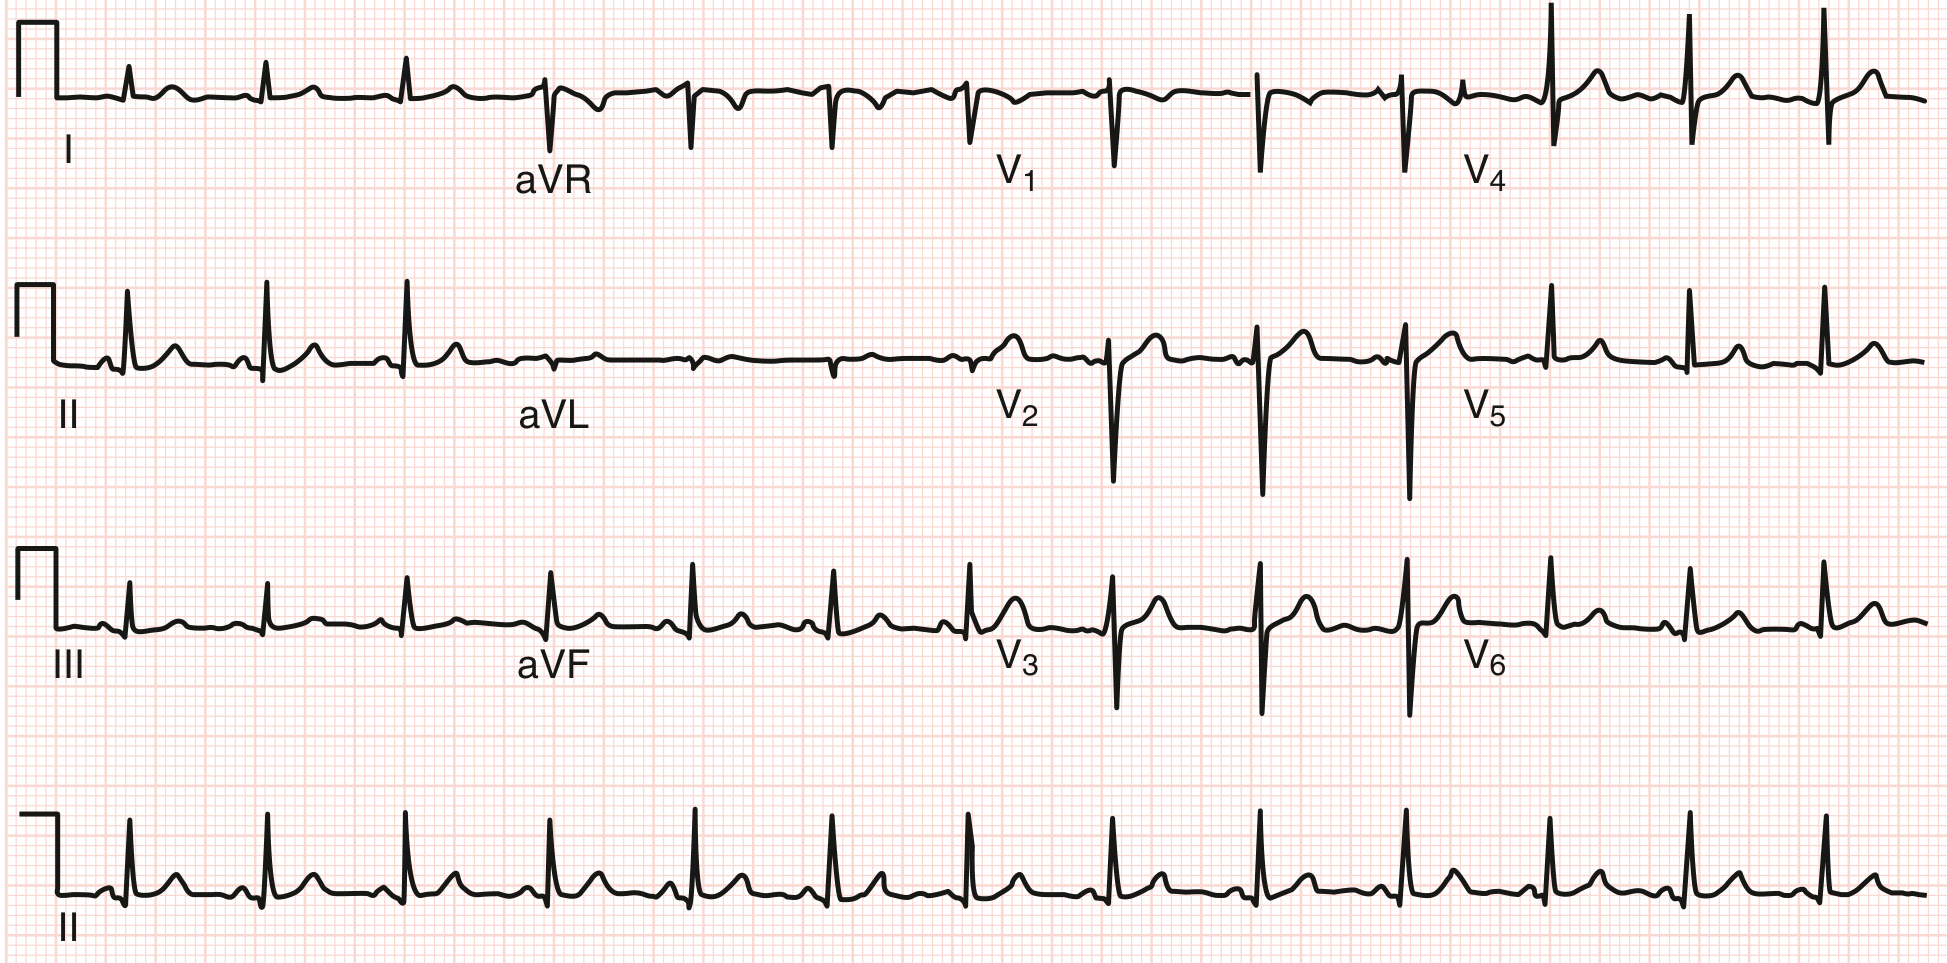
Normal 12-Lead ECG
QRS Axis
The QRS axis reflects the net direction of ventricular depolarization in the frontal plane.
| Axis | Degrees |
|---|---|
| Normal | -30° to +90° |
| Left axis deviation (LAD) | < -30° |
| Right axis deviation (RAD) | > +90° |
| Extreme RAD | > +180° |
Quick method: Find the lead where QRS is most isoelectric (nearly flat) - the axis is perpendicular to that lead. Confirm positivity or negativity in a neighboring lead to determine direction.
Causes of LAD: Left anterior fascicular block, inferior MI, LBBB, Wolff-Parkinson-White, hyperkalemia
Causes of RAD: Right ventricular hypertrophy, left posterior fascicular block, lateral MI, RBBB, normal in young/tall individuals
A Systematic Approach to ECG Interpretation
A recommended stepwise approach (Goldman-Cecil Medicine):
- Determine heart rate and rhythm
- Measure PR, QRS, and QT intervals
- Estimate QRS axis
- Examine P wave morphology, duration, and axis
- Examine QRS progression and transition in precordial leads
- Examine QRS complexes in regional groupings (septal, anterior, lateral, inferior)
- Examine ST segments in regional groupings
- Examine T waves in regional groupings
Conduction Abnormalities
AV Blocks
| Type | PR interval | Features |
|---|---|---|
| 1st-degree AV block | > 200 ms | Every P conducts, fixed PR prolongation |
| 2nd-degree Mobitz I (Wenckebach) | Progressively lengthens | PR lengthens until a beat is dropped; then resets |
| 2nd-degree Mobitz II | Fixed PR | Sudden non-conducted P wave without prior PR prolongation |
| 3rd-degree (complete) | AV dissociation | P waves and QRS completely independent; escape rhythm |
1st-degree AV block and Mobitz I (Wenckebach) are generally benign findings, even in athletes.
Bundle Branch Blocks
| Finding | RBBB | LBBB |
|---|---|---|
| QRS duration | ≥ 120 ms | ≥ 120 ms |
| Key morphology | RSR' ("rabbit ears") in V1; wide S in I, V6 | Broad, notched R in I, aVL, V5-6; QS in V1 |
| Clinical significance | Generally not associated with increased risk (though one study showed ~30% increase in CV mortality) | 2× higher risk for cardiovascular event/death - should prompt cardiac evaluation |
Fascicular blocks (LAFB, LPFB) cause axis deviation without prolonging QRS beyond 120 ms.
Interventricular conduction delay: QRS > 110 ms but not meeting full BBB criteria.
Ventricular Hypertrophy
Left Ventricular Hypertrophy (LVH)
- Increased voltage in precordial leads (e.g., S in V1 + R in V5/V6 > 35 mm by Sokolow-Lyon criteria)
- Left axis deviation, left atrial enlargement
- ST-T changes ("strain pattern") - ST depression and T-wave inversion in lateral leads
- Note: Isolated voltage criteria without repolarization changes can be a normal variant in athletes
Right Ventricular Hypertrophy (RVH)
- Right axis deviation
- Dominant R wave in V1, deep S in V5-6
- ST-T changes in right precordial leads
ECG in Ischemia and MI
ECG changes in coronary artery disease evolve over time:
| Stage | ECG Finding | Significance |
|---|---|---|
| Hyperacute ischemia | Tall, peaked (hyperacute) T waves | Very early ischemia |
| Acute injury (STEMI) | ST elevation in regional leads | Acute transmural MI - emergency reperfusion |
| Reciprocal changes | ST depression in leads opposite to infarct | Supports STEMI diagnosis |
| Evolving MI | T-wave inversion | Ischemia/repolarization abnormality |
| Old/established MI | Pathological Q waves | Prior full-thickness infarction |
Localization of MI by leads
| Territory | Leads showing changes | Culprit artery |
|---|---|---|
| Anterior | V1-V4 | LAD |
| Lateral | I, aVL, V5, V6 | LCx |
| Inferior | II, III, aVF | RCA (or LCx) |
| Posterior | Tall R in V1-V2 (reciprocal) | RCA or LCx |
| Septal | V1-V2 | LAD (septal branch) |
Pathological Q waves: Q wave ≥ 40 ms wide OR depth ≥ 25% of R wave height in the same lead - indicates prior transmural infarction (though small q waves in V5-6 and inferior leads can be normal).
Common Arrhythmias and Their ECG Features
Sinus Rhythms
- Normal sinus rhythm (NSR): Regular P before each QRS, P axis normal, rate 50-100 bpm
- Sinus bradycardia: Rate < 50 bpm, otherwise normal morphology
- Sinus tachycardia: Rate > 100 bpm, regular, P before each QRS
- Sinus arrhythmia: Rate variation with respiration - normal variant (common in athletes and young people)
Atrial Arrhythmias
| Arrhythmia | ECG features |
|---|---|
| Atrial fibrillation (AFib) | Absent P waves, irregularly irregular rhythm, fibrillatory baseline |
| Atrial flutter | Sawtooth flutter waves at ~300 bpm (best seen in II, III, aVF); typically 2:1 or 4:1 block giving ventricular rate ~150 or 75 bpm |
| Atrial tachycardia | Regular P waves with abnormal morphology, rate 150-250 bpm |
| Junctional rhythm | Narrow QRS, absent or retrograde P waves (before or after QRS) |
Ventricular Arrhythmias
| Arrhythmia | ECG features |
|---|---|
| PVC (premature ventricular complex) | Widened QRS (≥120 ms), no preceding P wave, T wave opposite to QRS direction, compensatory pause |
| Ventricular tachycardia (VT) | Wide complex tachycardia (≥120 ms), rate > 100 bpm; AV dissociation, fusion beats, capture beats confirm VT |
| Ventricular fibrillation (VF) | Chaotic, irregular, no identifiable QRS complexes |
| Torsades de pointes | Polymorphic VT with twisting QRS axis; associated with prolonged QTc |
Pre-excitation: Wolff-Parkinson-White (WPW)
- Short PR interval (< 120 ms) due to ventricular pre-excitation via accessory pathway
- Delta wave: Slurred upstroke at start of QRS (fusion beat)
- Wide QRS (> 110-120 ms)
- Risk of very rapid conduction in AFib → ventricular fibrillation
ECG in Common Metabolic/Electrolyte Disorders
| Condition | ECG changes |
|---|---|
| Hyperkalemia | Peaked (tall, narrow) T waves → PR prolongation → P wave flattening → QRS widening → sine wave pattern → VF |
| Hypokalemia | ST depression, flattened T waves, prominent U waves, prolonged QU interval, QRS widening |
| Hypercalcemia | Shortened QT interval; may see J waves (Osborn waves) |
| Hypothermia | Osborn (J) waves (positive deflection at J point), sinus bradycardia, QT prolongation - most prominent in V1-V3 |
Long QT Syndrome
Acquired causes (most common): Medications (antiarrhythmics, antipsychotics, antibiotics), electrolyte abnormalities, ischemia, hypothyroidism
Congenital (channelopathies): Romano-Ward syndrome (KCNQ1, KCNH2, SCN5A mutations)
Risk: QTc > 500 ms significantly increases risk of Torsades de pointes and sudden cardiac death
ECG in Special Situations
Athletes
Common benign findings in well-trained athletes:
- Sinus bradycardia, sinus arrhythmia, wandering atrial rhythm
- 1st-degree AV block, Mobitz I (Wenckebach)
- Incomplete RBBB
- Isolated LVH voltage criteria
- Early repolarization pattern (ST elevation, usually concave up, in lateral leads)
These reflect vagal tone and cardiac remodeling - not disease.
COVID-19
Reported ECG changes include: sinus tachycardia, new AFib, QT prolongation, ST-T wave changes, and ventricular arrhythmias - related to fever, hypoxia, myocarditis, and drug effects.
Computerized ECG Interpretation
- Automated algorithms are accurate for heart rate, axis, intervals, and STEMI detection (~93% sensitivity, ~99% specificity for STEMI)
- AI systems are increasingly better than cardiologists at detecting LVH, predicting AFib risk, and identifying cardiomyopathy
- Physician over-reading is mandatory, especially for rhythm diagnosis, where automated systems are less reliable
Sources: Goldman-Cecil Medicine (International Ed.), Ch. 42 | Costanzo Physiology 7th Ed., Ch. 4 | Braunwald's Heart Disease | Tintinalli's Emergency MedicineThat's the complete ECG overview. Here's a quick navigation guide to what's covered:
What's included above:
- Basics - What an ECG measures, paper speed, calibration
- Waveforms - P, QRS, T, U waves; PR, ST, QT intervals with normal values (table)
- Heart rate calculation - From RR interval
- 12-lead system - All 6 limb + 6 precordial leads, regional groupings
- Systematic interpretation - 8-step approach
- QRS axis - Normal range, LAD/RAD causes, quick estimation method
- Conduction abnormalities - AV blocks (1st, 2nd Mobitz I/II, 3rd-degree), BBB (RBBB, LBBB), fascicular blocks
- Hypertrophy - LVH and RVH criteria
- Ischemia/MI - Hyperacute T waves, STEMI, Q waves; localization table (anterior, lateral, inferior, posterior)
- Arrhythmias - AFib, flutter, VT, VF, Torsades, PVCs
- WPW / Pre-excitation - Delta wave, short PR
- Electrolyte effects - Hyperkalemia, hypokalemia, hypercalcemia, hypothermia
- Long QT - Acquired vs congenital, risk thresholds
- Special situations - Athletes, COVID-19
- Automated/AI interpretation - Capabilities and limitations
Let me know if you want to go deeper on any specific area - arrhythmia algorithms, STEMI mimics, drug-induced QT prolongation, or anything else.
This is a shared conversation. Sign in to Orris to start your own chat.