
Electroencephalogram
electroencephalogram EEG normal brain waves recording
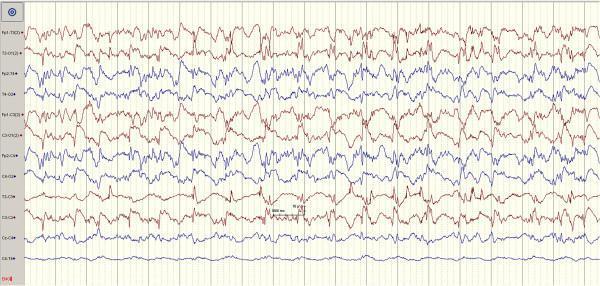
This diagnostic image displays a 12-channel electroencephalogram (EEG) recording showing significant pathological brain activity. The recording utilizes a longitudinal bipolar montage with labels including Fp1-T3, T3-O1, Fp2-T4, T4-O2, Fp1-C3, C3-O1, Fp2-C4, C4-O2, T3-C3, C3-Cz, Cz-C4, and C4-T4. The waveforms are organized in alternating red and blue traces against a vertical grid representing time intervals. The visual findings are characterized by high-amplitude, generalized discharges including frequent spikes, sharp waves, and irregular slow-wave complexes. There is a notable lack of normal background synchronicity, with chaotic and paroxysmal activity present across all frontal, temporal, and central derivations. These features are clinically indicative of generalized seizure activity (ictal state). The tracing demonstrates high-voltage electrical instability and rhythmic discharges consistent with a drug-induced or spontaneous epileptiform event. The image serves as an educational tool for identifying disorganized EEG patterns, spike-and-wave morphology, and the electrographic manifestation of generalized seizures in a neurodiagnostic context.
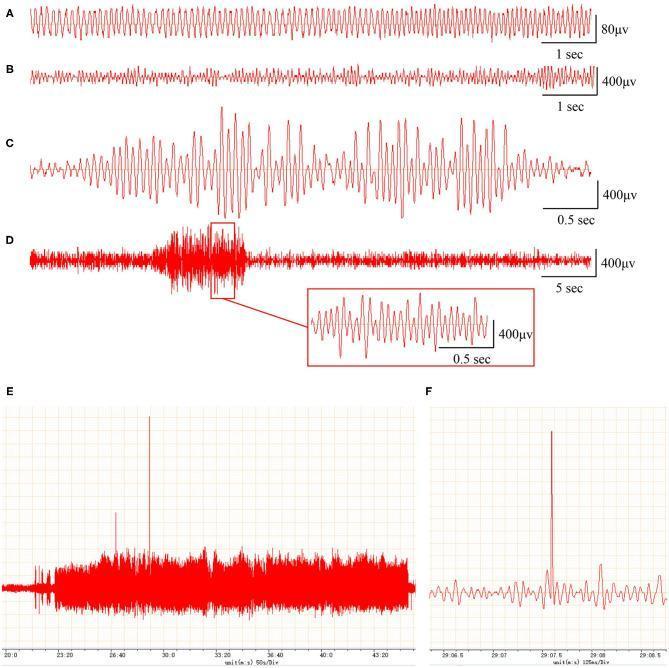
This diagnostic figure displays representative electroencephalogram (EEG) recordings demonstrating various epileptiform discharges in a model of post-traumatic epilepsy (PTE). Panel A shows a baseline normal EEG tracing characterized by regular oscillations with an amplitude of 80μV. Panels B through F illustrate diverse pathological waveforms associated with PTE: (B) multiple sharp-wave polyspikes with a 400μV amplitude; (C) two- and three-phase sharp waves on a 0.5-second timescale; (D) a 10-second window of continuous abnormal discharges with an inset providing an enlarged view of individual high-amplitude spikes (400μV); (E) a 20-minute recording showing explosive, sustained abnormal activity with occasional high-amplitude spikes exceeding the background; and (F) a singular, sudden high-amplitude spike against a quieter baseline. These recordings highlight the progression from normal brain activity to distinct ictal and interictal patterns, including increased amplitude (up to 1,000μV) and altered frequency characteristic of epileptic seizures. The imagery serves as a comparison chart for identifying specific neurological markers in epilepsy research and clinical neurophysiology.
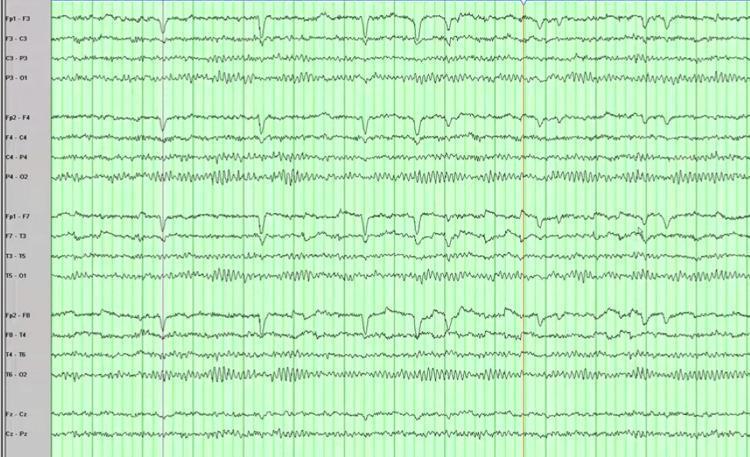
This diagnostic image shows a standard scalp electroencephalogram (EEG) recording from a human subject. The tracing is organized into multiple horizontal channels, with electrode derivations labeled on the left side of the display (e.g., Fp1-F3, F3-C3, C3-P3, P3-O1), representing the 10-20 system in a longitudinal bipolar montage. The recording displays continuous electrical activity of the brain, characterized primarily by high-frequency waves of 8 Hz and higher, consistent with alpha and beta rhythms. The wave morphology is relatively symmetric and regular across the hemispheres, without evident epileptiform discharges, focal slowing, or lateralized periodic discharges. Vertical green grid lines provide a temporal scale for frequency analysis, while vertical deflections in frontal channels (Fp1, Fp2) likely represent physiological artifacts such as eye blinks. This tracing is identified as a normal EEG in the context of a patient presenting with metabolic-induced seizures, serving as an educational example of how systemic conditions like hypoglycemia from an insulinoma can mimic primary epilepsy despite a normal interictal EEG.
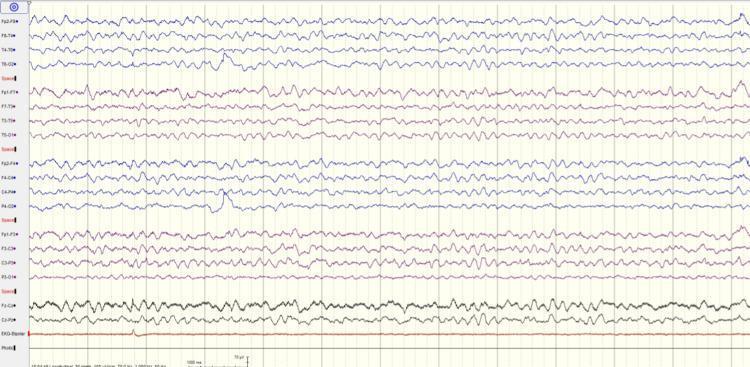
This diagnostic image shows a multi-channel electroencephalogram (EEG) recording, utilized in clinical neurology for assessing brain electrical activity. The tracing demonstrates a bipolar montage across frontal, temporal, parietal, and occipital derivations. A prominent finding is a generalized, rhythmic theta-frequency background of approximately 6 Hz, particularly visible in the posterior channels. This slowing of the normal alpha rhythm represents moderate diffuse encephalopathy, a common finding in metabolic, toxic, or infectious central nervous system disorders. The waveforms are generally sinusoidal but show some irregularity in amplitude and frequency, indicating synchronization across different cortical regions. Critically, there is an absence of epileptiform activity such as spikes, sharp waves, or pleomorphic discharges. A bottom channel labeled as EKG is included for artifact identification, showing relatively flat activity with minimal cardiac signal interference. This EEG is characteristic of an encephalopathic state where basic brain function is altered without focal neurological deficits or active seizure activity.
electroencephalogram EEG overview clinical uses brain waves 2025
Electroencephalogram (EEG)
Definition and Historical Background
- Adams and Victor's Principles of Neurology, 12th Ed.
Technical Setup
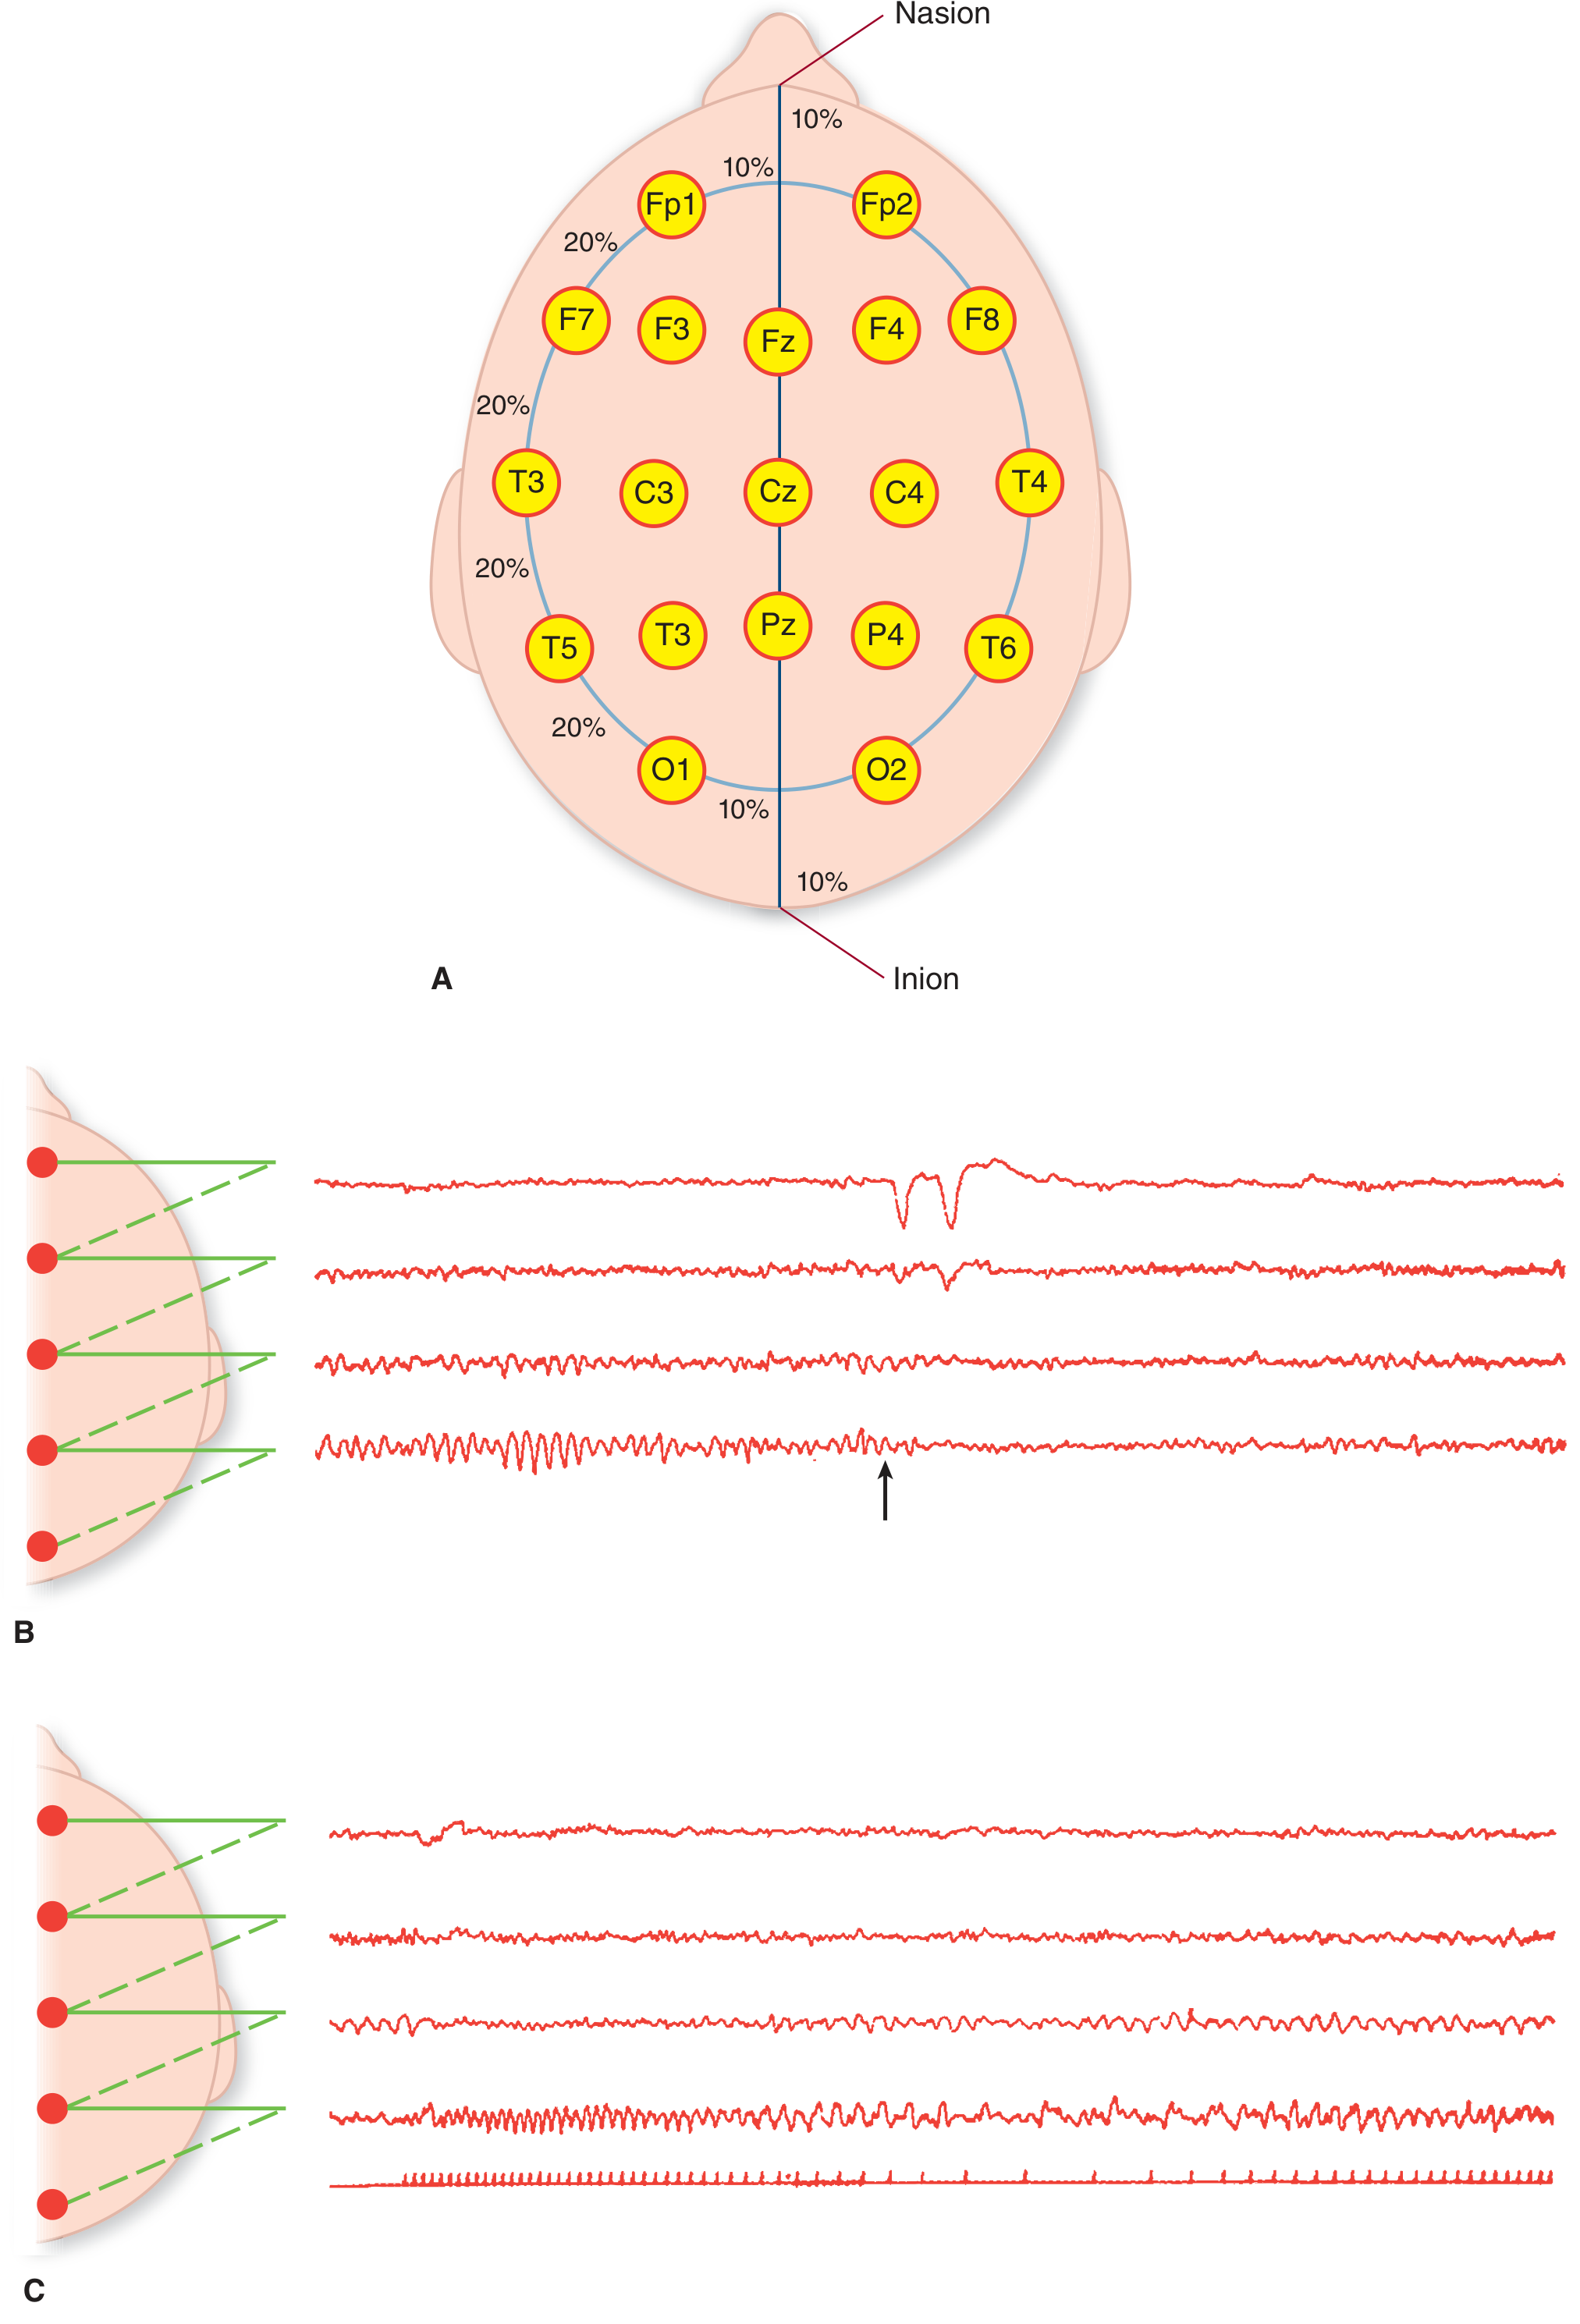
- Adams and Victor's Principles of Neurology, 12th Ed., p. 40-41
EEG Frequency Bands
| Band | Frequency | Characteristics |
|---|---|---|
| Delta | < 4 Hz | Deep sleep; pathological if in waking adult |
| Theta | 4-7 Hz | Drowsiness, light sleep; abnormal if dominant in awake adult |
| Alpha | 8-13 Hz | Normal awake, eyes closed; posterior dominant; attenuates with eye opening |
| Beta | > 13 Hz | Normal awake, eyes open; frontal regions; increased by benzodiazepines |
- Goldman-Cecil Medicine, p. 3806; Costanzo Physiology 7th Ed.
Normal EEG Patterns
-
Stage 1 (N1): Alpha waves interspersed with theta waves
-
Stage 2 (N2): Low-frequency waves + sleep spindles (bursts of high-frequency activity) + K complexes (large slow potentials)
-
Stage 3-4 (N3): Delta waves predominate (slow-wave sleep)
-
REM sleep: Desynchronized, low-voltage, high-frequency - resembles the awake EEG ("paradoxical sleep"). Characterized by rapid eye movements, loss of muscle tone, and dreaming.
-
Costanzo Physiology 7th Ed., p. 3517-3523
Activating Procedures
- Hyperventilation - breathing 20x/min for 3 minutes; may activate characteristic seizure patterns
- Photic stimulation - strobe light at 1-20 flashes/second; normal subjects show photic driving (occipital response to each flash); epileptic patients may show a photoparoxysmal response (spike-and-wave activity)
- Sleep deprivation and sleep recording - drowsiness and sleep transitions can reveal hidden abnormalities
- Long-term/ambulatory monitoring - continuous EEG over hours to days, often combined with video (video-EEG) for seizure characterization
Clinical Indications
| Primary Use | Details |
|---|---|
| Epilepsy diagnosis | Most important use; classifies seizure types; EEG positive in ~50% of patients on a single recording, up to 90% with repeated studies and provocative maneuvers |
| Status epilepticus | Including non-convulsive status epilepticus in comatose patients |
| Encephalopathy | Metabolic (hepatic, renal, toxic); earliest change is diffuse theta slowing |
| Brain death | Electrocerebral silence (isoelectric tracing) |
| Coma evaluation | ICU monitoring; prognosis after cardiac arrest |
| Creutzfeldt-Jakob disease | Characteristic pseudo-periodic sharp wave complexes (~1/second) |
| Sleep disorders | Polysomnography |
| Intraoperative monitoring | Cerebral activity monitoring under anesthesia |
| Herpes simplex encephalitis | Periodic lateralized epileptiform discharges (PLEDs) - temporal predominance |
- Adams and Victor's Principles of Neurology; Bradley and Daroff's Neurology in Clinical Practice; Goldman-Cecil Medicine
Note: EEG has been largely supplanted by CT/MRI for localization of structural lesions, but remains irreplaceable for seizure evaluation.
EEG Abnormalities
- Generalized slowing - most metabolic encephalopathies
- Triphasic waves - hepatic, renal, and other metabolic encephalopathies (frontal predominance)
- Focal slowing - large mass lesions (tumor, large stroke); delta waves over the affected area
- Electrocerebral inactivity - neocortical death, hypothermia, drug overdose
-
3-Hz spike-and-wave (augmented by hyperventilation) - childhood absence epilepsy
-
3-4 Hz spike-and-wave in light sleep/photic stimulation - juvenile myoclonic epilepsy
-
Centrotemporal spikes - benign epilepsy with centrotemporal spikes (BECTS)
-
Anterior temporal spikes/sharp waves - mesial temporal lobe epilepsy
-
Periodic lateralized epileptiform discharges (PLEDs) - stroke, herpes simplex encephalitis
-
Generalized periodic sharp waves - Creutzfeldt-Jakob disease
-
Burst suppression - severe anoxic brain injury, barbiturate coma
-
Goldman-Cecil Medicine, Table 366-5
Sensitivity and Specificity
-
A single EEG is positive in only ~50% of patients with seizures
-
Repeated EEGs with provocative maneuvers raise sensitivity to ~90%
-
About 1% of normal adults and 3.5% of normal children have pseudo-epileptiform activity without ever having a seizure (specificity limitation)
-
EEG is neither highly sensitive nor fully specific (range cited: 78-98%)
-
Goldman-Cecil Medicine, p. 3806
Preparations for EEG
- Patient should not be sedated (sedatives alter the recording)
- Should not be hypoglycemic (relative hypoglycemia modifies normal patterns)
- Avoid caffeine if a sleep study is planned
- For epilepsy patients, anti-epileptic medications are generally continued during routine EEG; they may be weaned during inpatient monitoring to increase seizure yield
Sample EEG Images