Guve me all about the , ct coronary angiography, ct calcium scoring
Reading File
Finding Sources
Finding Sources
Reading File
Reading File
Reading File
Reading File
Reading File
Reading File
Reading File
Reading File
Loading Image
Loading Image
Here is a comprehensive overview of both modalities, drawn from Fuster and Hurst's The Heart (15th ed.), Goldman-Cecil Medicine, and The Washington Manual of Medical Therapeutics.
CT Coronary Angiography (CCTA) & CT Calcium Scoring
Part 1: CT Calcium Scoring (CAC)
What It Is
CT Calcium Scoring is a non-contrast CT scan that quantifies calcified atherosclerotic plaque within the coronary arteries. It is a pure risk stratification tool, not a diagnostic test for stenosis.
The Agatston Score
Each coronary lesion's calcium area is multiplied by the maximal CT attenuation value of that lesion, then summed across the entire coronary tree. This gives the Agatston score.
| Agatston Score | Interpretation | Approx. 15-yr Mortality (asymptomatic pts) |
|---|---|---|
| 0 | No detectable calcification | Very low (~3%) |
| 1–99 | Mild | Low–moderate |
| 100–399 | Moderate | Intermediate |
| ≥400 | Severe | High (~28%) |
Scores are age-, sex-, and race-dependent, but predict coronary heart disease events independently of standard risk factors (Framingham score). — Goldman-Cecil Medicine, p. 452
Non-Contrast CT: Example Images
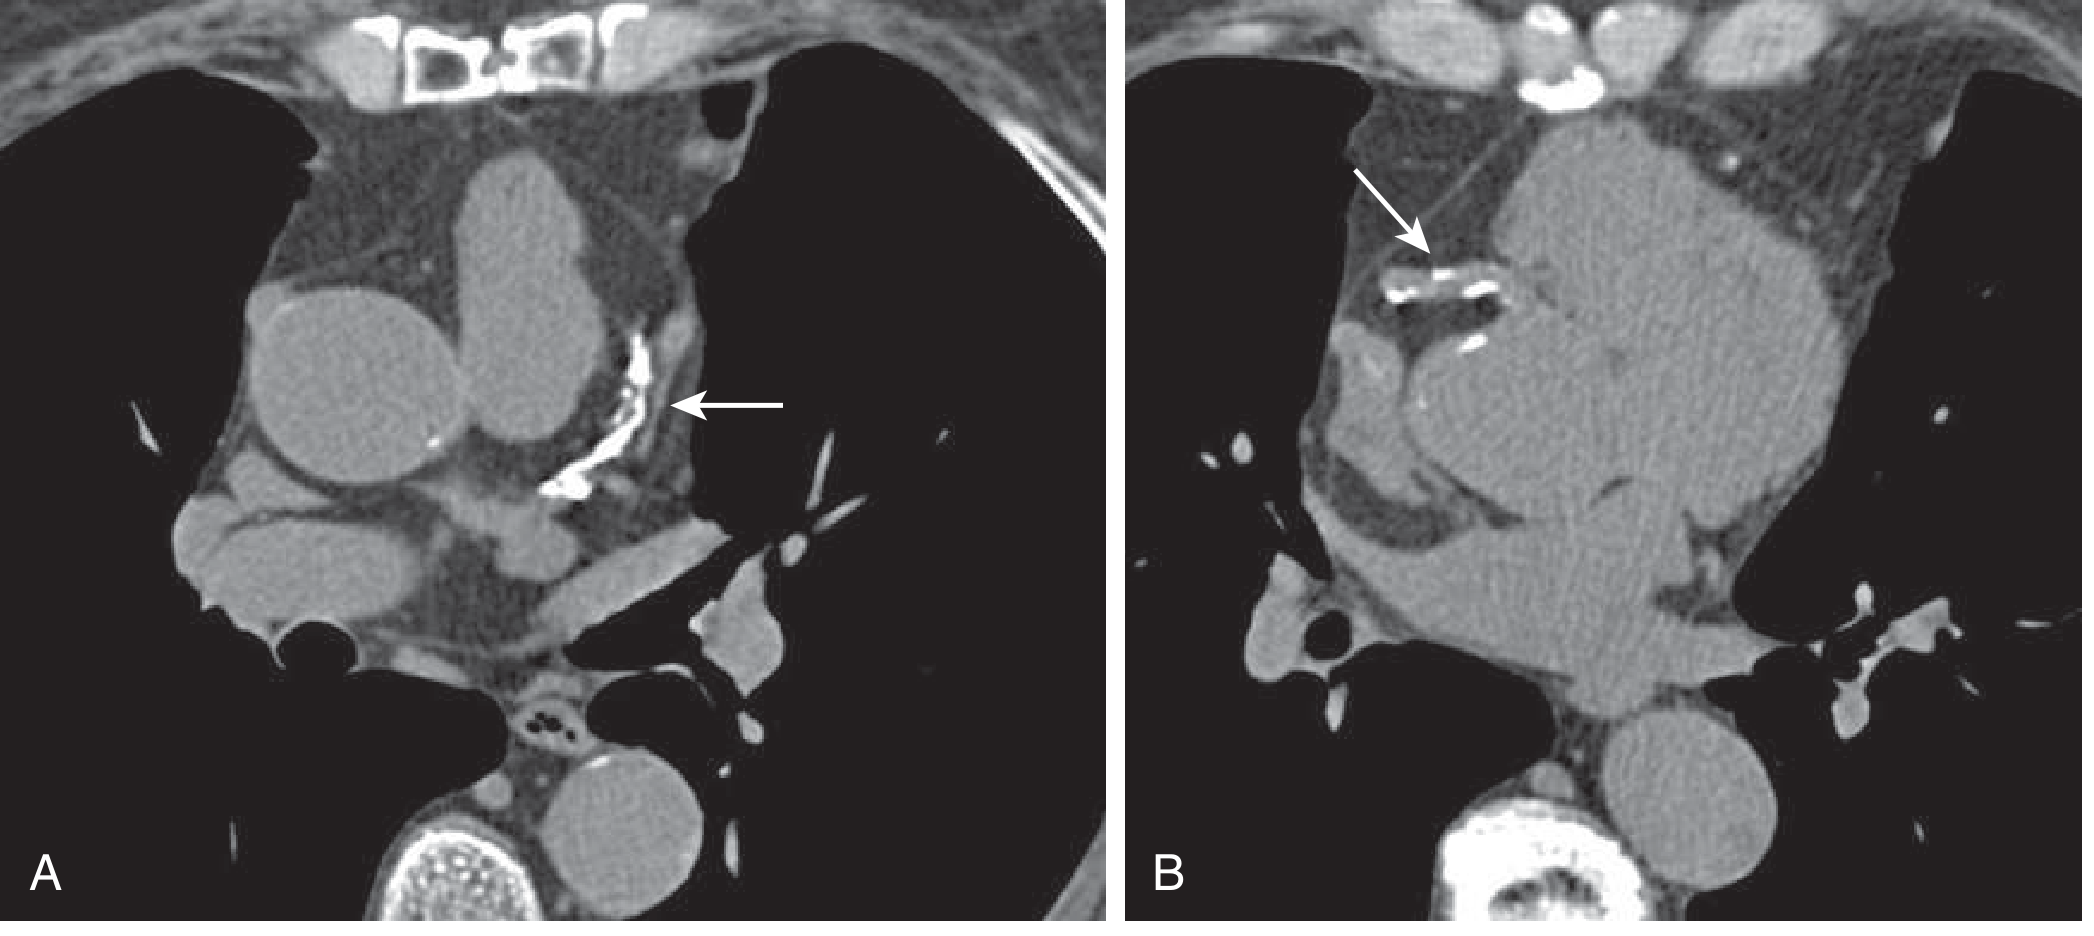
Non-contrast CT axial slices for calcium scoring. A: Proximal LAD with extensive calcification. B: Proximal RCA with spotty calcification. CAC score = 457 — Goldman-Cecil Medicine, p. 452
Clinical Utility
- Most useful in patients at intermediate Framingham risk — can reclassify them upward or downward
- A CAC = 0 confers excellent prognosis; 12-year ASCVD event rate well below the 7.5% threshold for statin recommendation — making it potentially useful to defer statin therapy
- In women, CAC scoring is especially valuable because global risk scores (e.g., Pooled Cohort Equations) may be imprecise; women with multivessel CAC involvement have nearly a 2-fold higher long-term ASCVD mortality than men with similar scores
- Not useful in already low-risk or high-risk patients (rarely changes management), though very high scores may prompt stress testing
Limitations
- No contrast → tells you how much calcium, not how tight a stenosis is
- Does not correlate the local calcium burden with the physiologic significance of any given stenosis
- High scores in elderly patients and CKD patients can paradoxically limit the usefulness of subsequent CCTA
Part 2: CT Coronary Angiography (CCTA / CTA)
What It Is
CCTA is a contrast-enhanced CT study using arterial-phase images to evaluate coronary stenosis, plaque morphology, and coronary anatomy. It is a non-invasive alternative to invasive coronary angiography (ICA).
Acquisition & Technical Requirements
Heart Rate Control
- Coronary arteries exhibit significant translational motion: up to 60 mm/s for the RCA, 20–40 mm/s for the LAD/circumflex
- Image acquisition of <50 milliseconds is required to avoid cardiac motion artifacts
- β-blockers (oral and/or IV) are given pre-scan to:
- Reduce heart rate and prolong diastolic rest period
- Reduce premature atrial/ventricular beats
Coronary Vasodilation
- Sublingual nitroglycerin (tablets or spray) is used to maximally dilate coronary vessels immediately before scanning
Contrast & Timing
- Requires IV iodinated contrast (typically 50–100 mL)
- A test bolus or bolus-tracking technique determines the optimal timing of image acquisition relative to peak aortic enhancement
- The scan is performed during a single breath-hold to eliminate respiratory motion
Image Reconstruction Modalities
- Axial images — standard cross-sectional view
- Multiplanar reformations (MPR) — coronal, sagittal, oblique planes
- Maximum-Intensity Projection (MIP) — displays longer vessel segments; limited by overlapping structures
- Curved MPR — reconstructs the entire vessel in a single plane
- 3D Volume Rendering — assesses anatomic relationships, selects phases with least motion artifact
Temporal resolution ≤50 ms is required; spatial resolution of ICA (gold standard) = 0.2 mm.
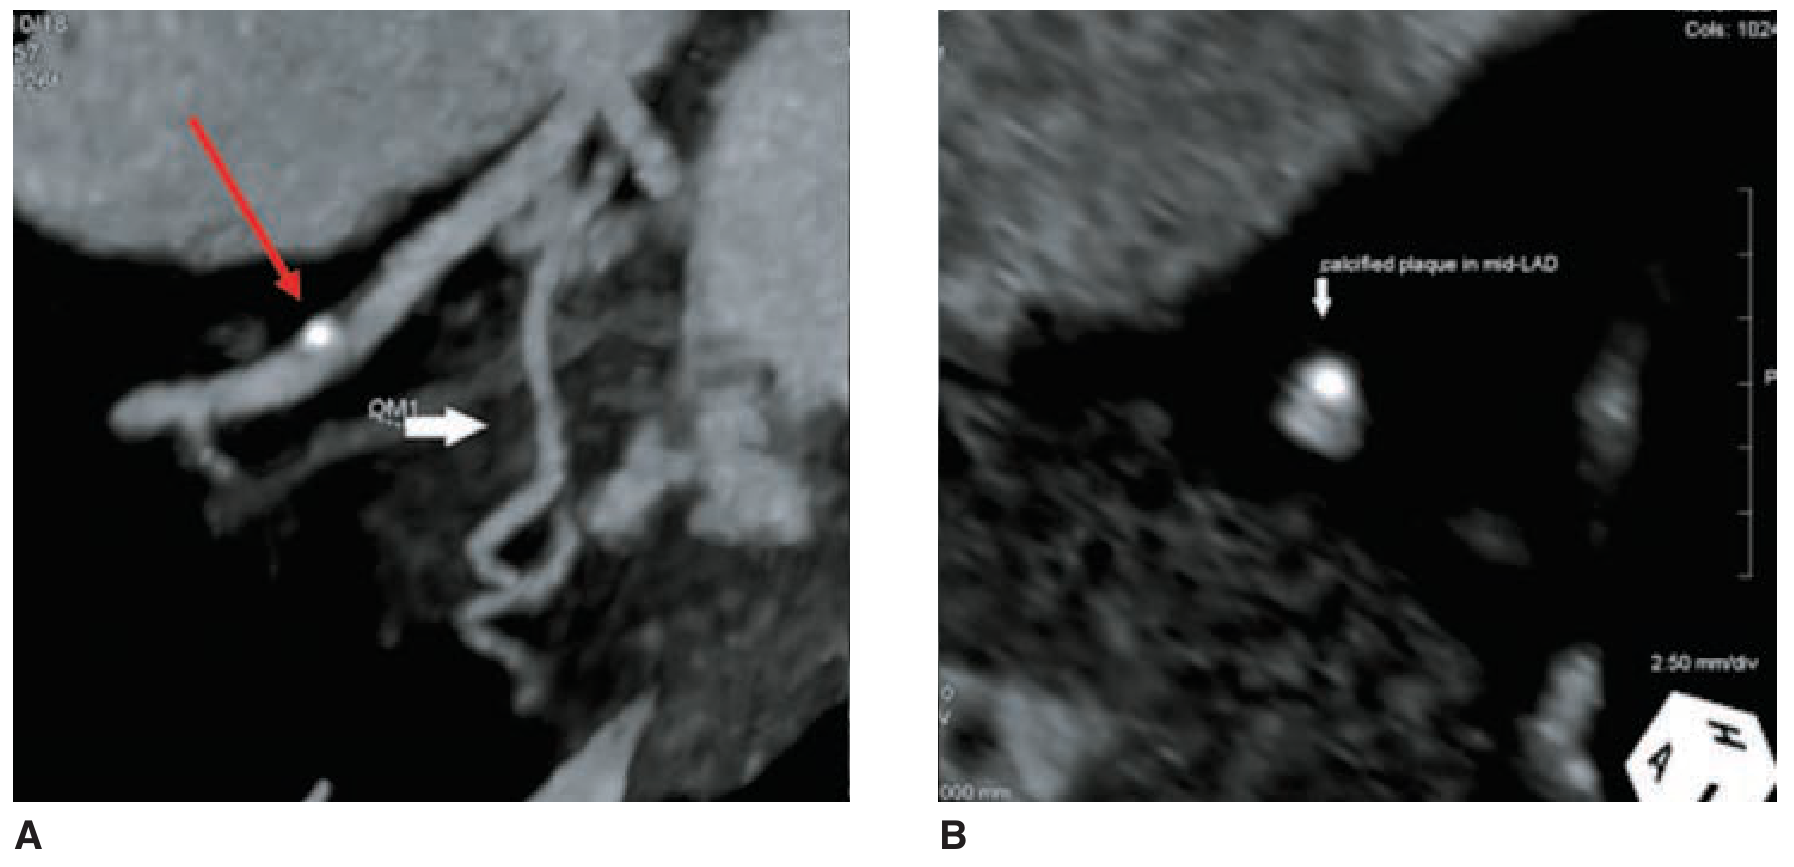
CCTA plaque imaging: Longitudinal MIP (left) showing calcified LAD plaque (red arrow); axial MPR (right) of the same non-obstructive lesion — Fuster & Hurst's The Heart, 15th ed., p. 137
Diagnostic Accuracy
In Acute Coronary Syndromes (ACS)
| Meta-analysis | No. Studies / Patients | Sensitivity | Specificity |
|---|---|---|---|
| 64-slice or fewer | 9 studies, 566 pts | 95% (90–98%) | 90% (87–93%) |
| Broader meta-analysis | 16 studies, 1119 pts | 96% (93–98%) | 92% (89–94%) |
- Absence of any coronary atherosclerosis (seen in ~50% of ACS-suspected patients) has an excellent Negative Predictive Value (NPV)
- Three landmark RCTs (ACRIN-PA, CT-STAT, ROMICAT II) showed CCTA enables safe rapid discharge in ~50% of chest pain patients, vs. 15–25% with standard care
In Stable CAD
- 64-slice MDCT: pooled sensitivity 94–100%, specificity 89–100%, PPV 93–97%, NPV 96–100%
- Outperforms exercise treadmill, stress MRI, stress nuclear imaging, and stress echo for ACS detection accuracy
Key Limitation
- Presence of significant stenosis on CCTA has only moderate PPV for ACS — especially problematic given low prevalence of ACS (2–8%) in ED chest pain populations
- This can be supplemented by assessment of plaque morphology, wall motion abnormalities, CT perfusion (CTP), or CT-FFR
Plaque Characterization — High-Risk Features
CCTA can assess not just stenosis severity but the composition and morphology of coronary plaque:
| High-Risk Feature | CT Appearance | Significance |
|---|---|---|
| Low-attenuation plaque (LAP) | <30 HU | Large necrotic core |
| Positive remodeling (PR) | Vessel enlargement at plaque site | Vulnerable plaque |
| Spotty calcifications (SC) | Small, non-confluent foci | Plaque instability |
| "Napkin ring" sign | Circumferential rim of higher-attenuation noncalcified plaque surrounding lower-attenuation core | Analogous to thin-cap fibroatheroma |
| Perivascular inflammation | Fat stranding around vessel | Active inflammation |
Prognostic data:
- Copresence of LAP + PR → 22.5% chance of ACS at 27-month follow-up
- Absence of these features → 0.5% event rate
- At 10-year follow-up: ACS in 23% with two high-risk features vs. 0.6% with no plaque at all
- "Napkin ring" sign + PR + LAP → 40% event rate at 5 years
High-risk plaque features predict ischemia independent of luminal stenosis degree — Fuster & Hurst, p. 140
CT-FFR (Fractional Flow Reserve by CT)
Where available, proprietary software can calculate intracoronary hemodynamics from the CCTA dataset, providing a non-invasive FFR estimate without the need for adenosine or wire-based pressure measurements. — Washington Manual, p. 124
Clinical Indications (per 2021 AHA/ACC/ASE/CHEST/SAEM/SCCT/SCMR Guideline)
| Indication | Class |
|---|---|
| Intermediate-risk acute chest pain without known CAD, to exclude obstructive CAD | Class I |
| Low pre-test probability symptomatic patients (high NPV) | Preferred |
| Congenital coronary artery anomalies | Excellent technique |
| Equivocal stress test results | Appropriate |
Limitations / Contraindications
| Limitation | Reason |
|---|---|
| Extensive coronary calcification (elderly, advanced CKD) | Blooming artifact obscures lumen; diminished study quality |
| Coronary stents | Metal artifact |
| Small-caliber vessels | Insufficient spatial resolution |
| Irregular heart rhythm / inability to breath-hold | Motion artifacts degrade image quality |
| Contrast allergy / renal insufficiency | Requires IV iodinated contrast |
Key Comparison: CAC Scoring vs. CCTA
| Feature | CAC Scoring | CCTA |
|---|---|---|
| Contrast | None | Required (50–100 mL iodinated) |
| Radiation | Low (~1–3 mSv) | Moderate (~3–10 mSv) |
| Purpose | Risk stratification | Diagnosis of CAD / stenosis |
| Best use | Asymptomatic intermediate-risk patients | Symptomatic low–intermediate pretest probability |
| Output | Agatston score | % stenosis, plaque type, anatomy |
| NPV for CAD | High (score of 0) | Excellent (95–100%) |
| Identifies plaque vulnerability | No | Yes (LAP, PR, napkin ring sign) |
| FFR capability | No | Yes (CT-FFR with software) |
Sources:
- Fuster and Hurst's The Heart, 15th Edition (CCTA Acquisition, Accuracy, Plaque Characterization)
- Goldman-Cecil Medicine, International Edition (Calcium Scoring, CTA)
- The Washington Manual of Medical Therapeutics (Coronary CT Angiography, CT-FFR, AHA/ACC Guideline 2021)
Like if I have to write protocol for these two , and detailed answer
Finding Sources
Finding Sources
Finding Sources
Finding Sources
Finding Sources
The textbooks contain the clinical and technical principles — I'll now synthesize a full protocol document incorporating all the textbook data from the previous session plus established radiological standards.
Scanning Protocols: CT Calcium Scoring & CT Coronary Angiography
PROTOCOL 1: CT Coronary Calcium Scoring (CAC / CACS)
Overview
A non-contrast, ECG-gated CT of the heart to quantify calcified coronary plaque using the Agatston scoring method. Purpose: cardiovascular risk stratification in asymptomatic or intermediate-risk patients.
Pre-Procedure
Patient Selection / Indications
- Asymptomatic patients at intermediate 10-year ASCVD risk (7.5–20% by Pooled Cohort Equations) where statin decision is uncertain
- Patients requesting additional risk information before deciding on preventive therapy
- Women where global risk scores may underestimate true risk
- Not indicated in: known CAD, very low risk (<7.5%), very high risk (>20%), or symptomatic patients (use CCTA instead)
Patient Preparation
| Step | Action |
|---|---|
| Fasting | Not required (no contrast) |
| Medications | Continue all usual medications |
| Caffeine | Restrict for 4 hours pre-scan (reduces ectopic beats) |
| Clothing | Remove metallic objects from chest |
| IV access | Not required |
| Heart rate | Ideally <70 bpm; β-blocker pre-medication optional but not routinely required |
| ECG leads | Apply 3–4 lead ECG for cardiac gating |
| Breath-hold training | Coach patient on full inspiration breath-hold (~10–15 seconds) |
Scanner Parameters
| Parameter | Value |
|---|---|
| Scanner | MDCT (≥16-slice; 64-slice preferred) |
| ECG gating | Prospective ECG triggering (axial/sequential mode) — minimizes radiation |
| Scan range | Carina to diaphragm (entire cardiac silhouette) |
| Tube voltage (kVp) | 120 kVp (standard); 100 kVp in small/thin patients |
| Tube current (mAs) | 50–100 mAs (low dose acceptable — no contrast needed) |
| Rotation time | 0.25–0.35 seconds |
| Slice thickness | 2.5–3 mm (standard for Agatston scoring — do not use thinner slices as it alters the score) |
| Reconstruction kernel | Medium-smooth (B35f or equivalent) |
| Field of view | Heart only (~25 cm) |
| Contrast | None |
| Breath-hold | Full inspiration, single breath-hold |
| Radiation dose | ~1–3 mSv |
Image Acquisition Timing
- Prospective ECG triggering: images acquired at 70–80% of the R-R interval (mid-to-late diastole) — phase of minimal cardiac motion
- If heart rate is irregular or >80 bpm, consider acquiring at 40–50% (end-systole) as a fallback
Image Analysis & Scoring
Agatston Score Calculation:
- Threshold for calcium: ≥130 HU in an area ≥1 mm²
- Score per lesion = lesion area (mm²) × density factor:
- 130–199 HU → factor 1
- 200–299 HU → factor 2
- 300–399 HU → factor 3
- ≥400 HU → factor 4
- Total score = sum of all lesion scores across all four coronary vessels (LM, LAD, LCx, RCA)
Additional metrics often reported:
- Volume score (mm³) — less threshold-dependent than Agatston
- Mass score (mg of calcium) — most reproducible
- Per-vessel scores (LAD score carries highest weight)
- CAC percentile for age/sex/race (MESA reference ranges)
Score Interpretation:
| Agatston Score | Category | Clinical Action |
|---|---|---|
| 0 | No calcification | Statin may be deferred; reassure; repeat in 5 years if intermediate risk persists |
| 1–99 | Mild | Moderate risk; consider statin therapy |
| 100–299 | Moderate | Elevated risk; initiate/intensify statin |
| ≥300 | Severe | High risk; initiate high-intensity statin + lifestyle |
| ≥400 | Very severe | 15-yr mortality ~28%; consider stress testing |
Reporting Checklist
- Total Agatston score
- Per-vessel scores (LM, LAD, LCx, RCA)
- Volume score and mass score
- MESA percentile for age/sex/race
- Incidental findings on non-cardiac structures (lung nodules, aortic calcification, etc.)
Limitations
- Quantifies calcium only — no assessment of non-calcified plaque or luminal stenosis
- High inter-scanner variability if non-standard slice thickness used
- Not useful in patients with coronary stents (artifact) or prior CABG
- A CAC of 0 does not exclude the presence of soft (non-calcified) plaque
PROTOCOL 2: CT Coronary Angiography (CCTA / CTA)
Overview
A contrast-enhanced, ECG-gated CT study of the coronary arteries using arterial-phase imaging to evaluate coronary stenosis, plaque morphology, coronary anatomy, and physiologic significance (CT-FFR). It is the primary non-invasive diagnostic test for coronary artery disease.
Pre-Procedure
Patient Selection / Indications
- Symptomatic patients with low-to-intermediate pre-test probability of obstructive CAD
- Acute chest pain in ED: intermediate-risk patients without known CAD (2021 AHA/ACC Guideline: Class I)
- Equivocal stress test results
- Congenital coronary artery anomalies (excellent technique)
- Pre-operative coronary assessment in selected patients
- Follow-up after coronary bypass surgery (graft patency)
Contraindications
| Contraindication | Reason |
|---|---|
| Extensive coronary calcification (CAC >600–800) | Blooming artifact renders lumen uninterpretable |
| Coronary stents (especially <3.5 mm diameter) | Metal artifact |
| Atrial fibrillation / irregular rhythm | Motion artifact; non-diagnostic images |
| Allergy to iodinated contrast | Anaphylaxis risk |
| Severe renal impairment (eGFR <30) | Contrast nephropathy |
| Inability to breath-hold | Motion artifact |
| Severe obesity (limits gantry bore) | Image quality degradation |
Patient Preparation
24–48 Hours Before
- Avoid caffeine (coffee, tea, energy drinks) for at least 24 hours — caffeine elevates heart rate and causes ectopic beats
- Stop phosphodiesterase-5 inhibitors (sildenafil, tadalafil) if nitroglycerin will be used (risk of hypotension)
- Metformin: withhold for 48 hours post-procedure if contrast used and renal function borderline
Day of Procedure
| Step | Detail |
|---|---|
| Fasting | 4–6 hours before (for contrast and potential sedation) |
| IV access | 18–20 gauge cannula in antecubital vein (right arm preferred — avoids streak artifact from left brachiocephalic vein) |
| ECG leads | Apply 3–4 lead ECG for real-time monitoring and gating |
| Blood pressure | Measure baseline BP |
| Baseline ECG | Check for arrhythmia |
| Renal function | eGFR must be checked before contrast |
Heart Rate Optimization (Critical Step)
Target heart rate: ≤60 bpm (ideal); ≤65 bpm acceptable
Beta-blocker protocol:
- Oral metoprolol 50–100 mg given 60–90 minutes before scan (if HR >65 bpm and no contraindication)
- IV metoprolol 5 mg boluses (up to 15–20 mg) titrated in the scanner room if oral pre-medication insufficient
- Contraindications to β-blockers: severe asthma, significant bradycardia, high-degree AV block, decompensated heart failure, hypotension
- Alternative: ivabradine (heart rate lowering without negative inotropy) in β-blocker contraindicated patients
Coronary Vasodilation
- Sublingual nitroglycerin 0.4–0.8 mg (spray or tablet) administered 3–5 minutes before scanning
- Maximally dilates coronary arteries → improves lumen visualization and diagnostic accuracy
- Hold if SBP <90 mmHg or patient took PDE5 inhibitor within 24–48 hours
Scanner Parameters
| Parameter | Value |
|---|---|
| Scanner | ≥64-slice MDCT; ideally dual-source CT or 256/320-row CT |
| ECG gating mode | See below |
| Scan direction | Cranio-caudal (carina → diaphragm) |
| Scan range | Carina to diaphragm |
| Tube voltage | 100 kVp (BMI <25); 120 kVp (BMI 25–35); 140 kVp (BMI >35) |
| Tube current | Modulated to patient size (typically 200–800 mAs) |
| Gantry rotation time | 0.25–0.28 seconds → temporal resolution ~165 ms (single source); ~75 ms (dual source) |
| Slice thickness | 0.5–0.75 mm (collimation); reconstructed at 0.5–0.75 mm with 50% overlap |
| Reconstruction kernel | Smooth (B26f/B20f or equivalent) to reduce noise |
| Field of view | 180–220 mm (heart-centered) |
| Matrix | 512 × 512 |
| Contrast volume | 50–100 mL iodinated contrast (300–400 mg I/mL) |
| Injection rate | 5–6 mL/sec via power injector |
| Saline chaser | 30–50 mL saline at same rate (clears contrast from SVC/RA, reduces streak artifact) |
| Radiation dose | ~3–10 mSv (prospective); up to 15–20 mSv (retrospective) |
ECG Gating Modes — Choosing the Right One
| Mode | Description | HR Requirement | Radiation | Use When |
|---|---|---|---|---|
| Prospective ECG triggering (step-and-shoot) | X-ray ON only at pre-selected cardiac phase(s) | HR ≤65 bpm, regular | Lowest (~1–3 mSv) | First choice in all stable, regular-rhythm patients |
| Retrospective ECG gating | Continuous helical acquisition; gating applied in post-processing | Any HR | Highest (~10–20 mSv) | Irregular rhythm, need functional data (wall motion), high HR not adequately controlled |
| High-pitch dual-source CT | Single-beat acquisition at high pitch (3.2–3.4) | HR <60 bpm, regular | Very low (~0.5–1 mSv) | Ideal if dual-source scanner available and HR well controlled |
Temporal resolution is the single most important technical determinant of CCTA image quality. The reference standard (ICA) has temporal resolution of 5–20 ms; ≤50 ms is desirable for coronary imaging. — Fuster & Hurst's The Heart, 15th ed., p. 137
Contrast Injection & Timing
Two main methods to determine optimal scan delay:
- Test bolus technique: inject 15–20 mL contrast + saline chaser → monitor aortic attenuation over time → calculate time-to-peak → set scan delay accordingly
- Bolus tracking (SmartPrep / CARE Bolus): ROI placed in descending/ascending aorta; scan triggers automatically when attenuation reaches 100–150 HU threshold above baseline (preferred method)
Target aortic attenuation on final images: ≥300–350 HU
Image Reconstruction & Post-Processing
After acquisition, images are reconstructed at multiple cardiac phases (every 5–10% of R-R interval in retrospective gating, or at selected phases in prospective):
| Reconstruction | Purpose |
|---|---|
| Axial images (0.5–0.75 mm) | Baseline review; lumen evaluation |
| Curved MPR (cMPR) | Full vessel length in single image — primary tool for stenosis grading |
| Straight MPR | Cross-sectional vessel view — plaque composition |
| Maximum Intensity Projection (MIP) | 5–15 mm thick slab — long vessel segments; limited by overlap |
| 3D Volume Rendering (VR) | Anatomical overview; presentations; anomalies |
| CT-FFR | Proprietary software (HeartFlow FFRCT) calculates intracoronary pressure gradient from CCTA data |
Best phase for image quality:
- Mid-diastole (70–75% of R-R): best for most patients with HR <65
- End-systole (35–45% of R-R): better for patients with elevated HR >70
Stenosis Grading & Plaque Reporting
Stenosis Classification (CAD-RADS system):
| CAD-RADS Score | % Stenosis | Recommendation |
|---|---|---|
| 0 | 0% — no plaque | No CAD; discharge/reassure |
| 1 | 1–24% | Minimal; medical therapy |
| 2 | 25–49% | Mild non-obstructive |
| 3 | 50–69% | Moderate — consider functional testing (FFR/stress) |
| 4A | 70–99% | Severe — consider ICA/revascularization |
| 4B | Left main ≥50% or 3-vessel ≥70% | Severe — urgent ICA |
| 5 | Total occlusion | ICA / revascularization planning |
| N | Non-diagnostic | Repeat or alternate modality |
Plaque type documentation:
- Calcified (>130 HU)
- Non-calcified (<30 HU — lipid-rich/necrotic core)
- Mixed (combination)
- High-risk features: Low-attenuation plaque (<30 HU), positive remodeling, spotty calcification, "napkin ring" sign
Radiation Dose Reduction Strategies
- Prospective ECG triggering (biggest single reduction)
- High-pitch dual-source CT when available
- Tube voltage reduction (100 kVp vs 120 kVp in non-obese) — reduces dose by ~40%
- Automated tube current modulation
- Iterative reconstruction algorithms (reduce image noise at lower dose)
- Careful scan range limitation (only cardiac silhouette)
Post-Procedure Care
- Monitor patient for 20–30 minutes post-contrast
- Encourage oral hydration (500 mL–1L water) post-procedure
- Nitroglycerin headache counseling (common, resolves in 20–30 min)
- Contrast reaction management protocol on standby
- Renal function re-check at 48–72 hours if borderline eGFR
Reporting Template (CCTA)
CLINICAL INDICATION:
TECHNIQUE: Retrospective/Prospective ECG-gated CCTA;
           [X] mL iodinated contrast at [X] mL/sec;
           Heart rate: [X] bpm; β-blocker given: Y/N;
           Nitroglycerin given: Y/N

CORONARY DOMINANCE: Right / Left / Co-dominant

CORONARY ARTERIES:
  Left Main (LM): [stenosis %] [plaque type]
  LAD: proximal / mid / distal [stenosis %]
  Diagonal branches: D1, D2
  Left Circumflex (LCx): [stenosis %]
  Obtuse Marginals: OM1, OM2
  RCA: proximal / mid / distal [stenosis %]
  PDA / PLV:

PLAQUE BURDEN: Absent / Mild / Moderate / Severe
HIGH-RISK PLAQUE FEATURES: Present / Absent
  - Low-attenuation plaque: Y/N
  - Positive remodeling: Y/N
  - Spotty calcification: Y/N
  - Napkin ring sign: Y/N

CORONARY CALCIUM SCORE (if non-contrast phase acquired): [Agatston]

CAD-RADS SCORE: [0–5/N] [modifier: +V for vulnerability, +I for ischemia by CTFFR]

CARDIAC STRUCTURES:
  LV function (if retrospective): [visually estimated EF]
  Pericardium: Normal / Abnormal
  Valves: Normal / Abnormal
  Aortic root: [measurement]

EXTRACARDIAC FINDINGS:

IMPRESSION:
RECOMMENDATION:
Summary Comparison of Both Protocols
| CAC Scoring | CCTA | |
|---|---|---|
| Goal | Risk quantification | Diagnosis + plaque characterization |
| Contrast | None | Yes (50–100 mL) |
| IV access | No | Yes (18G antecubital) |
| Nitroglycerin | No | Yes (sublingual pre-scan) |
| Beta-blocker | Optional | Essential (target HR ≤60 bpm) |
| ECG gating | Prospective (70–80% R-R) | Prospective or retrospective |
| Slice thickness | 2.5–3 mm (fixed for Agatston) | 0.5–0.75 mm |
| Radiation | ~1–3 mSv | ~3–15 mSv |
| Post-processing | Agatston calculator | MPR, MIP, VR, CT-FFR |
| Scoring system | Agatston / Volume / Mass | CAD-RADS 0–5 |
| Key limitation | No soft plaque; no stenosis | High CAC, stents, irregular rhythm |
| Patient position | Supine, arms above head | Supine, arms above head |
Sources:
- Fuster and Hurst's The Heart, 15th Edition
- Goldman-Cecil Medicine, International Edition
- The Washington Manual of Medical Therapeutics
- 2021 AHA/ACC/ASE/CHEST/SAEM/SCCT/SCMR Chest Pain Guideline (Class I for CCTA in intermediate-risk acute chest pain)
What is myocardial imaging in detail and also its protocol, technique and all
Reading File
Finding Sources
Finding Sources
Finding Sources
Finding Sources
Reading File
Reading File
Reading File
Reading File
Reading File
Reading File
Reading File
Reading File
Loading Image
Reading File
Myocardial imaging in CT and Ct perfusion scanning
Reading File
Finding Sources
Finding Sources
Finding Sources
Finding Sources
Finding Sources
Reading File
Reading File
Reading File
Reading File
Reading File
Reading File
Reading File
Reading File
Reading File
Now I have comprehensive material. Let me compile the full detailed answer.
Myocardial Imaging by CT & CT Myocardial Perfusion (CTP)
1. Overview: CT as a Myocardial Imaging Tool
Cardiac CT is fundamentally a 3D volume technique — any imaging plane can be reconstructed, giving it an advantage over echocardiography and nuclear medicine in anatomical flexibility. When applied to the myocardium specifically, cardiac CT can assess:
- Myocardial structure and tissue — wall thickness, masses, thrombus, aneurysm
- Ventricular function — ejection fraction, wall motion, volumes (LV + RV)
- Myocardial perfusion — stress CT myocardial perfusion (stress CTP)
- Coronary-myocardial correlation — combining CCTA anatomy with perfusion physiology
"Stress CT myocardial perfusion may be used for evaluating myocardial perfusion for the detection of functionally significant coronary artery disease." — Grainger & Allison's Diagnostic Radiology
2. CT Imaging of Myocardial Structure & Function
2.1 Myocardial Tissue Visualisation
The myocardial tissue can be visualised in any reconstructed plane. Standard views used in practice:
| View | Best For |
|---|---|
| Transverse (axial) images | RV evaluation, scrolling through heart |
| Two-chamber view | LV long axis, mitral valve |
| Three-chamber view | LVOT, aortic valve, LV |
| Four-chamber view | Both ventricles and atria |
| Short-axis (SA) views | LV myocardium 17-segment model — direct correlation with echo, CMR, nuclear |
The SA view is the most important for 17-segment myocardial evaluation — it enables direct comparison with SPECT, PET, and CMR findings.
2.2 Ventricular Function by CT
For LV/RV functional analysis, data acquisition must be performed throughout the entire cardiac cycle (not just at one phase):
- Retrospective ECG gating: images reconstructed at every 5–10% of the R-R interval → allows calculation of:
- End-diastolic volume (EDV)
- End-systolic volume (ESV)
- Ejection fraction (EF)
- Stroke volume
- Regional wall motion analysis
- Radiation dose is higher with retrospective gating (12–21 mSv), but can be reduced with ECG-dose modulation
- Low-dose CT data throughout the cardiac cycle can be used if only functional data are needed (not coronary anatomy)
3. CT Myocardial Perfusion Imaging (Stress CTP)
3.1 Concept and Rationale
CTP is based on the same physiological principle as SPECT/PET perfusion imaging:
Resting myocardial perfusion is normal until luminal diameter narrowing exceeds 90–95%. With maximal coronary hyperemia (pharmacological stress), a progressive decrease in hyperemic response occurs above a threshold of ~50% diameter stenosis. — Fuster & Hurst's The Heart, 15th ed.
In CTP, iodinated contrast acts as the perfusion tracer. Under pharmacological stress (vasodilator), a flow-limiting stenosis creates a relative underperfusion in the subtended myocardial territory — visible as a region of reduced CT attenuation (HU) compared to normally perfused myocardium.
CTP is particularly appealing as an add-on to CCTA because it combines:
- Anatomy (plaque severity, stenosis %) from CCTA
- Physiology (perfusion, flow reserve) from CTP
- In a single examination with iodinated contrast
"Evolving new applications for the adjudication of the hemodynamic significance of stenosis such as CT myocardial perfusion imaging and FFR-CT are now being used in clinical practice." — Fuster & Hurst's The Heart, 15th ed.
3.2 Types of CT Myocardial Perfusion
| Type | Description |
|---|---|
| Static (First-Pass) CTP | Single acquisition during peak myocardial contrast enhancement at stress; quick; lower radiation; qualitative/semi-quantitative |
| Dynamic (4D) CTP | Sequential/continuous acquisitions over time; generates time-attenuation curves; allows quantification of absolute myocardial blood flow (mL/min/g) and myocardial perfusion reserve (MPR) |
4. Protocol: CT Myocardial Perfusion (CTP)
4.1 Patient Preparation
| Step | Detail |
|---|---|
| Caffeine restriction | Avoid for 24 hours before scan — caffeine is an adenosine receptor antagonist and directly antagonises vasodilator stress agents |
| PDE5 inhibitors | Withhold sildenafil/tadalafil for 24–48 hours |
| Fasting | 4–6 hours |
| IV access | 18G or 20G antecubital (right arm preferred) |
| ECG leads | 3–4 lead for gating and monitoring |
| Baseline HR and BP | Document before proceeding |
| Renal function | eGFR must be checked — iodinated contrast required |
| Beta-blockers | NOT given for CTP stress — vasodilators work by relative flow heterogeneity and β-blockade may interfere; HR control not as critical for perfusion as for CCTA |
| Bronchospasm history | If asthma/COPD: dobutamine preferred over adenosine/regadenoson |
4.2 Stress Agents Used in CTP
The same pharmacological stressors as nuclear perfusion imaging are used:
Vasodilators (First-line)
| Agent | Mechanism | Dose | Duration of Action | Reversal |
|---|---|---|---|---|
| Regadenoson | Selective A2A adenosine receptor agonist | 0.4 mg fixed IV bolus over 10 sec | Peak ~1 min; lasts ~2 min | IV aminophylline 50–100 mg |
| Adenosine | Non-selective adenosine receptor agonist | 140 μg/kg/min infused over 4–6 min | ~13 seconds (short acting) | Rarely needed |
| Dipyridamole | Inhibits adenosine breakdown | 0.56 mg/kg over 4 min | 20–30 min | IV aminophylline |
Regadenoson is the most commonly used vasodilator in current practice (United States) — selective A2A agonism means fewer systemic side effects and less bronchoconstriction. CT scan is initiated 10–20 seconds after regadenoson injection, during the peak hyperemic window.
Dobutamine (Alternative)
- Used in asthma, COPD with bronchospasm, or recent caffeine ingestion
- Protocol: stepwise increments from 5 μg/kg/min up to 40 μg/kg/min, ± atropine if target HR not achieved
- Less ideal because it achieves lower peak coronary blood flow than vasodilators
Contraindications to Vasodilators
- Second- or third-degree AV block
- Sick sinus syndrome (without functioning pacemaker)
- Severe asthma / active bronchospasm
- Systolic BP <90 mmHg
- Caffeine within 12–24 hours
4.3 Scanner Parameters — Static (First-Pass) CTP Protocol
| Parameter | Value |
|---|---|
| Scanner | ≥64-slice MDCT; dual-source or wide-volume (256/320-row) preferred |
| Scan mode | Prospective ECG triggering (step-and-shoot) |
| Acquisition timing | During peak myocardial contrast enhancement at stress (bolus tracking in LV cavity — trigger at ~250–300 HU) |
| Tube voltage | 100 kVp (standard); 80 kVp in thin patients (increases iodine conspicuity) |
| Tube current | Weight-adapted; 200–400 mAs |
| Slice thickness | 0.5–0.75 mm collimation; reconstructed at 3 mm for perfusion analysis |
| Contrast volume | 60–80 mL iodinated contrast (350–400 mgI/mL) |
| Injection rate | 5–6 mL/sec followed by 30–40 mL saline chaser |
| Cardiac phase | Mid-diastole (75% R-R) — phase of least motion |
| Breath-hold | Full inspiration single breath-hold |
| Radiation dose | ~3–5 mSv for static CTP; significantly higher for dynamic CTP |
Typical complete CTP study sequence:
- Non-contrast scan → CAC scoring (Agatston score baseline)
- Stress CTP acquisition → during pharmacological hyperemia
- Rest CCTA → coronary anatomy 10–15 minutes later (after stress agent wears off and HR stabilises)
- (Optional) Rest CTP → for comparison with stress to define reversibility
4.4 Scanner Parameters — Dynamic (4D) CTP Protocol
| Parameter | Value |
|---|---|
| Scan mode | Shuttle mode (table oscillates) or wide-volume axial (320-row CT covers entire heart in single rotation) |
| Temporal sampling | Every 1–3 cardiac cycles over ~30–60 seconds |
| Coverage | Entire LV myocardium (z-coverage ≥12 cm needed; wide-volume CT ideal) |
| Contrast volume | 50–70 mL at 5–6 mL/sec |
| Output | Time-attenuation curves (TAC) per myocardial segment |
| Quantification | Myocardial blood flow (MBF in mL/min/g), myocardial blood volume (MBV), myocardial perfusion reserve (MPR = stress MBF / rest MBF) |
| Radiation dose | Higher — 8–15 mSv due to repeated acquisitions |
Dynamic CTP provides absolute quantification of myocardial blood flow — analogous to PET perfusion imaging. This overcomes the limitation of "balanced ischemia" seen in multivessel CAD with relative perfusion methods (where all territories appear equally underperfused and the defect is missed).
5. Image Interpretation in CTP
5.1 Normal vs. Abnormal
- Normal perfusion: uniform myocardial enhancement throughout all segments; attenuation values homogeneous
- Perfusion defect: region of reduced CT attenuation (appears darker/hypodense) compared to surrounding normally perfused myocardium
5.2 Defect Classification
| Defect Type | Stress | Rest | Interpretation |
|---|---|---|---|
| Reversible (ischemia) | Present (hypodense) | Absent / fills in | Flow-limiting stenosis; viable ischemic myocardium |
| Fixed (scar/infarct) | Present | Present | Prior myocardial infarction; scar tissue |
| Mixed | Present (large) | Present (smaller core) | Ischemia surrounding a scar (peri-infarct ischemia) |
5.3 Quantitative Thresholds (Dynamic CTP)
| Parameter | Normal | Abnormal (Ischemia) |
|---|---|---|
| Myocardial Blood Flow (MBF) — stress | >2.0 mL/min/g | <1.5–2.0 mL/min/g |
| Myocardial Perfusion Reserve (MPR) | ≥2.0–2.5 | <2.0 |
| Myocardial Blood Volume (MBV) | Preserved | Reduced in dense scar |
5.4 17-Segment Model
The standard AHA 17-segment model is used for localization:
| Coronary Territory | LV Segments |
|---|---|
| LAD | Anterior wall, anteroseptum, apex (segments 1, 2, 7, 8, 13, 14, 17) |
| RCA | Inferior wall, inferoseptum (segments 3, 4, 9, 10, 15) |
| LCx | Lateral wall, inferolateral (segments 5, 6, 11, 12, 16) |
6. Combined CCTA + CTP (One-Stop Cardiac CT)
The most powerful application is the hybrid CCTA + CTP protocol in a single session:
Step 1: Non-contrast scan → CAC Score
Step 2: Pharmacological stress → Stress CTP (functionally significant stenosis?)
Step 3: Wait 10–15 min → Rest CCTA (anatomy: which vessel, stenosis degree, plaque type?)
Clinical decision pathway:
- CCTA stenosis <50% → low likelihood of hemodynamic significance → no CTP needed
- CCTA stenosis 50–70% (intermediate) → CTP determines if functionally significant
- CTP positive + CCTA significant stenosis → refer for ICA / revascularization
- CTP negative despite stenosis on CCTA → medical management (hemodynamically insignificant)
"In analogy to CMR, CCT can also be used to study myocardial perfusion under stress conditions; in particular, the combination with morphological depiction of the plaque and plaque stenosis severity at coronary CT angiography, this is potentially a very appealing application." — Grainger & Allison's Diagnostic Radiology
7. Diagnostic Accuracy of Stress CTP
| Comparison | Sensitivity | Specificity | Notes |
|---|---|---|---|
| CTP alone vs. ICA | ~85–90% | ~80–85% | Single-center data |
| CTP + CCTA hybrid vs. ICA (FFR gold standard) | ~90% | ~87% | Superior to CCTA alone for functional stenosis |
| vs. SPECT | Similar or superior sensitivity; better spatial resolution | CTP detects smaller subendocardial defects | Less soft-tissue attenuation artifact |
| vs. CMR perfusion | Comparable accuracy | CMR superior in soft tissue contrast; CTP allows simultaneous coronary anatomy |
Limitation note: CTP remains an emerging technology compared to SPECT and CMR perfusion — Harrison's Principles of Internal Medicine (22nd ed.) notes it is still evolving in widespread clinical application. The main downsides are higher radiation dose (especially dynamic protocols) and contrast requirements.
8. Imaging Markers of Myocardial Viability on CT
| Finding | Appearance | Significance |
|---|---|---|
| Myocardial wall thinning | <5.5 mm wall thickness on CT | Scar / non-viable myocardium |
| Subendocardial hypoenhancement | Dark inner rim on contrast CT | Microvascular obstruction or infarct |
| Transmural hypoenhancement | Full thickness dark zone | Transmural infarct |
| LV aneurysm | Bulging, thin, akinetic wall segment | Late complication of MI |
| LV thrombus | Low-density filling defect in cavity | Requires delayed imaging to confirm |
| Fixed perfusion defect on CTP | Hypodense at both stress and rest | Prior infarction / scar |
9. Radiation Dose Comparison
| CT Technique | Approximate Dose |
|---|---|
| CAC scoring | 1–3 mSv |
| CCTA (prospective) | 1–5 mSv |
| CCTA (retrospective) | 12–21 mSv |
| Static stress CTP + rest CCTA | 5–10 mSv |
| Dynamic (4D) stress CTP | 8–15 mSv |
| Full combined study (CAC + stress CTP + rest CCTA) | 8–15 mSv |
Dose reduction strategies applicable to CTP:
- Prospective ECG triggering for rest CCTA component
- 100 kVp or 80 kVp tube voltage
- Weight-based tube current modulation
- Iterative reconstruction algorithms
- Stress-only CTP protocol if rest images not needed
10. Clinical Indications Summary
| Indication | Recommended CT Technique |
|---|---|
| Symptomatic patient, intermediate pretest probability | CCTA ± CTP |
| CCTA shows 50–70% stenosis (intermediate) | Add stress CTP or CT-FFR |
| Post-ACS, need viability assessment | Late-phase contrast CT or CMR preferred |
| Pre-TAVI / structural intervention | Functional CT (retrospective gating for EF + anatomy) |
| Known CAD, need functional assessment | Stress CTP or SPECT/PET |
| Asymptomatic, risk stratification only | CAC scoring (no CTP needed) |
| Suspected balanced ischemia (multivessel) | Dynamic CTP (absolute MBF quantification) or PET |
11. Limitations of CT Myocardial Perfusion
| Limitation | Detail |
|---|---|
| Radiation dose | Higher than SPECT for dynamic protocols; limits repeated scanning |
| Contrast requirement | Not usable in CKD (eGFR <30), contrast allergy |
| Blooming artifact from calcification | High CAC scores degrade both CCTA and CTP quality |
| Beam-hardening artifacts | Can mimic or mask perfusion defects, especially inferior wall |
| No absolute quantification with static CTP | Static protocol is qualitative/semi-quantitative only |
| Emerging technology | Less validated outcomes data than SPECT/PET; not yet universally adopted |
| Temporal resolution | Lower than CMR for first-pass dynamics |
Sources:
- Fuster and Hurst's The Heart, 15th Edition
- Grainger & Allison's Diagnostic Radiology
- Goldman-Cecil Medicine, International Edition
- Harrison's Principles of Internal Medicine, 22nd Edition
This is a shared conversation. Sign in to Orris to start your own chat.