
Define Frank Sterling's law of the heart and explain its importance with the help of a graph. Short Answers
Frank Starling law of the heart graph stroke volume ventricular end diastolic volume
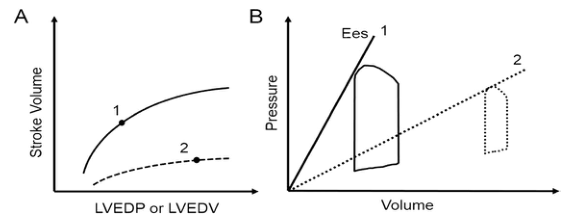
Summary : This figure compares cardiac function under two conditions using two types of plots: (A) the Frank-Starling relationship between stroke volume and left ventricular filling, and (B) pressure-volume loops with end-systolic elastance (Ees) lines. line and schematic plot: # Panel A: Frank-Starling Curve : • Y-axis: Stroke Volume (no units shown). • X-axis: LVEDP or LVEDV (Left Ventricular End-Diastolic Pressure or Volume; no units shown). • Two curves are shown: – Curve 1: Higher, solid line, labeled "1". – Curve 2: Lower, dashed line, labeled "2". • Each curve has a point marked (solid dot) on it. # Panel B: Pressure-Volume Loop and End-Systolic Elastance : • Y-axis: Pressure (no units shown). • X-axis: Volume (no units shown). • Two pressure-volume loops: – Loop 1: Solid line, larger, leftward, labeled "1". – Loop 2: Dashed line, smaller, rightward, labeled "2". • Two Ees (end-systolic elastance) lines: – Ees 1: Steeper, solid line, labeled "1". – Ees 2: Less steep, dashed line, labeled "2". # Design Encodings : • Solid lines for condition 1, dashed lines for condition 2. • Dots mark specific points on the curves in panel A. • Pressure-volume loops are outlined, with loop 2 shown as a dashed outline. # Analysis : • Panel A shows that condition 1 (solid line) has a higher stroke volume for any given LVEDP/LVEDV compared to condition 2 (dashed line), indicating better cardiac function. • Panel B shows that condition 1 has a larger, leftward pressure-volume loop and a steeper Ees line, indicating greater contractility. Condition 2 has a smaller, rightward loop and a less steep Ees line, indicating reduced contractility. • The figure visually contrasts normal/enhanced versus impaired cardiac function using both stroke volume response and pressure-volume relationships.
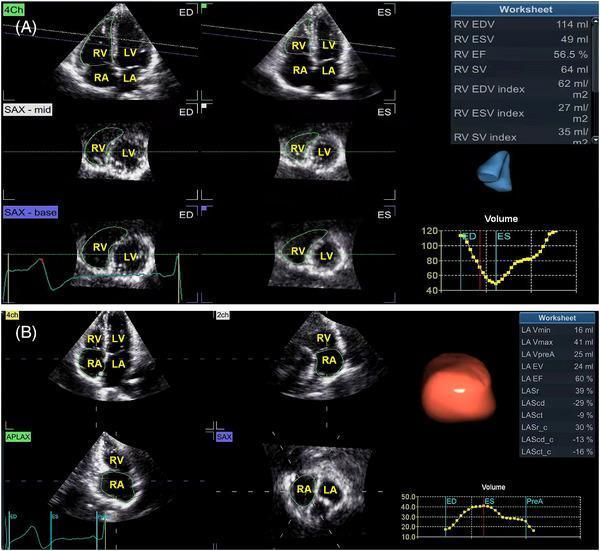
Educational diagnostic graphic depicting 4D echocardiographic analysis of cardiac chambers. Panel A illustrates right ventricular (RV) quantification using 4D Auto RVQ, showing 4-chamber (4Ch), mid-short axis (SAX-mid), and basal short axis (SAX-base) views at end-diastole (ED) and end-systole (ES). Key anatomical structures labeled include the RV, left ventricle (LV), right atrium (RA), and left atrium (LA). A quantitative worksheet lists RV end-diastolic volume (EDV), end-systolic volume (ESV), ejection fraction (EF), and stroke volume (SV), alongside a 3D reconstruction and a temporal volume-change graph. Panel B demonstrates right atrial (RA) geometry and function assessment via 4D Auto LAQ software. It presents 4Ch, 2-chamber (2ch), apical long-axis (APLAX), and short-axis (SAX) orientations. Quantitative metrics include maximal volume (Vmax), minimal volume (Vmin), emptying volume (EV), and fractional volume changes (LASr, LAScd). These images exemplify advanced ultrasound imaging for volumetric and functional assessment of the right heart chambers in clinical cardiology.
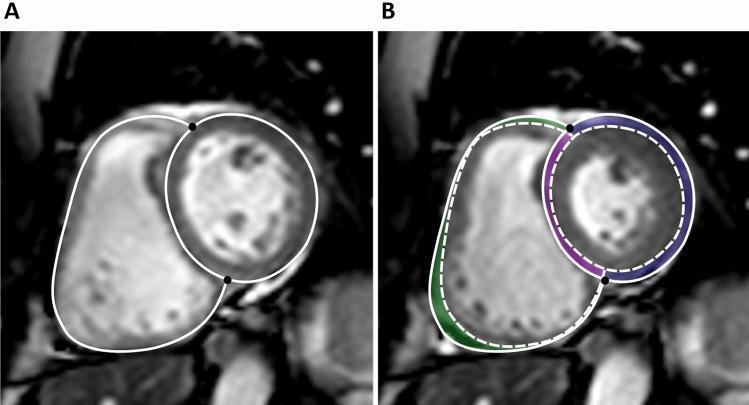
This diagnostic image consists of two panels (A and B) showing Cardiac Magnetic Resonance (CMR) in a short-axis view of the heart. The image demonstrates the quantitative assessment of stroke volume (SV) components through ventricular segmentation. Panel A depicts the heart at end diastole, with solid white lines outlining the epicardial borders of the left ventricle (LV) and right ventricle (RV); black dots indicate the RV insertion points. Panel B illustrates the end-systolic state, featuring dashed white lines for the end-systolic epicardial borders superimposed on the end-diastolic contours. Color-coded regions quantify localized contributions to stroke volume: the purple area between RV insertion points represents the septal contribution; the green area represents the lateral wall contribution of the RV; and the blue area represents the lateral wall contribution of the LV. This visual is used to distinguish between septal and lateral myocardial shortening and their respective roles in ventricular pump function, relevant for cardiovascular physiology and advanced cardiac imaging education.
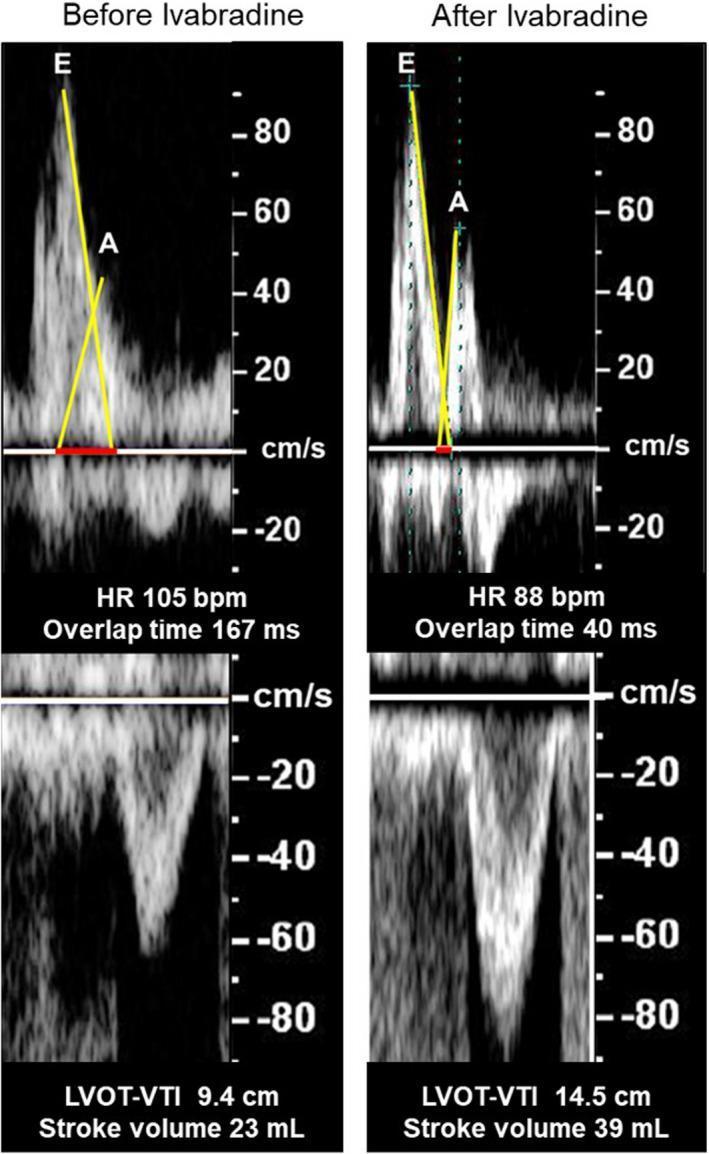
A comparison chart consisting of four echocardiographic images (spectral Doppler) demonstrating hemodynamic changes before and after the administration of ivabradine in a patient with heart failure. The left column shows baseline parameters at a heart rate (HR) of 105 bpm, featuring severe tachycardia-induced overlap (167 ms) between the mitral inflow E-wave (early diastole) and A-wave (atrial contraction), along with a low left ventricular outflow tract velocity-time integral (LVOT-VTI) of 9.4 cm and stroke volume (SV) of 23 mL. The right column illustrates the response to ivabradine, showing a reduced HR of 88 bpm. Visually, this reduction in heart rate leads to a significant decrease in E-A wave overlap (to 40 ms), allowing for improved diastolic filling time. Consequently, there is a notable increase in systolic performance markers, with LVOT-VTI rising to 14.5 cm and stroke volume increasing to 39 mL. This diagnostic image set highlights the pharmacological benefit of selective heart rate reduction in optimizing ventricular-arterial coupling and stroke volume via the Frank-Starling mechanism.
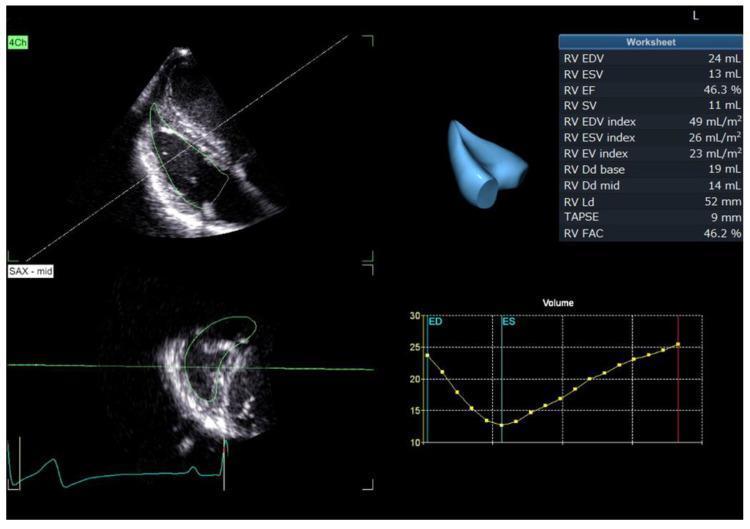
This diagnostic image displays a quad-pane interface from a real-time three-dimensional echocardiography (RT3DE) system used for automated right ventricular (RV) quantification. The top-left panel shows an apical four-chamber (4Ch) view optimized for the right heart, featuring a green contour of the automatically traced endocardial border. The bottom-left panel provides a short-axis view (SAX-mid) of the ventricle, also with a green endocardial trace and an electrocardiogram (ECG) lead at the bottom. The top-right quadrant includes a 3D surface rendering of the RV volume alongside a 'Worksheet' detailing clinical measurements: RV End-Diastolic Volume (EDV, 24 mL), RV End-Systolic Volume (ESV, 13 mL), RV Ejection Fraction (EF, 46.3%), and Stroke Volume (SV, 11 mL), plus indexed values and linear dimensions (TAPSE, FAC). The bottom-right panel displays a volume-time graph showing the dynamic changes in RV volume over one cardiac cycle, with markers for end-diastole (ED) and end-systole (ES). This tool facilitates comprehensive hemodynamic assessment and structural evaluation of the right heart in cardiology.
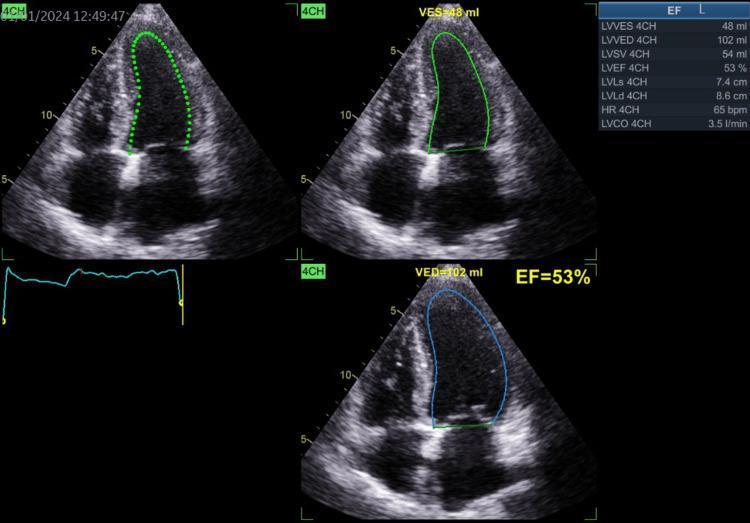
An echocardiogram in the apical four-chamber (4CH) view, displaying left ventricular (LV) volume measurements and systolic function assessment using the Simpson's method of disks. The panel contains three ultrasound frames illustrating the LV tracing in different cardiac phases. The end-diastolic volume (LVVED) is outlined in blue at 102 ml, while the end-systolic volume (LVVES) is outlined in green at 48 ml. Quantitative data presented in the overlay includes a stroke volume (LVSV) of 54 ml and a preserved ejection fraction (LVEF) of 53%. Anatomical longitudinal measurements show an end-diastolic length (LVLd) of 8.6 cm and an end-systolic length (LVLs) of 7.4 cm. Additional hemodynamic data indicates a heart rate of 65 bpm and a calculated cardiac output (LVCO) of 3.5 l/min. This diagnostic image is used in cardiology for assessing ventricular wall motion, volume status, and global systolic performance in patients with conditions such as heart failure or valvular disease.
Frank-Starling's Law of the Heart
Definition
The volume of blood ejected by the ventricle in each beat (stroke volume) depends on the volume present in the ventricle at the end of diastole (end-diastolic volume, EDV).
Cellular Mechanism
- As EDV increases, cardiac muscle fibers are stretched to a greater length
- Stretching brings actin and myosin filaments to a more optimal overlap for cross-bridge formation
- This results in greater force of contraction during systole
- The mechanism also involves increased calcium sensitivity of troponin C at longer sarcomere lengths
Graphical Explanation
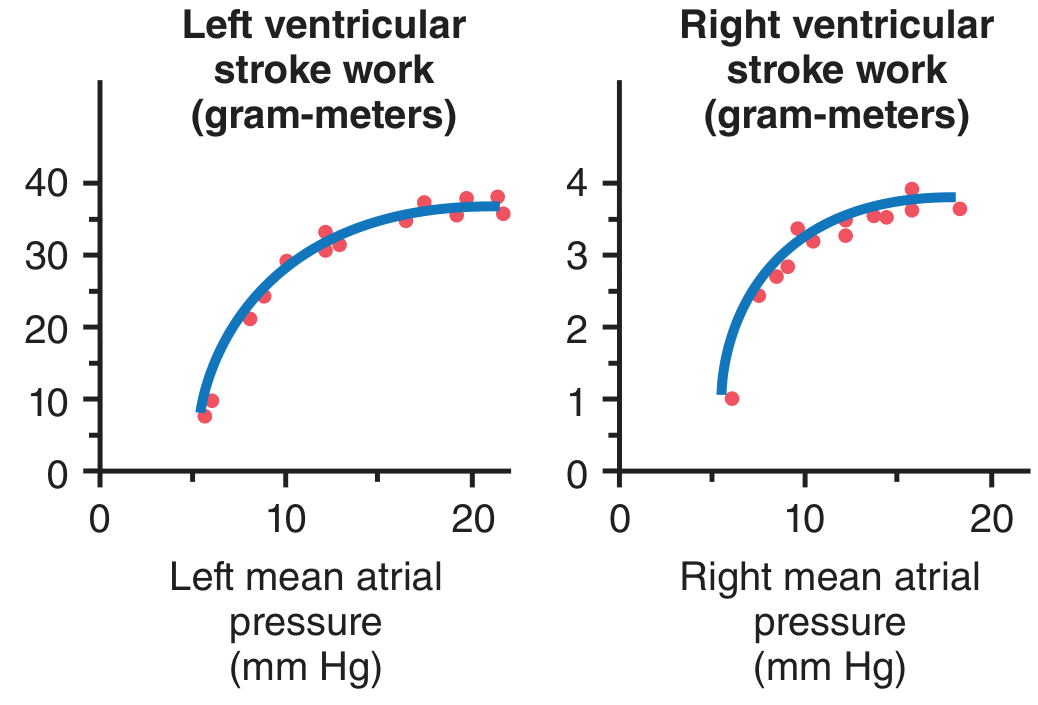
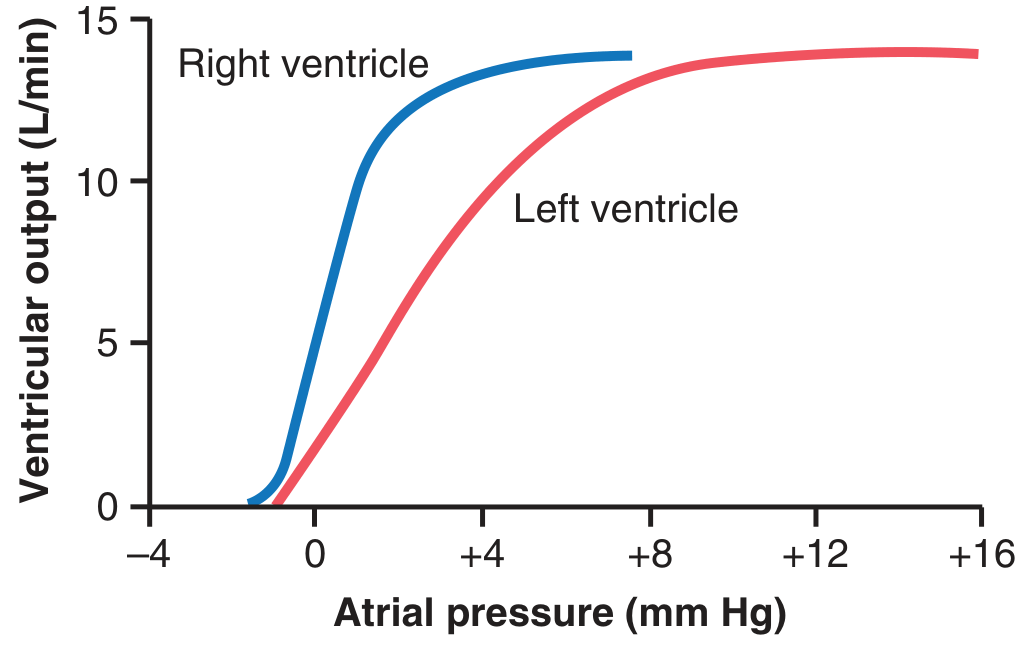
Key Features of the Curve
| Feature | Explanation |
|---|---|
| Rising limb | Increasing EDV → increasing stretch → increasing stroke volume (physiologic range) |
| Plateau | At very high EDV, further filling produces no additional increase in output |
| Upward shift | Increased contractility (positive inotropes: digoxin, catecholamines) shifts curve up |
| Downward shift | Decreased contractility (heart failure, negative inotropes) shifts curve down |
Importance
- Equalization of cardiac output: Ensures the right and left ventricles pump equal volumes beat-to-beat; if the right ventricle pumped more than the left, blood would accumulate in the lungs.
- Response to venous return: The heart automatically adjusts its output to match venous return. When more blood returns (e.g. during exercise), the heart ejects more without requiring nervous input.
- Steady-state principle: In the steady state, cardiac output equals venous return - the Frank-Starling law is the mechanism that enforces this equality.
- Basis for preload concept: It explains why preload (filling pressure/EDV) is a key determinant of cardiac output alongside afterload, heart rate, and contractility.
- Clinical relevance: In heart failure, the Frank-Starling curve is shifted downward - the failing heart cannot increase output in response to increased filling, explaining why patients decompensate with fluid overload.