
Necrosis
types of necrosis histology pathology coagulative liquefactive caseous
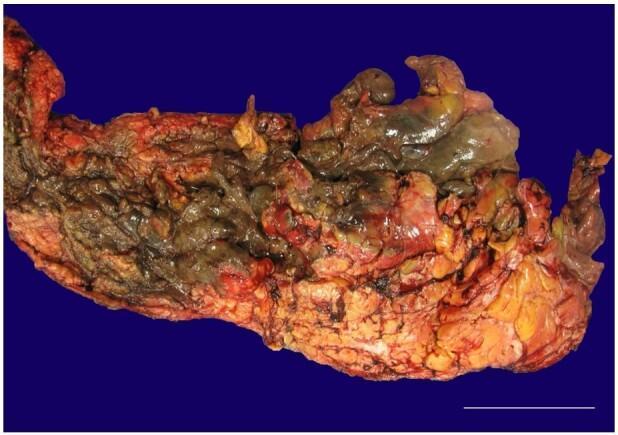
Clinical photograph of a gross pathological surgical specimen consisting of debrided necrotic tissue, measuring 44 x 17 x 4 cm. The tissue displays significant macroscopic signs of necrotizing fasciitis, characterized by a heterogeneous and severely damaged appearance. Visible pathology includes extensive liquefactive and coagulative necrosis, with color variations ranging from pale gray and greenish-yellow to dark brown and black gangrenous areas. Interspersed regions of red discoloration suggest underlying hemorrhage and acute inflammation. The specimen's texture is highly irregular and granular, showing destruction of the subcutaneous adipose tissue and fascia. The educational focus is on identifying the gross characteristics of Stage III necrotizing fasciitis (associated with Streptococcus constellatus in this case) and the massive extent of tissue devitalization that necessitates urgent surgical intervention. This image is relevant for surgical pathology, infectious disease, and emergency medicine education regarding soft tissue infections and septic shock.
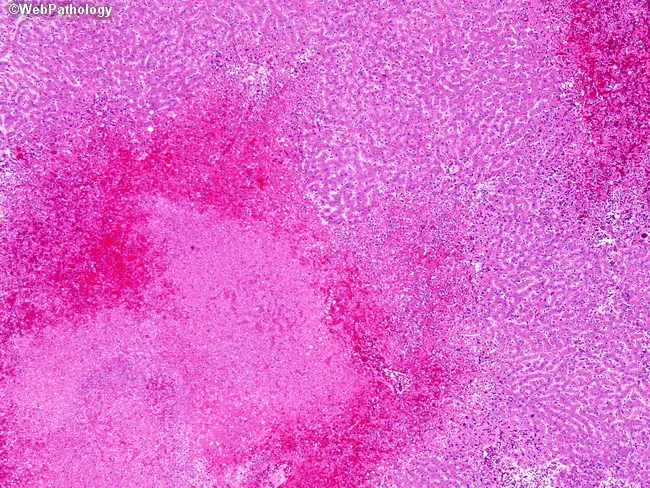
This image depicts a liver biopsy stained with Hematoxylin and Eosin, examined under light microscopy. The hepatic parenchyma exhibits irregular, patchy coagulative necrosis with adjacent hemorrhage and a surprisingly sparse inflammatory response, a histologic hallmark of herpes simplex virus (HSV) hepatitis. The necrotic zones disrupt normal lobular architecture and are conspicuously hemorrhagic, creating mottled pale-to-dark pink areas on the slide. Within viable portal tracts and residual cords, hepatocytes show minimal inflammatory cells, reinforcing the non-destructive inflammatory pattern typical of HSV-related liver injury. Infected hepatocytes may display nuclear viral inclusions (Cowdry type A) and occasional multinucleation, reflecting HSV cytopathic effect. The gross correlation often shows mottling and hemorrhagic liver surface. HSV hepatitis is an uncommon but severe complication of adult HSV-1 or HSV-2 infection and can occur in immunocompetent hosts. Clinically, presentation is nonspecific until acute liver failure ensues; thus histology plays a critical diagnostic role, prompting confirmatory HSV PCR or immunohistochemistry. Early antiviral therapy with acyclovir significantly improves prognosis. This image is educational for pathology education, differential diagnosis in acute liver injury, and recognition of viral cytopathic effects in hepatic tissue. Useful for medical students, residents, and researchers studying viral hepatitis, transplant pathology, and fulminant hepatic failure. Educational utility emphasized.
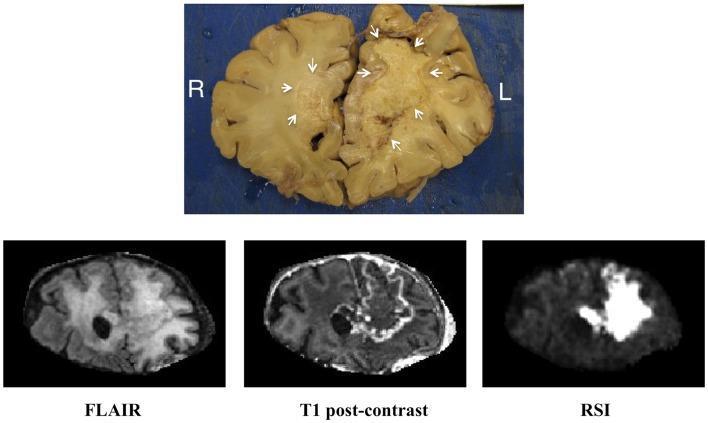
This educational image presents a clinicopathologic correlation between a gross pathology specimen and multi-parametric Magnetic Resonance Imaging (MRI) of the brain. The top panel shows a coronal gross pathologic section through the frontal lobes, labeled right (R) and left (L). The left hemisphere contains a large, demarcated area of yellowish, caseous coagulative necrosis (indicated by white arrows) resulting from bevacizumab-related treatment effects. A smaller, similar lesion is visible in the right hemisphere. The bottom panel provides corresponding coronal MRI sequences for clinical correlation: 1) FLAIR shows heterogeneous hyperintensity throughout the left frontal lobe indicating vasogenic edema and tissue changes. 2) T1 post-contrast demonstrates a prominent, irregular ring-enhancing lesion in the left hemisphere, signifying a breakdown of the blood-brain barrier. 3) Restriction-Spectrum Imaging (RSI) reveals a striking, homogeneous bright signal in the region of the necrosis, indicating marked restricted diffusion. This sequence allows for the differentiation of treatment-induced necrosis from recurrent high-grade glioma, which typically presents with more heterogeneous restricted diffusion and higher perfusion values.
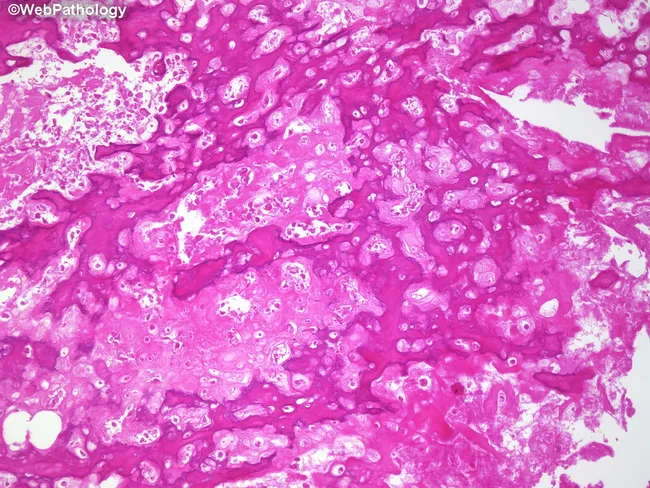
Histopathology, Hematoxylin and Eosin-stained, decalcified bone tumor section from a post-neoadjuvant chemotherapy osteosarcoma surgical resection (limb-sparing) specimen. The slide demonstrates marked sclerosis with dense bony trabeculae separating residual cellular tumor from a necrotic background. Viable tumor cells are scant and dispersed within a predominantly necrotic, fibrous/granulation tissue milieu. Coagulative necrosis is present in focal regions, with extensive cell dropout and replacement by fibrovascular stroma. Cartilage formation may be evident in chondroblastic variants, where chondroid areas show relative chemoresistance. Notable features include minimal viable osteoid-producing malignant cells, scattered hyperchromatic nuclei, and mitotic activity limited to rare foci. The overall tumor bed shows extensive remodeling, suggesting a substantial chemotherapeutic response. The pattern is characterized by sclerosis, osteoid deposition, and broad zones of scar, which can complicate accurate estimation of viable tumor volume. Clinically, this histology is used to assess response to neoadjuvant chemotherapy, an important prognostic determinant in osteosarcoma. The extent of viable tumor correlates with event-free and overall survival and informs potential adjuvant therapy decisions. This image is relevant for educational purposes, pathology practice, tumor board discussions, and research on post-treatment histologic response in pediatric and adult osteosarcoma cohorts. This final assessment guides multidisciplinary care and informs clinical trial eligibility.
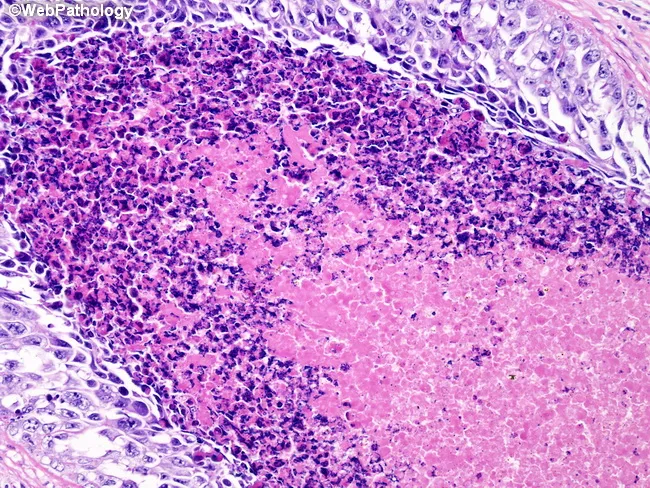
This histopathology image depicts a testicular parenchymal cross-section stained with Hematoxylin and Eosin, viewed under light microscopy. The center displays eosinophilic coagulative necrosis with preserved albeit blurry architectural outlines, surrounded by a dense inflammatory cell infiltrate including lymphocytes and plasma cells. The necrotic zone often undergoes dystrophic calcification, evidenced by granular basophilic to pale pink calcified deposits at the periphery. Notably, intratubular coarse calcification is seen within scarred tubules in the surrounding parenchyma, a pattern associated with burnt-out or regressed germ cell tumor. The viable tumor component, if present, is not conspicuous in this field, supporting regression rather than active embryonal carcinoma. The sample typifies a burnt-out germ cell tumor scenario rather than a primary inflammatory lesion, though eosinophilic necrosis is not pathognomonic for embryonal carcinoma. Clinical significance includes the possibility of regression, calcification, and residual scar; differential diagnoses include burnt-out seminoma or nonseminomatous germ cell tumor. This image provides diagnostic clues for pathologists when correlating histology with tumor markers and imaging studies. Potential clinical use cases include educational illustration of tumor regression, biopsy interpretation, and differential diagnosis in testicular germ cell neoplasia. Educational relevance spans pathology education, urologic oncology, and radiologic-pathologic correlation in burnt-out testicular germ cell neoplasia.
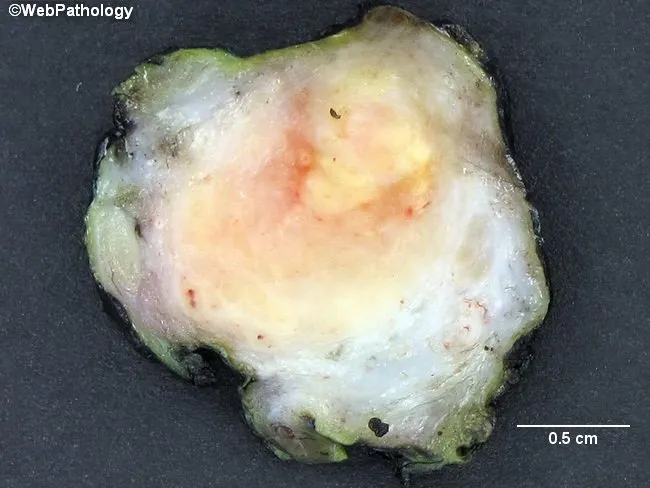
Gross pathology photograph of an enlarged epididymis sectioned in cross-section to reveal a pale, central area of caseous necrosis bordered by dense fibrous tissue. This macroscopic appearance is typical of tuberculous epididymo-orchitis, reflecting granulomatous inflammation with central caseation. The specimen represents epididymal tissue from the male genitourinary tract, captured as a gross cross-section for macroscopic assessment. Peripheral fibrosis surrounds the necrotic center, with granulomatous infiltrate evident at the margins in a pattern compatible with tuberculosis. In tuberculosis, additional involvement of the prostate, kidney, or urinary tract is common, and concomitant pulmonary TB may be present. Clinically, patients may have mild symptoms such as scrotal pain and enlargement rather than overt systemic illness. When microscopic sections are available, histology would show granulomas with caseating necrosis and Langhans-type giant cells. This image is valuable for differential diagnosis of scrotal masses and for guiding TB workup and anti-tuberculous therapy. Scale bar indicates 0.5 cm, highlighting the small size of the specimen despite pronounced gross pathology. This cross-sectional view serves as an educational reference for surgical pathology and radiology-pathology correlation in men’s health. Recognizing tuberculous epididymo-orchitis early reduces diagnostic delay and improves likelihood of targeted antimicrobial treatment. Correlate with patient history and chest imaging.
necrosis versus apoptosis cell death comparison diagram
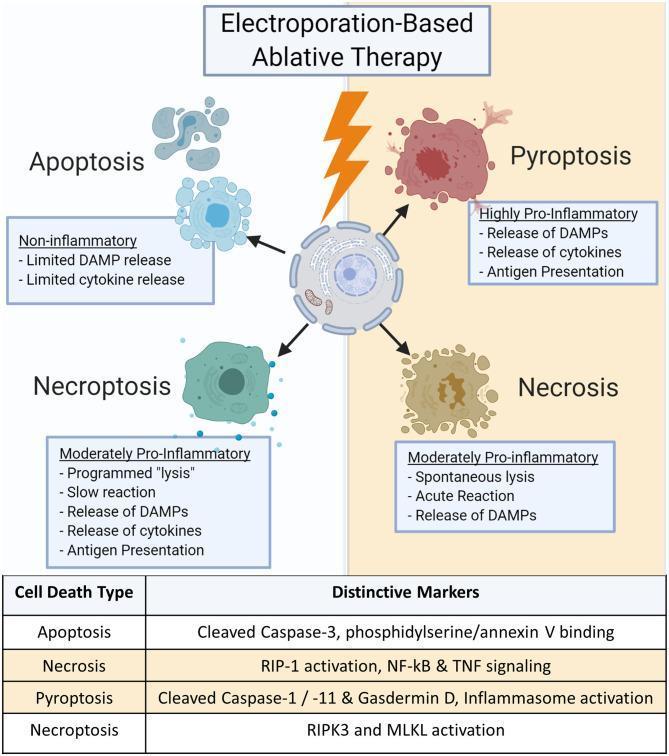
This pathophysiology diagram illustrates the four primary types of cell death initiated by electroporation-based ablative therapy: Apoptosis, Pyroptosis, Necroptosis, and Necrosis. A central cell subjected to an electrical pulse branches into these distinct pathways, categorized by their inflammatory impact and biochemical markers. Apoptosis is described as non-inflammatory with limited DAMP and cytokine release, characterized by cleaved Caspase-3 and annexin V binding. Pyroptosis is highly pro-inflammatory, involving Caspase-1/-11, Gasdermin D, and inflammasome activation, leading to cytokine release and antigen presentation. Necroptosis is a moderately pro-inflammatory, programmed lysis involving RIPK3 and MLKL activation. Necrosis is a moderately pro-inflammatory, spontaneous lysis involving RIP-1, NF-kB, and TNF signaling. The visual contrasts the morphology of each type, from the organized blebbing of apoptosis to the violent rupture of pyroptosis and the acute disintegration of necrosis. A summary table provides a quick reference for the distinctive molecular markers associated with each cellular subroutine, emphasizing the clinical relevance of selecting specific death pathways for effective tumor treatment and immune response modulation.
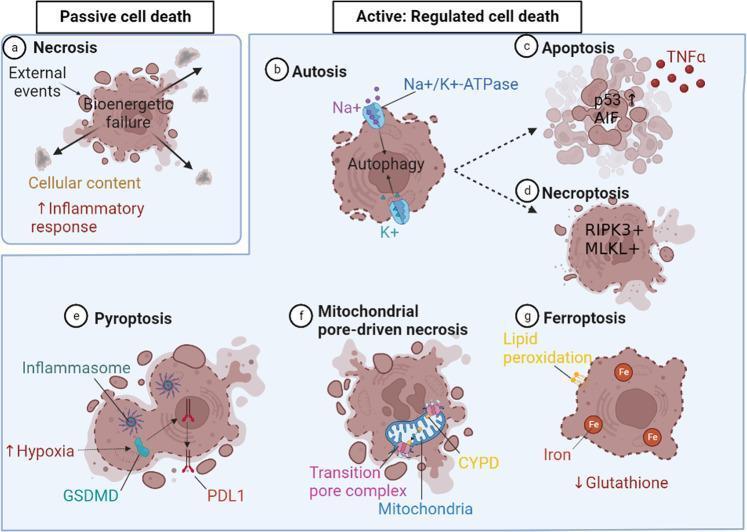
This pathophysiology diagram classifies types of cell death into two primary categories: Passive and Active (Regulated). Under Passive cell death, Necrosis (a) is shown as a result of bioenergetic failure and membrane rupture, leading to the release of cellular contents and an inflammatory response. The Active: Regulated cell death section includes several distinct pathways: Autosis (b), mediated by Na+/K+-ATPase and excess autophagy; Apoptosis (c), regulated by p53, TNFα, and AIF; and Necroptosis (d), involving RIPK3 and MLKL. Additionally, specialized forms of regulated death are depicted: Pyroptosis (e), characterized by hypoxia, inflammasome activation, GSDMD, and PDL1 translocation; Mitochondrial pore-driven necrosis (f), highlighting the transition pore complex and Cyclophilin D (CYPD); and Ferroptosis (g), driven by glutathione deficiency, iron accumulation, and lipid peroxidation. The diagram uses anatomical illustrations of cells to show specific morphological changes such as swelling, membrane blebbing, and organelle dysfunction, providing a comprehensive overview of cellular pathology and signaling pathways.
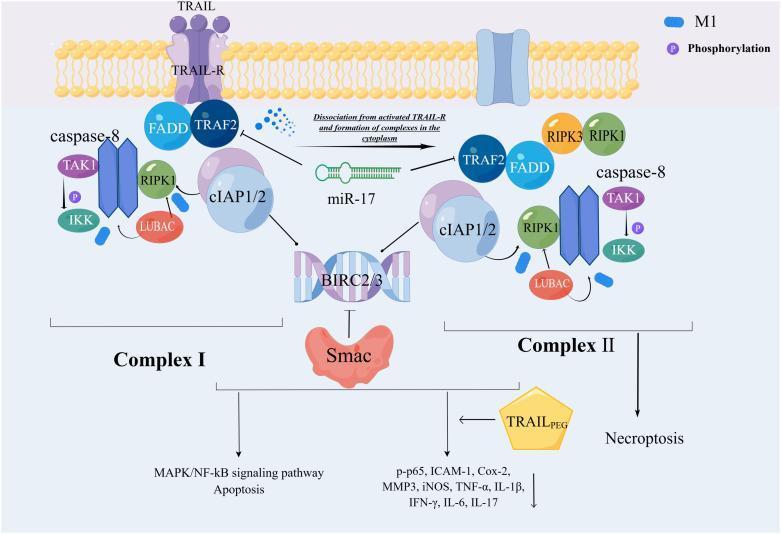
A pathophysiology diagram illustrating the ubiquitin-mediated regulation of the TRAIL-R (tumor necrosis factor-related apoptosis-inducing ligand receptor) cell death signaling pathway. The diagram is divided into membrane-associated signaling (Complex I) and cytoplasmic signaling (Complex II). Complex I is shown bound to the activated TRAIL-R and consists of FADD, TRAF2, RIPK1, cIAP1/2, LUBAC, TAK1, IKK, and caspase-8. It features specific protein modifications including M1-linked ubiquitination (on RIPK1 and LUBAC) and phosphorylation (on TAK1 and IKK), leading to MAPK/NF-kB signaling or apoptosis. Complex II is depicted as a cytoplasmic assembly formed following dissociation from the receptor; it shares the components of Complex I but uniquely includes RIPK3, specifically mediating necroptosis. The diagram also highlights regulatory interactions involving miR-17, the inhibition of Smac by BIRC2/3, and the therapeutic influence of TRAIL-PEG. TRAIL-PEG is shown inhibiting multiple pro-inflammatory markers including p-p65, ICAM-1, Cox-2, and various cytokines (TNF-α, IL-1β, IFN-γ, IL-6, IL-17). This visual resource is designed for advanced immunology or oncology education, focusing on signal transduction, E3 ligase activity, and programmed cell death pathways.
Necrosis
Definition
- Ischemia / loss of oxygen supply
- Microbial toxins and infections
- Burns, chemical injury, physical trauma
- Enzymatic autodigestion (e.g., pancreatitis)
Pathophysiology - What Happens at the Cell Level
- Irreversible mitochondrial dysfunction - failure of oxidative phosphorylation and ATP generation
- Profound membrane dysfunction - loss of plasma membrane and lysosomal membrane integrity
Clinical relevance: This membrane leakage is the basis for serum biomarkers - cardiac-specific troponins detectable as early as 2 hours after myocardial necrosis; transaminases in hepatocyte necrosis; alkaline phosphatase isoforms in bile duct injury.
Morphological Features (H&E)
Cytoplasmic Changes
- Increased eosinophilia - denatured cytoplasmic proteins bind eosin; loss of basophilic RNA
- Glassy, homogeneous appearance - loss of glycogen particles
- Vacuolated, "moth-eaten" cytoplasm - enzymatic digestion of organelles
- Myelin figures (whorled phospholipid precipitates) may appear
Nuclear Changes (3 patterns)
| Pattern | Description |
|---|---|
| Karyolysis | Basophilia fades - DNA digested by endonucleases; nucleus gradually disappears |
| Pyknosis | Nuclear shrinkage + increased basophilia; chromatin condenses into dark shrunken mass |
| Karyorrhexis | Pyknotic nucleus fragments into pieces |
Morphological Patterns of Tissue Necrosis
1. Coagulative Necrosis
- Mechanism: Protein denaturation (including enzymes) preserves the dead tissue architecture
- Appearance: Firm texture; eosinophilic anucleate "ghost cells" persist for days/weeks
- Cause: Ischemia (infarction) in all solid organs except the brain
- Example: Myocardial infarction
2. Liquefactive Necrosis
- Mechanism: Enzymatic digestion completely dissolves the dead cells → viscous liquid
- Appearance: Creamy yellow pus (when infected); cystic cavity
- Cause: Bacterial/fungal infections (leukocyte enzymes); hypoxic brain infarcts (exception to rule above)
- Example: Brain infarct, abscess
3. Caseous Necrosis
- Mechanism: Neither coagulative nor liquefactive; structureless granular debris
- Appearance: Friable, cheese-like ("caseous"), yellow-white gross appearance; amorphous pink granular material on H&E; tissue architecture obliterated
- Cause: Characteristically tuberculosis; also other mycobacterial/fungal infections
- Hallmark: Surrounded by a granuloma (epithelioid macrophages)
4. Fat Necrosis
- Mechanism: Lipase-mediated destruction of adipose tissue
- Appearance: Chalky white lesions (saponification) - released fatty acids bind calcium; shadowy outlines of necrotic fat cells + basophilic calcium deposits + inflammation
- Cause: Abdominal trauma, acute pancreatitis (leakage of pancreatic lipases)
5. Fibrinoid Necrosis
- Mechanism: Immune complex deposition + plasma protein leakage into vessel walls
- Appearance: Bright pink, amorphous "fibrin-like" material in vessel walls on H&E (detected only microscopically)
- Cause: Immune vasculitis, severe hypertension, antigen-antibody deposits in vessel walls
6. Gangrenous Necrosis
- Not a distinct cell death pattern - clinical term for coagulative necrosis of a limb (usually lower leg) from ischemia, involving multiple tissue planes
- Dry gangrene: Coagulative predominant
- Wet gangrene: Superimposed bacterial infection causes liquefactive component
Necrosis vs. Apoptosis
| Feature | Necrosis | Apoptosis |
|---|---|---|
| Trigger | Severe, uncontrolled injury | Physiological or regulated signals |
| Membrane | Disrupted/ruptured | Intact (blebbing) |
| Cell size | Swells | Shrinks |
| Inflammation | Yes - DAMPs trigger response | No - phagocytosed cleanly |
| DNA | Random degradation | Laddering (internucleosomal cleavage) |
| Energy | Passive (no ATP required) | Active (requires ATP/caspases) |
| Fate of contents | Released into extracellular space | Packaged into apoptotic bodies |
Histology Example
Caseous Necrosis Example
Outcomes of Necrotic Cells
- Enzymatic digestion and phagocytosis by leukocytes
- Replacement by myelin figures (phospholipid whorls) - phagocytosed or further degraded
- Dystrophic calcification - fatty acid residues bind calcium salts → calcified deposits in dead tissue