
Full brain and their important areas and clinical questions asked from them in spotter viva..full details with image visualization
brain lobes anatomy labeled diagram cerebral cortex
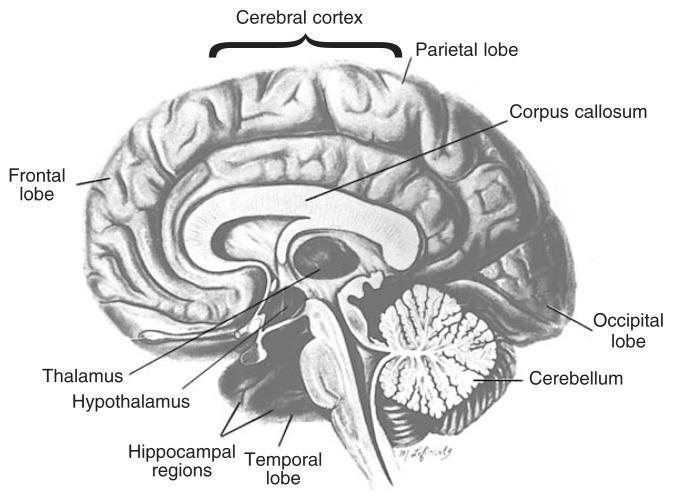
A grayscale anatomical diagram of the human brain shown in a sagittal section, illustrating the major structural components and lobes. The diagram highlights the cerebral cortex as the outer convoluted layer, further subdivided into the frontal lobe (anterior), parietal lobe (superior), occipital lobe (posterior), and temporal lobe (inferior/lateral). Deep structures within the brain are clearly labeled, including the corpus callosum superior to the lateral ventricle area, the thalamus and hypothalamus in the midbrain region, and the hippocampal regions located deep within the temporal lobe. The cerebellum is depicted at the posterior and inferior aspect, beneath the occipital lobe, showing its characteristic folia. This educational visual is designed to demonstrate neuroanatomical relationships and is contextually used to identify regions susceptible to alcoholism-related abnormalities, such as prefrontal cortex shrinkage and subcortical damage.
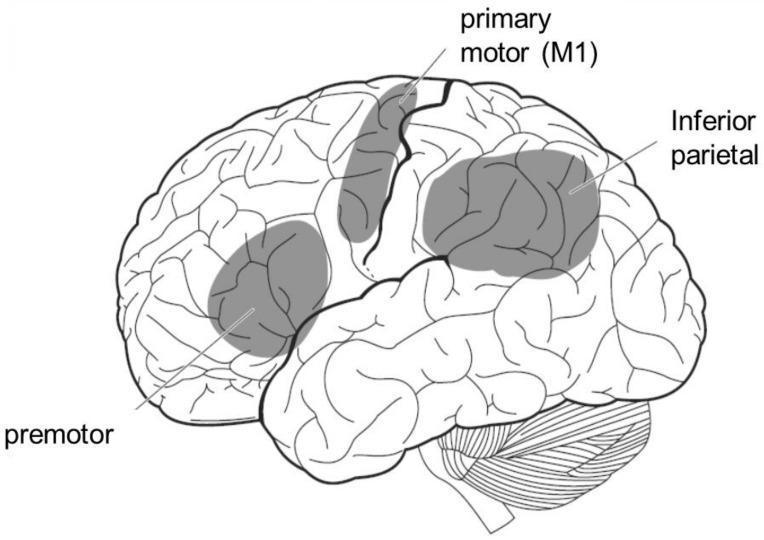
This anatomical diagram provides a lateral view of the human brain, specifically illustrating the cortical regions associated with the mirror neuron system. The line drawing highlights three key functional areas using shaded gray overlays and text labels: the premotor area in the frontal lobe, the primary motor cortex (M1) along the precentral gyrus, and the inferior parietal lobule in the parietal lobe. The diagram clearly depicts the complex surface anatomy of the cerebral cortex, including its gyri and sulci, which define the boundaries of these functional regions. The cerebellum is also visible inferiorly to the occipital and temporal lobes. This illustration is designed to teach the neuroanatomical basis of action-observation processing, demonstrating how the brain bridges visual perception of others' actions with its own motor representation. It is an educational resource suitable for neuroscience and clinical neurology, focusing on sensory-motor integration and the physiological mechanisms of social cognition.
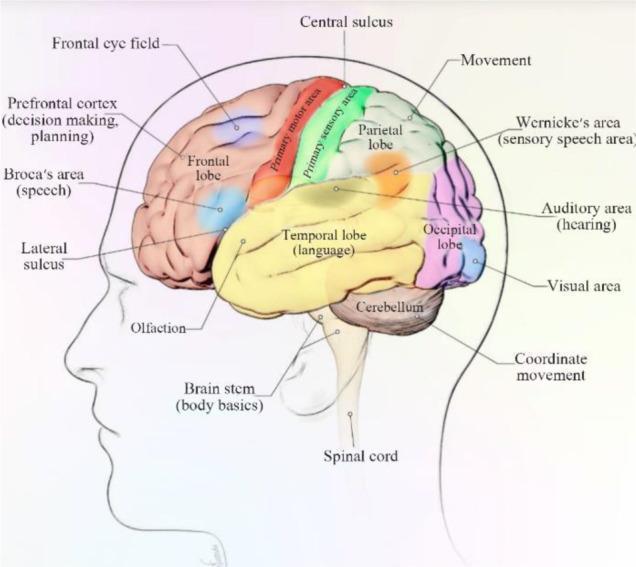
Anatomical diagram of the human brain from a lateral view, illustrating the four major lobes of the cerebral cortex and their functional localizations. The frontal lobe (tan) is shown at the anterior aspect, containing the prefrontal cortex (decision making), Broca's area (speech), and the frontal eye field. Posterior to the central sulcus is the parietal lobe (green), which houses the primary sensory area. The temporal lobe (yellow) is situated inferior to the lateral sulcus, highlighting areas for language, olfaction, and hearing. The occipital lobe (purple) is located at the posterior pole, containing the primary visual area. Key neuroanatomical landmarks labeled include the central and lateral sulci, which define lobar boundaries. The diagram also identifies the primary motor area (red) for movement, Wernicke's area for sensory speech at the temporal-parietal junction, and subcortical structures including the cerebellum (coordinate movement) and brain stem (body basics), transitioning into the spinal cord.
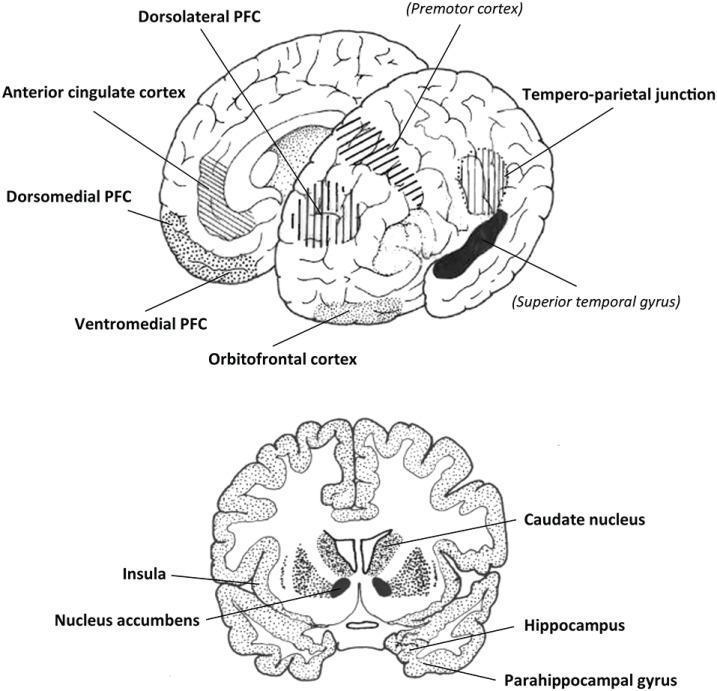
This anatomical diagram presents two schematic views of the human brain highlighting neuroanatomical regions associated with social cognition, reward processing, and the oxytocinergic system. The top illustration provides a combined medial and lateral view of the cerebral hemisphere. Labeled regions include the dorsolateral, dorsomedial, and ventromedial prefrontal cortex (PFC), as well as the anterior cingulate cortex and orbitofrontal cortex. The diagram also identifies the tempero-parietal junction, superior temporal gyrus, and premotor cortex. Shaded patterns distinguish specific cortical zones. The bottom illustration shows a coronal cross-section of the brain, depicting deep subcortical and limbic structures. Key labels include the caudate nucleus, nucleus accumbens, insula, hippocampus, and parahippocampal gyrus. The diagram effectively maps the spatial relationships between the prefrontal lobes, the temporal lobe, and the basal ganglia, illustrating the neural networks involved in complex human behaviors such as empathy, trust, and musicality.
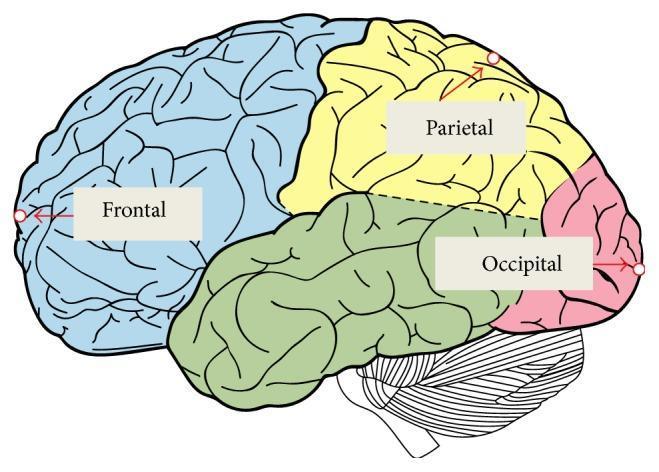
This anatomical diagram provides a lateral view of the human brain, illustrating the major cerebral lobes and their spatial relationships. The diagram uses distinct color-coding to differentiate the lobes: the frontal lobe (light blue), the parietal lobe (yellow), the temporal lobe (green), and the occipital lobe (pink). The surface of the cerebral cortex is depicted with highly convoluted patterns representing the characteristic gyri and sulci. Three anatomical landmarks are indicated with red arrows and white circular nodes, corresponding to specific regions used for intracranial pressure monitoring or finite element modeling: the anterior frontal pole, the superior parietal cortex, and the posterior occipital pole. Below the temporal and occipital lobes, the cerebellum is visible with its distinct folia pattern, alongside the upper portion of the brainstem. The illustration serves as a reference for neuroanatomical segmentation, often utilized in biomechanical simulations and functional magnetic resonance imaging (fMRI) studies to investigate pressure distribution and brain injury criteria.
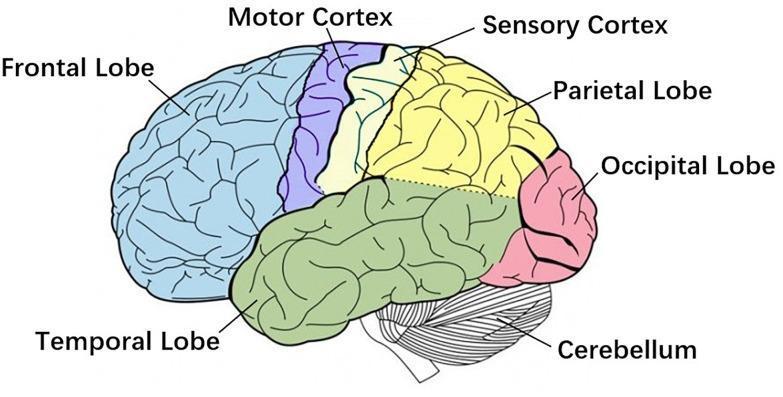
This medical anatomical diagram provides a lateral view of the human brain, utilizing color-coding to delineate primary functional regions and lobes. The frontal lobe is highlighted in light blue at the most anterior position. Progressing posteriorly, the diagram identifies the motor cortex (purple) and the sensory cortex (yellow), which are separated by the central sulcus. The parietal lobe (yellow) follows posteriorly to the sensory cortex, while the occipital lobe is marked in pink at the most posterior pole. The temporal lobe is shaded in green, situated inferior to the frontal and parietal lobes. Below the occipital and temporal regions, the cerebellum is depicted with a distinct striated texture, contrasting with the gyri and sulci patterns of the cerebral cortex. The illustration is designed to teach regional brain anatomy and the spatial relationships essential for understanding corticomuscular coherence (CMC), movement planning, and tactile processing. The labels and color differentiation emphasize the distinct boundaries of these functionally specialized neural structures.
brainstem anatomy pons medulla midbrain labeled
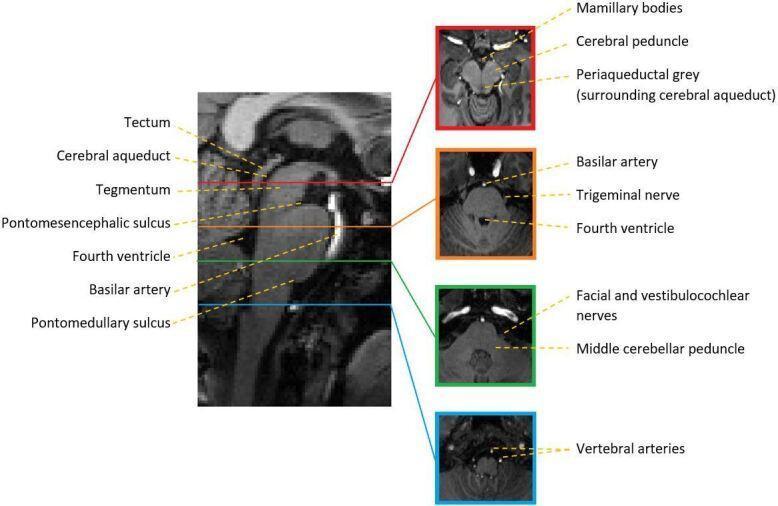
This diagnostic image provides a comprehensive anatomical overview of the human brainstem using T1-weighted MRI. On the left, a mid-sagittal section highlights the vertical arrangement of the midbrain, pons, and medulla. Key landmarks labeled include the tectum, cerebral aqueduct, tegmentum, and the fourth ventricle. Boundary demarcations such as the pontomesencephalic sulcus and the pontomedullary sulcus are clearly identified. To the right, four corresponding axial cross-sections are presented to illustrate internal and adjacent structures at specific levels. The superior axial view (midbrain) labels the mamillary bodies, cerebral peduncle, and periaqueductal grey. The second view (upper pons) identifies the basilar artery, trigeminal nerve, and fourth ventricle. The third view (lower pons/junction) shows the facial and vestibulocochlear nerves alongside the middle cerebellar peduncle. The most caudal axial view (medulla) highlights the vertebral arteries. This educational graphic is designed to teach brainstem spatial relationships, neuroanatomy, and neuroradiological landmarks for clinical localization.
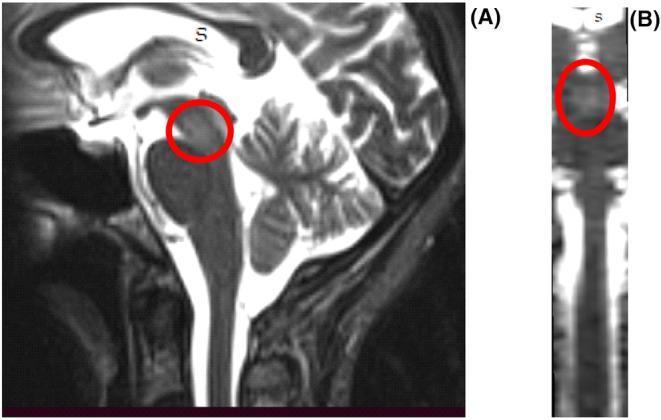
This diagnostic image consists of T2-weighted magnetic resonance imaging (MRI) of the brain and brainstem. (A) Sagittal view demonstrates the brainstem anatomy, including the midbrain, pons, medulla oblongata, and cervical spinal cord. A red circle highlights an area of scattered hyperintensity in the midbrain, specifically within its anterior aspect. Surrounding landmarks include the cerebellum posteriorly and hyperintense cerebrospinal fluid within the ventricular system and subarachnoid space. (B) Coronal reconstruction focuses on the brainstem and upper spinal cord, with a red circle indicating centrally located hyperintensities within the midbrain. The visible signal changes are consistent with a demyelinating process or neuroinflammatory condition. This visual material is intended for intermediate to advanced medical learners studying neuroradiology, specifically focusing on identifying brainstem lesions and interpreting signal abnormalities in demyelinating diseases such as multiple sclerosis or neuromyelitis optica spectrum disorder (NMOSD).
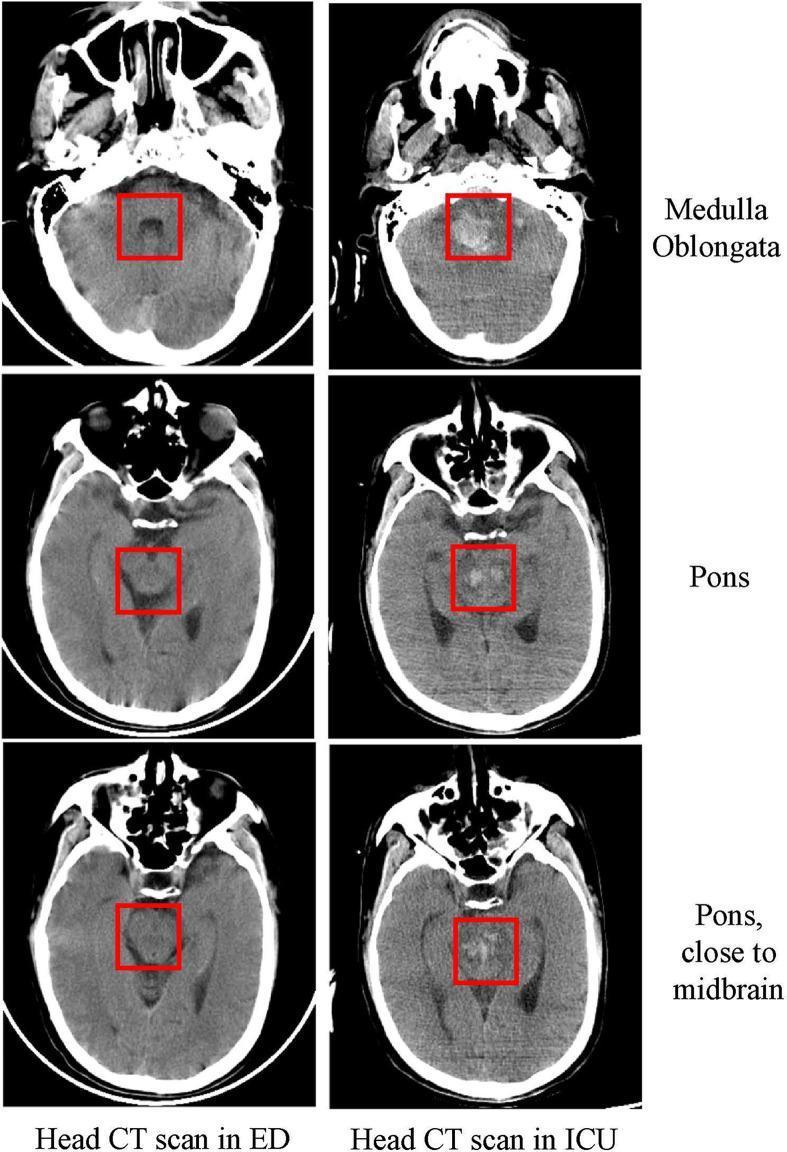
This diagnostic image is a side-by-side comparison of axial non-contrast head CT scans from the emergency department (ED) and the intensive care unit (ICU), illustrating disease progression over a five-day interval. The comparison highlights three brainstem levels: the medulla oblongata, the pons, and the pons near the midbrain transition. In the initial ED scans (left column), the brainstem structures appear relatively normal with homogenous tissue density and preserved anatomy. In contrast, the subsequent ICU scans (right column) demonstrate significant interval changes characterized by new, ill-defined hyperdense areas within the red-boxed regions of interest. These hyperdensities are consistent with acute intracranial hemorrhage (brainstem hemorrhage) involving the medulla oblongata and extending superiorly into the pons. This progression represents a severe complication of encephalitis, such as that caused by Epstein-Barr virus (EBV). The visual evidence serves to teach the radiological manifestations of rapid neurological deterioration and secondary hemorrhagic transformation in the setting of severe central nervous system infection.
limbic system hippocampus amygdala anatomy diagram
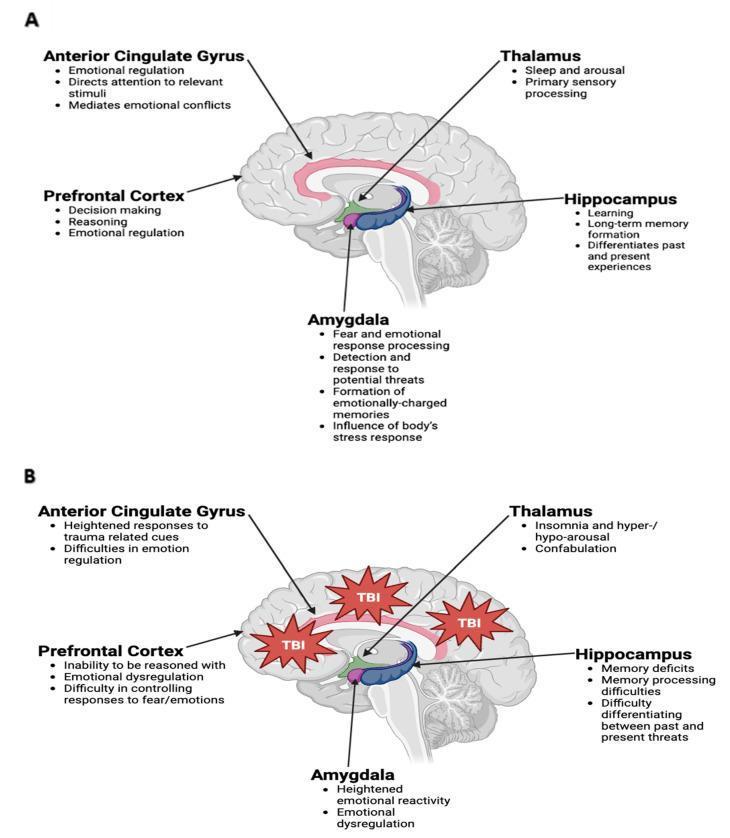
Educational comparison diagram illustrating the functional anatomy of the limbic system in health and post-traumatic brain injury (TBI). Part A (Normal State) displays a sagittal cross-section of the human brain, identifying five key structures: the anterior cingulate gyrus (emotional regulation, attention), prefrontal cortex (decision-making, reasoning), amygdala (fear processing, threat detection), thalamus (sleep, arousal), and hippocampus (learning, long-term memory). Each structure is color-coded and spatially mapped within the medial cerebrum. Part B (Post-TBI State) utilizes the same anatomical template but includes red 'TBI' impact icons localized to the frontal and parietal regions. This section details pathological functional changes, such as emotional dysregulation in the prefrontal cortex and amygdala, heightened trauma responses in the anterior cingulate gyrus, sleep disturbances (insomnia) in the thalamus, and memory deficits or threat differentiation difficulties in the hippocampus. The diagram serves as a clinical education tool to explain the pathophysiology of neuropsychiatric sequelae, such as PTSD, following physical or psychological trauma.
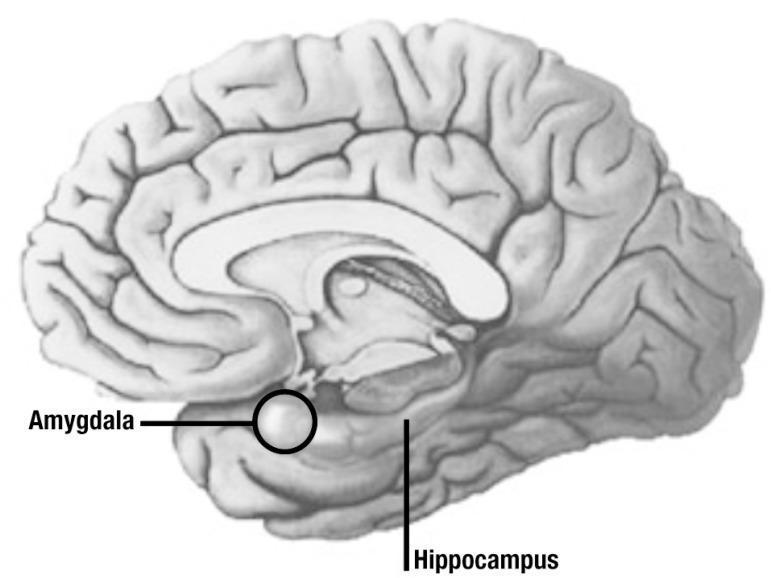
This grayscale anatomical diagram illustrates a medial sagittal view of the human brain, focusing on the structures of the limbic system. The illustration highlights the spatial relationship between the amygdala and the hippocampus within the temporal lobe. The amygdala is indicated by a black circle in an anterior position, while the hippocampus is located immediately posterior and slightly inferior to it, following the curve of the fornix. Surrounding neuroanatomical landmarks include the corpus callosum superiorly, the cingulate gyrus, and the cerebral cortex with clearly defined gyri and sulci. This educational visual is designed to demonstrate the functional and anatomical proximity of these two structures, which are critical for processing emotions (fear conditioning) and memory formation. The diagram provides clinical context for neurobiology and psychiatry students studying the limbic system's role in behavioral responses and cognitive processing.

This anatomical diagram provides a schematic representation of the fronto-temporo-limbic network across two neuroanatomical perspectives. The top register displays a lateral view of the human brain, highlighting the Superior Temporal Gyrus (STG) in pink. The lower register illustrates a medial view, identifying three key structures: the Medial Fronto-Orbital Gyrus (mFOG) in green, the Amygdala in red, and the Hippocampus in blue. Black dashed and solid arrows represent structural or functional connectivity pathways between these regions. Spatially, the mFOG is positioned anteriorly, the amygdala is situated at the anterior tip of the temporal lobe, and the hippocampus extends posteriorly from the amygdala. This visual summarizes the neuroanatomical circuit essential for social-emotional processing, facilitating an understanding of the relationship between the prefrontal cortex, temporal lobe, and limbic system. It is designed for medical education regarding brain connectivity and regional functional anatomy.
cerebral cortex motor sensory homunculus map
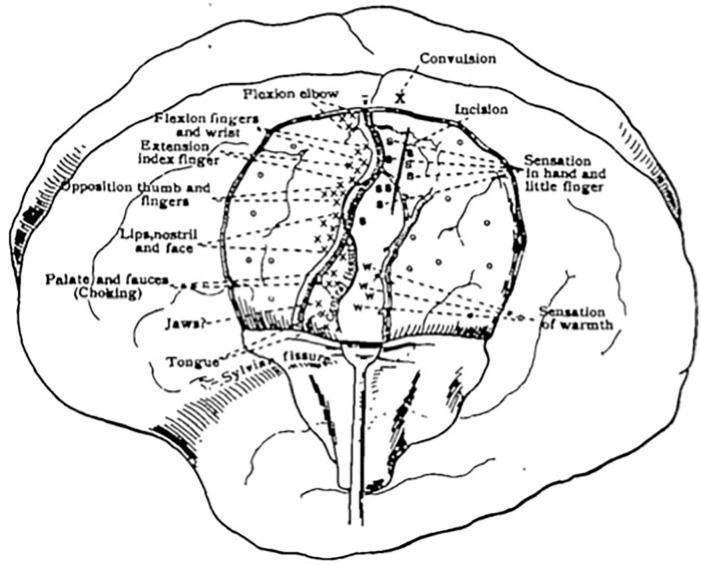
This historical anatomical diagram illustrates a cortical map of the human brain, specifically documenting findings from direct electrical stimulation (DES) during an early 20th-century awake craniotomy. The sketch depicts a lateral view of the cerebral cortex with a prominent Sylvian fissure and central sulcus area. The diagram functions as an early somatotopic map, distinguishing between motor and sensory localization. On the left (pre-central gyrus), motor responses are labeled, including flexion of the elbow, fingers, and wrist, extension of the index finger, and opposition of the thumb. Inferior regions map the lips, nostril, face, palate, jaws, and tongue. On the right (post-central gyrus), sensory responses are recorded, specifically noting sensations in the hand, little finger, and sensations of warmth. Annotations use symbols like 'X', 'B', and 'W' connected by dashed lines to indicate precise stimulation points on the cortical surface. Additional clinical markings include locations for 'Convulsion' and 'Incision'. This diagram is a foundational representation of functional neuroanatomy and the development of the motor and sensory homunculus in neurosurgery.

An anatomical illustration and 3D artistic model depicting a comparative visualization of the motor homunculus. The larger, flesh-colored figure represents the Upper Motor Neuron (UMN) homunculus, traditionally based on the cortical mapping of the primary motor cortex. It features massive hands, large feet, and prominent facial structures, illustrating the high density of cortical neurons dedicated to fine motor control in these regions. Juxtaposed to it is a smaller, blue-colored figure representing the Lower Motor Neuron (LMN) homunculus. The LMN homunculus is scaled relative to the UMN counterpart, with its bodily proportions determined by alpha motor neuron densities within the spinal cord and brainstem. This comparative diagram highlights the differences in somatotopic representation between the cerebral motor system and the final common pathway. The visual serves as a neuroanatomical educational tool to demonstrate how motor innervation complexity varies across different levels of the central nervous system, emphasizing the disproportionate neural representation of the hands and face in human motor control.
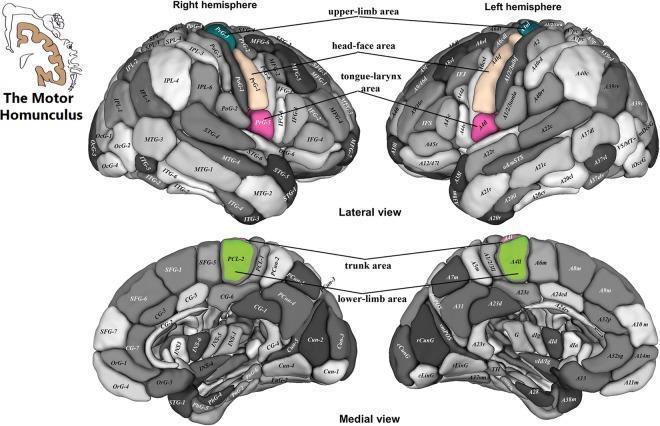
This medical anatomical diagram illustrates the regions of interest (ROIs) within the primary motor cortex following the motor homunculus organization in the human brain. The graphic displays four cortical maps representing both the right and left hemispheres from lateral and medial perspectives. The color-coded ROIs identify functional zones: the teal area (PrG-3) corresponds to the upper limb; the tan area (PrG-1) represents the head and face; the pink area (PrG5) indicates the tongue and larynx; and the green area (PCL-2/A4l) within the paracentral lobule corresponds to the trunk and lower limb. In the lateral view, the homunculus follows a superior-to-inferior progression from upper limb to tongue-larynx along the precentral gyrus. The medial view highlights the continuation of the motor map into the paracentral lobule for the lower extremities. The surrounding cortical parcellations are labeled with alphanumeric codes (e.g., SFG, MFG, IFG) denoting specific gyri and sulci. This visualization serves as a neuroanatomical reference for motor somatotopy and is used in clinical research to assess cortical thinning in neurodegenerative conditions like Amyotrophic Lateral Sclerosis (ALS).
basal ganglia thalamus internal capsule anatomy cross section
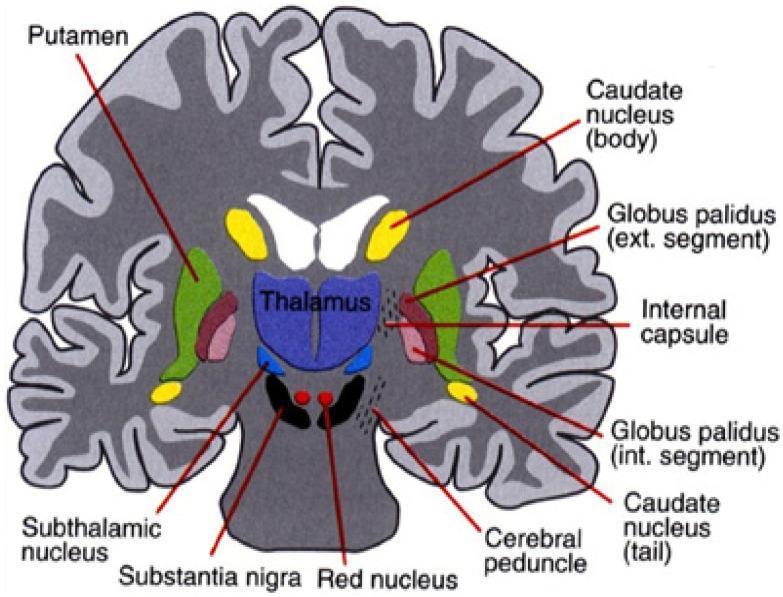
This medical illustration presents a coronal cross-section of the human brain, focusing on the neuroanatomical organization of the basal ganglia and related subcortical structures. The central feature is the thalamus, depicted in blue. Positioned laterally to the thalamus is the internal capsule, which serves as a landmark separating the thalamus from the lentiform nucleus, composed of the green-shaded putamen and the internal (pink) and external (maroon) segments of the globus pallidus. The caudate nucleus is visualized in yellow, with its body located superior-lateral to the thalamus and its tail visible at a lower lateral position. In the midbrain region inferior to the thalamus, the diagram highlights the subthalamic nucleus (light blue), the substantia nigra (black), and the red nucleus (red circles). Other identified structures include the cerebral peduncles and the surrounding cerebral cortex. This diagram is designed for educational use in neuroanatomy and neurology, illustrating the spatial relationships within the cortico-striatal-thalamo-cortical circuits involved in motor control and cognitive function.
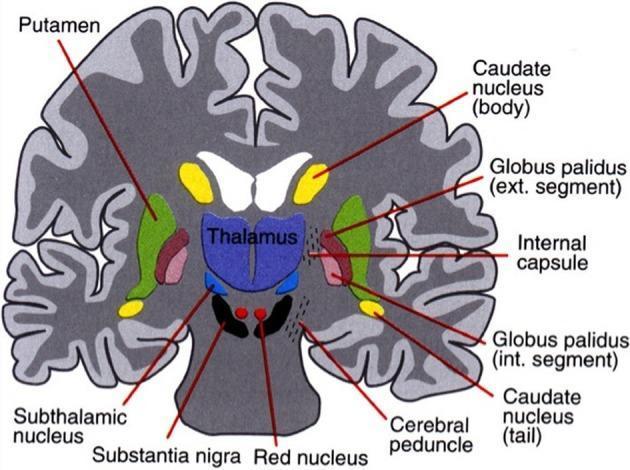
This medical illustration presents a labeled coronal section of the human brain, focusing on the anatomical organization and spatial relationships of the basal ganglia and associated subcortical structures. The diagram depicts the striatum, comprising the caudate nucleus (body and tail) and the putamen, which is situated laterally to the globus pallidus (external and internal segments). The internal capsule is shown as a white matter tract separating the caudate body from the lentiform nucleus. Centrally, the thalamus is positioned superior to the midbrain structures. Deep to the thalamus, the subthalamic nucleus is identified, sitting immediately superior to the substantia nigra. The red nucleus and cerebral peduncles are also visualized within the midbrain region. The use of distinct color-coding—green for the putamen, yellow for the caudate, and blue for the thalamic regions—enhances the educational value for understanding the functional anatomy of motor control circuits and the cortico-striato-thalamo-cortical loops relevant to neurology and neurosurgery.
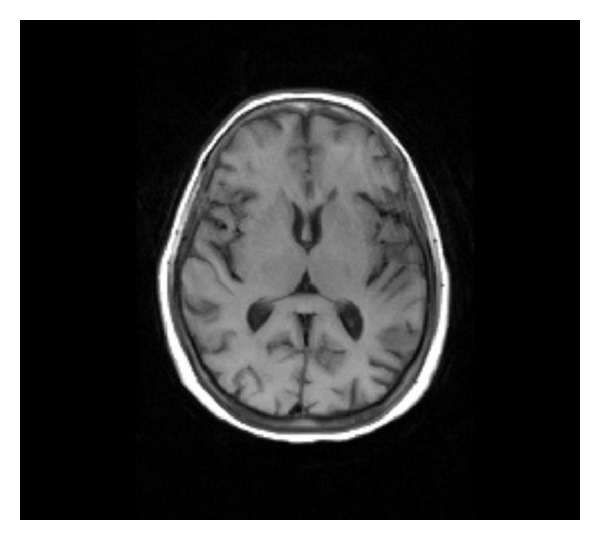
**Imaging Modality:** Magnetic Resonance Imaging (MRI); T1-weighted sequence. **Anatomical Region:** Axial section of the brain at the level of the basal ganglia and thalamus. **Key Landmarks:** Visible structures include the caudate nucleus, putamen, globus pallidus, and thalamus. The internal capsule (anterior and posterior limbs), the frontal horns of the lateral ventricles, and the third ventricle are well-defined. **Observed Findings:** The image demonstrates normal neuroanatomical architecture. The basal ganglia structures exhibit typical T1-weighted signal intensity and morphology. There is clear differentiation between the gray matter and white matter (e.g., the hyperintense internal capsule relative to the surrounding deep gray nuclei). The ventricular system is non-dilated and midline, with no evidence of mass effect, midline shift, or focal signal abnormalities within the deep nuclei. **Diagnostic Features:** Homogeneous signal across the lentiform nuclei and thalami bilaterally. Sulcal patterns and cortical thickness appear unremarkable for this slice level. This image serves as a baseline representation of normal intracranial anatomy on a T1-weighted axial MRI.
internal capsule stroke hemiplegia anatomy
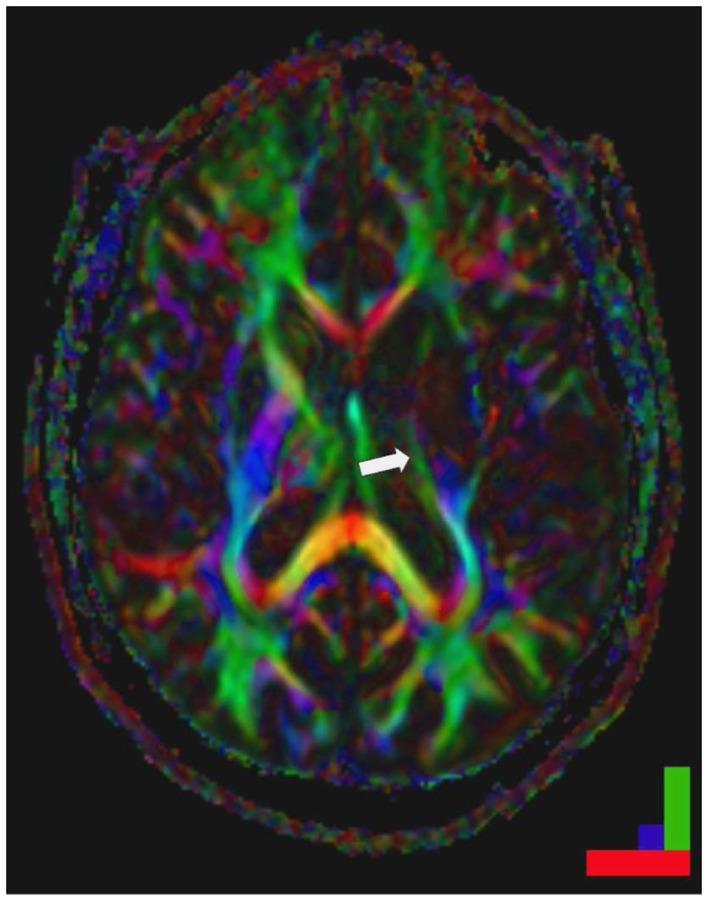
**Imaging Modality:** Diffusion Tensor Imaging (DTI) color map, axial cross-section. **Anatomical Region:** Cerebrum at the level of the basal ganglia and internal capsule. **Observed Pathology:** Striatocapsular stroke (Type II.1). There is a focal area of signal loss and structural disruption involving the posterior limb of the left internal capsule (indicated by a white arrow). **Characteristic Visual Features:** * **Directional Coding:** The image utilizes standard DTI color-coding: green for anteroposterior (fronto-occipital) diffusion, red for mediolateral (right-left) diffusion, and blue for craniocaudal (dorso-ventral) diffusion. * **White Matter Integrity:** In the right hemisphere, the internal capsule and corona radiata appear intact with bright, well-defined directional colors. In the left hemisphere, there is a distinct interruption of the blue-coded fibers (descending motor tracts) within the posterior limb of the internal capsule. * **Lesion Distribution:** The disruption is localized to the deep subcortical white matter, specifically affecting the corticospinal tract pathways. **Clinical Significance:** The complete destruction of the posterior limb of the internal capsule in this DTI map serves as a neuroanatomical correlate for persistent hemiplegia following a striatocapsular infarct.
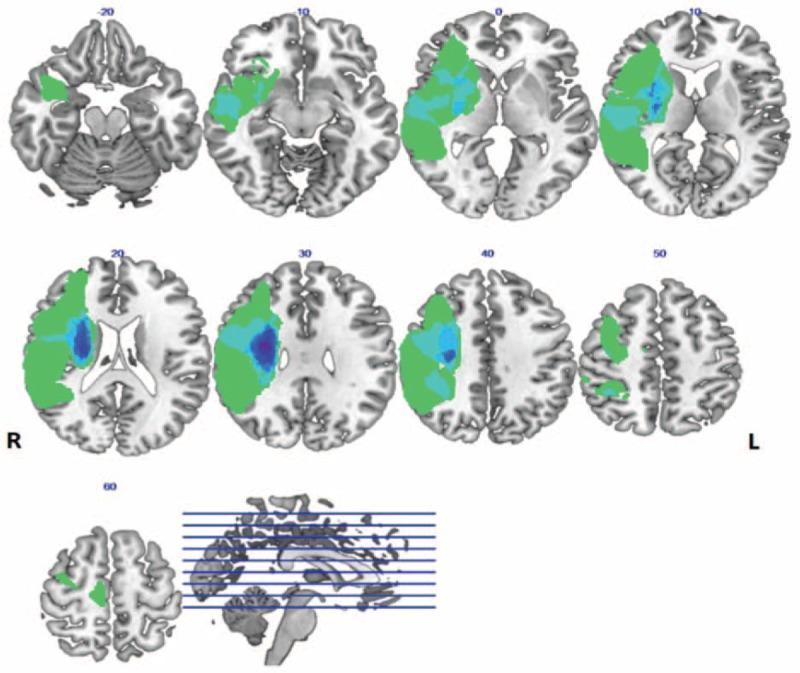
This diagnostic image displays a series of neuroanatomical maps showing lesion distribution across a cohort of stroke patients with left hemiplegia. The visual data is presented through nine axial slices and one sagittal reference image, utilizing color-coded heat maps superimposed on a standard brain template. The color gradient represents lesion frequency, with green indicating low overlap and darker blue indicating areas of high lesion density across the patient group. The maps demonstrate that lesions are primarily lateralized to the right hemisphere, with the most significant overlap concentrated in the internal capsule and adjacent deep subcortical structures (notably visible in axial slices at coordinates 20 and 30). The distribution extends from the level above the cerebellum through various cortical layers (coordinates -20 to 60). Anatomical landmarks, including the lateral ventricles and basal ganglia, provide context for the subcortical localization of the ischemic damage. This visualization is used in neuroimaging research to correlate specific structural damage within motor pathways to clinical manifestations like hemiplegia.
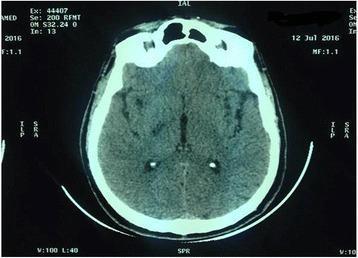
This diagnostic image is an axial non-contrast computed tomography (CT) scan of the brain. The scan displays the anatomy at the level of the basal ganglia and internal capsules. A focal area of subtle hypodensity is observed in the region of the right internal capsule, consistent with an acute ischemic stroke. The surrounding cortical gray matter and white matter differentiation are largely preserved, though there is a faint loss of definition in the affected territory. The ventricular system, including the third ventricle and the posterior horns of the lateral ventricles, appears normal in size and position with no evidence of midline shift or mass effect. The calvarium and surrounding scalp soft tissues are intact, and the visualized paranasal sinuses show normal aeration. This image serves as a clinical example of an early-stage lacunar or small territory infarct in a patient presenting with neurological deficits, illustrating the importance of CT in identifying parenchymal density changes in the acute stroke setting.
🧠 BRAIN: Important Areas & Clinical Spotter/Viva Questions
OVERVIEW DIAGRAM
1. FRONTAL LOBE
Important Areas:
| Area | Location | Function |
|---|---|---|
| Primary Motor Cortex | Precentral gyrus | Voluntary movement |
| Premotor Cortex | Anterior to motor cortex | Planning movements |
| Prefrontal Cortex | Most anterior | Personality, judgment, working memory |
| Broca's Area | Inferior frontal gyrus (dominant hemisphere - usually left) | Motor/expressive speech production |
| Frontal Eye Field | Brodmann area 8 | Voluntary conjugate gaze |
Motor Homunculus:
⚡ Spotter/Viva Questions - Frontal Lobe:
Broca's (Expressive/Non-fluent) Aphasia - Patient understands speech but cannot speak fluently. Output is slow, effortful, telegraphic. Comprehension is relatively preserved. Patient is AWARE of the deficit (frustrated).
Left inferior frontal gyrus - Brodmann areas 44 and 45 (pars opercularis and pars triangularis)
Contralateral upper motor neuron (UMN) weakness - spastic hemiplegia, hyperreflexia, Babinski sign +ve
Prefrontal cortex (frontal lobe). Seen in bifrontal lesions - e.g., Pick's disease, frontal meningioma, bilateral watershed infarcts. Features: apathy OR disinhibition, perseveration, utilization behavior, urinary incontinence.
Frontal Eye Field (area 8) - lesion causes ipsilateral gaze deviation ("eyes look at the stroke"). Contrast with pontine lesion - eyes deviate AWAY from lesion.
Paracentral lobule (medial surface of frontal lobe) - often seen in anterior cerebral artery (ACA) stroke or parasagittal meningioma.
2. PARIETAL LOBE
Important Areas:
| Area | Location | Function |
|---|---|---|
| Primary Somatosensory Cortex | Postcentral gyrus (S1) | Touch, pain, temperature, proprioception |
| Secondary Somatosensory (S2) | Parietal operculum | |
| Superior Parietal Lobule | Brodmann 5, 7 | Spatial processing, skilled movements |
| Inferior Parietal Lobule | Angular gyrus (39) + Supramarginal gyrus (40) | Language, reading, calculation |
| Wernicke's Area | Posterior superior temporal + supramarginal gyrus (dominant) | Language comprehension |
⚡ Spotter/Viva Questions - Parietal Lobe:
Right (non-dominant) parietal lobe - Non-dominant parietal syndrome:
- Contralateral neglect (left-sided neglect with right parietal lesion)
- Dressing apraxia
- Constructional apraxia
- Anosognosia (unaware of disability)
Angular gyrus (dominant - usually left) parietal lobe. Tetrad:
- Acalculia
- Agraphia (without alexia)
- Finger agnosia
- Left-right disorientation Mnemonic: AAFL | Caused by dominant inferior parietal lobe lesion (angular gyrus, Brodmann area 39)
Inability to recognize objects by touch (with eyes closed) despite intact primary sensation. Lesion in the contralateral parietal cortex (postcentral gyrus/S1)
Same medial-to-lateral arrangement as motor cortex: Leg (medial paracentral) → Trunk → Arm → Face (lateral)
3. TEMPORAL LOBE
Important Areas:
| Area | Location | Function |
|---|---|---|
| Primary Auditory Cortex | Heschl's gyri (transverse temporal gyri) | Hearing |
| Wernicke's Area | Posterior superior temporal gyrus (dominant) | Speech comprehension |
| Hippocampus | Medial temporal lobe | Declarative memory (new memory formation) |
| Amygdala | Anterior medial temporal | Fear, emotion, emotional memory |
| Parahippocampal gyrus | Medial temporal | Memory consolidation |
| Uncus | Anteromedial temporal | Smell (uncinate fits - olfactory aura) |
⚡ Spotter/Viva Questions - Temporal Lobe:
Receptive/Fluent/Sensory aphasia - Lesion in Wernicke's area (Brodmann area 22, posterior superior temporal gyrus).
- Speech is fluent but meaningless (paraphasia, jargon)
- Comprehension is severely impaired
- Patient is UNAWARE of deficit
- Reading and writing also impaired
| Feature | Broca's | Wernicke's |
|---|---|---|
| Location | Inferior frontal gyrus | Posterior superior temporal gyrus |
| Fluency | Non-fluent | Fluent (jargon) |
| Comprehension | Intact | Impaired |
| Repetition | Impaired | Impaired |
| Awareness | Aware | UNAWARE |
| Artery | MCA (upper division) | MCA (lower division) |
Lesion of arcuate fasciculus (connects Wernicke's to Broca's area).
- Fluent speech with paraphasic errors
- Comprehension intact
- Repetition disproportionately impaired (hallmark)
- Hypersexuality, hyperorality, visual agnosia, flat affect, memory loss (anterograde amnesia due to hippocampal damage)
Hippocampus (medial temporal lobe) - anterograde memory. First area affected in Alzheimer's → early symptom = inability to form new memories (anterograde amnesia).
Temporal lobe (Meyer's loop of optic radiation). Lesion of temporal lobe carries inferior fibers → contralateral superior quadrantanopia.
4. OCCIPITAL LOBE
Important Areas:
| Area | Brodmann | Function |
|---|---|---|
| Primary Visual Cortex (V1) | Area 17 | Basic visual processing (receives from LGN) |
| Visual Association Cortex | Areas 18, 19 | Shape, color, motion |
| Dorsal stream ("where" pathway) | To parietal | Spatial vision, motion |
| Ventral stream ("what" pathway) | To temporal | Object/face recognition |
⚡ Spotter/Viva Questions - Occipital Lobe:
Occipital cortex (V1) - posterior cerebral artery (PCA) territory stroke. Macular sparing is because the macula has dual blood supply (MCA also supplies tip of occipital pole).
Anton syndrome - bilateral occipital lobe damage. Patient is cortically blind but confabulates and DENIES blindness.
Parietal lobe (superior optic radiation fibers). Contrast with temporal lobe → superior quadrantanopia.
5. LIMBIC SYSTEM
⚡ Spotter/Viva Questions - Limbic System:
Mammillary bodies (thiamine/B1 deficiency in alcoholism). Features of Korsakoff: Severe anterograde amnesia + confabulation. Wernicke's encephalopathy triad: Confusion + Ophthalmoplegia + Ataxia.
Urbach-Wiethe disease (lipoid proteinosis). Loss of fear response, inability to recognize fearful faces, hypersexuality (Klüver-Bucy).
6. BRAINSTEM
Key Levels and Structures:
| Level | Key Structures | Cranial Nerves |
|---|---|---|
| Midbrain | Substantia nigra, Red nucleus, Cerebral aqueduct, Periaqueductal gray, Superior colliculus (vision), Inferior colliculus (hearing) | CN III, IV |
| Pons | Pontine nuclei, PPRF (horizontal gaze center), Locus coeruleus | CN V, VI, VII, VIII |
| Medulla | Pyramidal decussation, Nucleus solitarius (taste), Nucleus ambiguus (IX, X, XI), Respiratory/cardiac centers | CN IX, X, XI, XII |
⚡ Spotter/Viva Questions - Brainstem:
Weber's syndrome - Midbrain lesion (cerebral peduncle + CN III fascicles). Usually PCA territory.
Millard-Gubler syndrome - Pontine lesion (CN VI + VII + corticospinal tract)
Wallenberg syndrome:
- Ipsilateral: facial pain/temp loss, Horner's, ataxia, palatal/vocal cord palsy
- Contralateral: body pain/temp loss (spinothalamic)
- Dysphagia, dysarthria, vertigo, nystagmus
- NO motor paralysis (pyramids spared)
- CN III, IV = Midbrain
- CN V, VI, VII, VIII = Pons
- CN IX, X, XI, XII = Medulla Mnemonic: "3, 4 = Mid; 5, 6, 7, 8 = Pons; 9-12 = Medulla"
- Cortical lesion = Eyes deviate TOWARD lesion (contralateral weakness)
- Pontine lesion = Eyes deviate AWAY from lesion (toward the hemiplegia)
7. CEREBELLUM
Structure:
| Part | Function |
|---|---|
| Vermis (midline) | Truncal balance, gait |
| Hemispheres | Ipsilateral limb coordination |
| Flocculonodular lobe | Vestibulocerebellum - balance, eye movements |
| Dentate nucleus | Main output nucleus |
⚡ Spotter/Viva Questions - Cerebellum:
IPSILATERAL dysfunction always (cerebellar fibers cross twice - so effect is ipsilateral to lesion)
- Dysdiadochokinesia
- Ataxia (gait)
- Nystagmus (horizontal, fast phase toward lesion)
- Intention tremor
- Slurred speech (scanning dysarthria)
- Hypotonia
- Vermis: Truncal ataxia, wide-based gait, midline titubation (most common cause: alcohol in adults, medulloblastoma in children)
- Hemisphere: Ipsilateral limb ataxia, dysmetria, past-pointing
- Cerebellar ataxia: Romberg's test NEGATIVE (unsteady with eyes open too), intention tremor
- Sensory ataxia: Romberg POSITIVE (worse with eyes closed), stamping gait, no intention tremor
8. THALAMUS
| Nucleus | Function |
|---|---|
| VPL (Ventroposterolateral) | Body sensation (spinothalamic, dorsal column) |
| VPM (Ventroposteromedial) | Face sensation (trigeminal) |
| LGN (Lateral Geniculate) | Vision relay |
| MGN (Medial Geniculate) | Hearing relay |
| VA/VL | Motor relay (from basal ganglia/cerebellum to motor cortex) |
| Anterior | Limbic (Papez circuit) |
| Pulvinar | Visual association |
⚡ Spotter/Viva Questions - Thalamus:
After thalamic infarct (posterior thalamus, VPL): Contralateral hemisensory loss → followed by spontaneous burning pain (thalamic pain). Hyperesthesia, allodynia.
Olfaction - goes directly to olfactory cortex (piriform cortex) via olfactory bulb → tract
9. HYPOTHALAMUS
Functions (mnemonic TAN HATS):
- Temperature regulation
- Autonomic control
- Neurohypophysis control (ADH, oxytocin)
- Hunger/satiety regulation
- Anterior pituitary control (via releasing hormones)
- Thirst regulation
- Sex/circadian rhythms
Key Nuclei:
| Nucleus | Function |
|---|---|
| Suprachiasmatic | Circadian rhythm |
| Supraoptic + Paraventricular | ADH, Oxytocin production |
| Ventromedial | Satiety center (VMH = "stop eating") |
| Lateral hypothalamus | Hunger/feeding center |
| Anterior hypothalamus | Heat dissipation (cooling) |
| Posterior hypothalamus | Heat conservation |
⚡ Spotter/Viva Questions - Hypothalamus:
Hyperphagia + obesity (satiety center destroyed). Seen in craniopharyngioma.
Anorexia + weight loss
Supraoptic (+ paraventricular) nuclei → ADH deficiency → central DI
10. BASAL GANGLIA
⚡ Spotter/Viva Questions - Basal Ganglia:
Substantia nigra pars compacta (dopaminergic neurons) → depleted dopamine in striatum. Lewy bodies (alpha-synuclein) found.
Contralateral subthalamic nucleus (STN) lesion → wild flinging movements of contralateral limbs. Usually due to small lacunar infarct.
Caudate nucleus atrophy (+ putamen). Degeneration of medium spiny neurons (GABA/encephalin). Symptoms: chorea, psychiatric changes, dementia.
Copper deposition in putamen (and liver). MRI shows "eye of the tiger" sign in globus pallidus (more classic in pantothenate kinase deficiency/PKAN, but Wilson's shows bilateral putaminal signal changes).
11. INTERNAL CAPSULE
| Limb | Contents |
|---|---|
| Anterior limb | Frontopontine fibers, Thalamofrontal (from dorsomedial thalamus) |
| Genu | Corticobulbar tract (face UMN) |
| Posterior limb | Corticospinal tract (body/limb UMN), Thalamocortical sensory fibers |
| Retrolenticular | Optic radiation (to occipital), Auditory radiation |
| Sublenticular | Auditory radiation, Temporal loop of Meyer |
⚡ Spotter/Viva Questions - Internal Capsule:
Pure motor hemiplegia - contralateral face + arm + leg weakness (all three equally affected), NO sensory loss, NO cortical signs (aphasia, neglect). Classic lacunar syndrome.
All motor fibers converge as they pass through the compact posterior limb - even small lesion affects all motor fibers simultaneously.
12. CORPUS CALLOSUM
⚡ Spotter/Viva Questions:
Alien hand syndrome - one hand performs actions "involuntarily," appearing to act with a will of its own (the hand the patient cannot consciously control). Also: inability to name objects held in left hand (anomia), left-hand agraphia.
Splenium (posterior) - connects visual cortices
QUICK SPOTTER SUMMARY TABLE
| Structure Spotted | Think First |
|---|---|
| Precentral gyrus | Motor cortex - contralateral UMN weakness |
| Postcentral gyrus | Sensory cortex - contralateral loss |
| Inferior frontal gyrus (L) | Broca's area - expressive aphasia |
| Posterior STG (L) | Wernicke's area - receptive aphasia |
| Angular gyrus (L) | Gerstmann syndrome |
| Medial temporal | Hippocampus - memory |
| Occipital lobe | Visual cortex - homonymous hemianopia |
| Posterior limb IC | Corticospinal tract - pure motor |
| Pons | Contralateral gaze deviation to weakness |
| Cerebellum | IPSILATERAL ataxia |
| Substantia nigra | Parkinson's disease |
| Subthalamic nucleus | Hemiballismus |
| Caudate | Huntington's disease |
| Mammillary bodies | Wernicke-Korsakoff |
| Hypothalamus VMN | Hyperphagia / obesity |