
Optic chiasma lesion Guyton
optic chiasma lesion visual field defect bitemporal hemianopia diagram
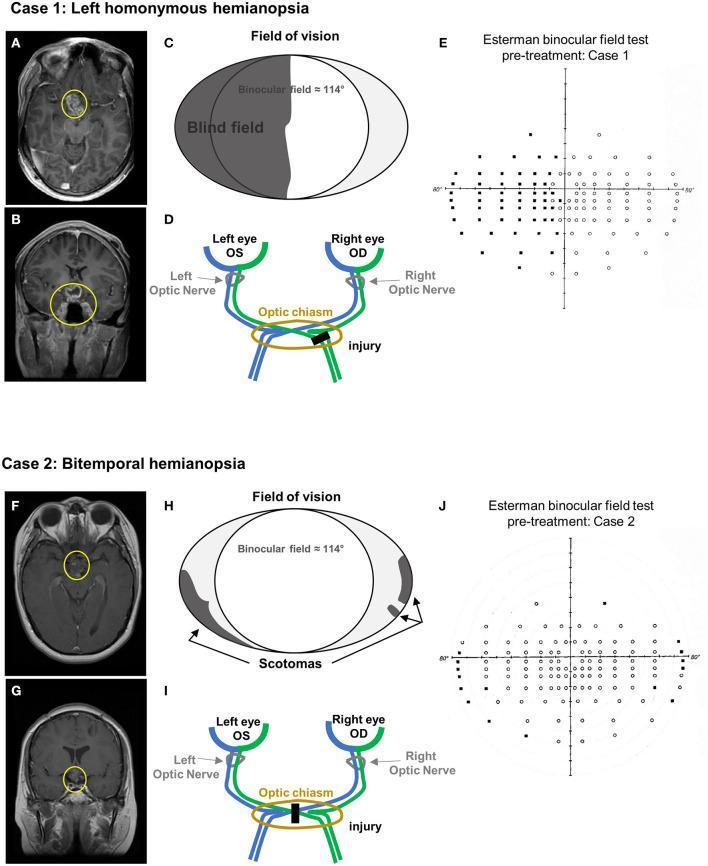
This composite educational image presents two clinical cases correlating neuroimaging findings with visual field defects. Case 1 (A-E) depicts left homonymous hemianopia. T1-weighted contrast-enhanced MRI in axial (A) and coronal (B) planes shows a heterogeneously enhancing mass in the suprasellar region (yellow circles), involving the optic chiasm and third ventricle floor. Schematic (C) and anatomical diagram (D) illustrate the corresponding lesion in the right optic tract and the resulting left hemifield blindness. The Esterman binocular field test (E) confirms significant unseen points (black dots) in the left visual field. Case 2 (F-J) depicts bitemporal hemianopia. MRI scans (F, G) reveal a residual suprasellar mass (yellow circles) inseparable from the hypothalamus and optic chiasm. The schematic (H) and optic pathway diagram (I) show a midline chiasmal injury, leading to peripheral scotomas. The Esterman test (J) demonstrates peripheral blind spots consistent with bitemporal vision loss. This comparison illustrates how specific anatomical injuries along the optic pathway correlate with distinct patterns of binocular visual impairment.
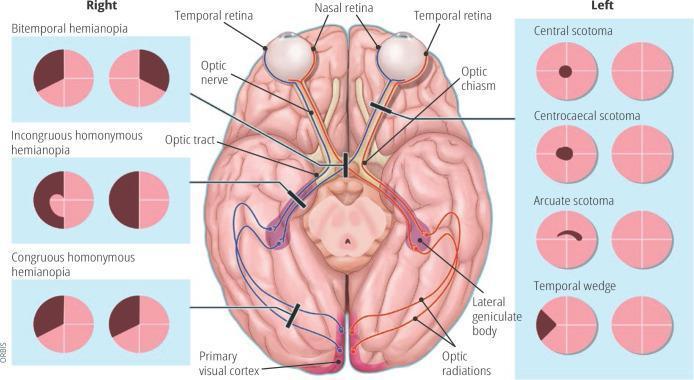
Anatomical diagram and educational infographic detailing the human visual pathway and associated visual field defects. The central illustration shows a superior (dorsal) view of the brain, highlighting the optic nerve, optic chiasm (decussation point), optic tract, lateral geniculate body, optic radiations, and the primary visual cortex in the occipital lobes. Pathways are color-coded (red and blue) to demonstrate the transition from nasal and temporal retinal fibers to the contralateral and ipsilateral hemispheres. Black lesion bars indicate specific sites of damage along this pathway. Flanking the central diagram are clinical representations of visual field loss patterns. The 'Right' panel displays bilateral defects including bitemporal hemianopia, incongruous homonymous hemianopia, and congruous homonymous hemianopia. The 'Left' panel displays unilateral or localized defects including central scotoma, centrocaecal scotoma, arcuate scotoma, and temporal wedge. This diagram serves as a neuro-ophthalmological guide for localizing lesions within the central nervous system based on perimetry findings.
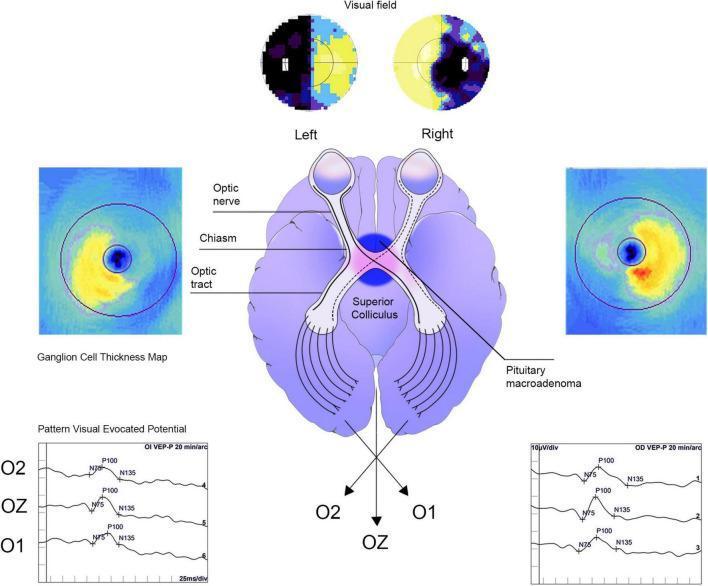
A multi-panel medical illustration demonstrating the neuro-ophthalmological effects of a pituitary macroadenoma on the visual pathways. The central anatomical diagram depicts a pituitary macroadenoma compressing the optic chiasm, specifically affecting the decussating nasal retinal fibers. Above this, visual field maps for the left and right eyes show a classic bitemporal hemianopia, characterized by significant peripheral field loss in both temporal regions. Flanking the central diagram are Optical Coherence Tomography (OCT) ganglion cell thickness maps, utilizing a color-coded heat scale (blue for thin, red/yellow for thick) to show macular ganglion cell complex (GCC) distribution, highlighting bi-nasal thinning relative to the vertical meridian. The bottom section displays Pattern Visual Evoked Potential (PVEP) waveforms for O2, OZ, and O1 electrodes, showing clinical markers like the P100 wave used to assess signal latency and amplitude. This infographic provides a comprehensive overview of how a chiasmal lesion translates into specific functional visual deficits, structural retinal changes, and electrophysiological delays, intended for medical education on sellar region tumors.
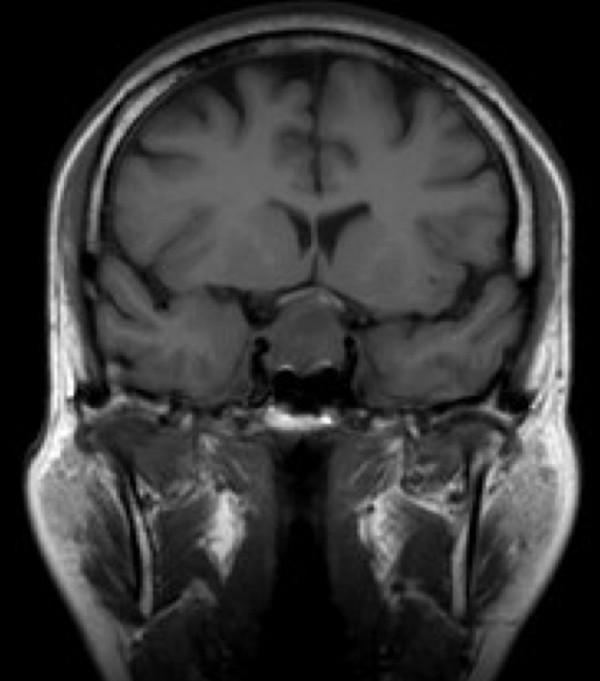
This diagnostic image is a coronal T1-weighted MRI scan of the brain, focused on the sellar and suprasellar regions. A prominent mixed solid and cystic mass is visible within an expanded sella turcica, consistent with a pituitary macroadenoma. The lesion measures approximately 20 x 16 mm and demonstrates superior extension. Crucially, the mass is shown bowing and indenting the optic chiasm, which provides a clinical explanation for visual field deficits such as bitemporal hemianopia. Anatomical landmarks including the frontal lobes, temporal lobes, and midline structures are visualized, alongside the facial soft tissues and bony structures of the skull base. The image serves as a classic educational example of how pituitary tumors can impact adjacent neuro-anatomical structures through mass effect, specifically illustrating the vulnerability of the optic chiasm to suprasellar extension of sellar masses.
Optic Chiasma Lesion - Guyton & Hall
Anatomy Recap (Guyton, Chapter 52)
- Nasal retina fibers (which receive light from the temporal/outer visual field) - CROSS at the chiasm
- Temporal retina fibers (which receive light from the nasal/inner visual field) - do NOT cross; they stay ipsilateral
Visual Pathway Diagram (Guyton Fig. 52.1)
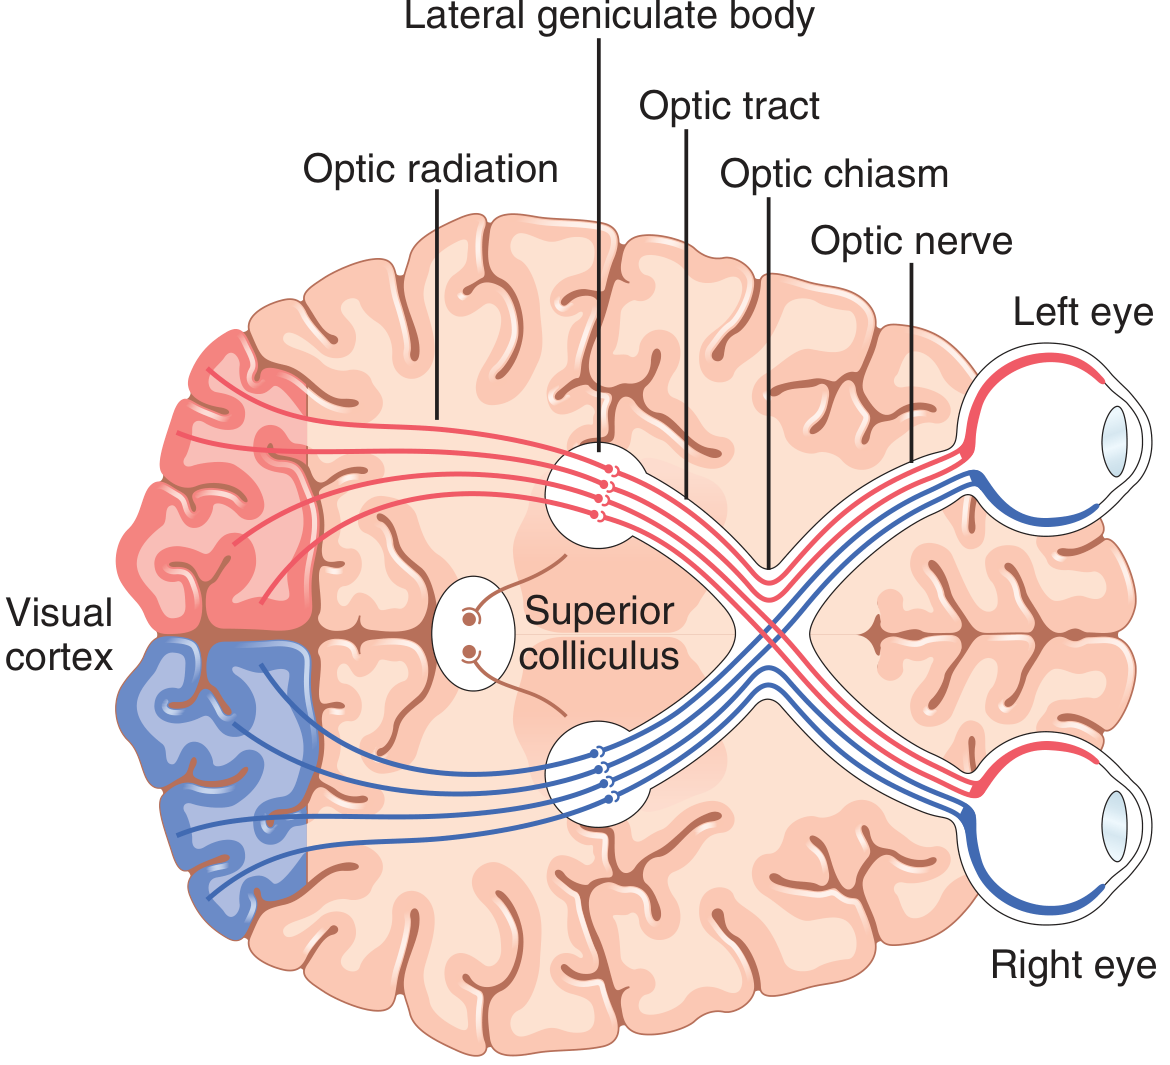
- Red fibers = right eye's temporal retina (uncrossed) + left eye's nasal retina (crossed) → form the right optic tract
- Blue fibers = left eye's temporal retina (uncrossed) + right eye's nasal retina (crossed) → form the left optic tract
Effect of Optic Chiasma Lesion
| Fibers destroyed | Retinal origin | Visual field lost |
|---|---|---|
| Nasal fibers, left eye | Left nasal retina | Left temporal field |
| Nasal fibers, right eye | Right nasal retina | Right temporal field |
Result: Bitemporal Hemianopia ("tunnel vision")
- Loss of both temporal (outer) half-fields
- The patient loses peripheral (side) vision bilaterally
- Central vision (macular, near-foveal) may be initially preserved because macular fibers are more centrally placed in the chiasm
Visual Field Defects at Different Levels of the Visual Pathway
| Site of Lesion | Visual Field Defect |
|---|---|
| One optic nerve (before chiasm) | Complete blindness in that one eye (monocular blindness) |
| Optic chiasma (midline) | Bitemporal hemianopia |
| One optic tract (after chiasm) | Contralateral homonymous hemianopia (incongruous) |
| Optic radiation (temporal lobe) | Contralateral superior quadrantanopia ("pie in the sky") |
| Optic radiation (parietal lobe) | Contralateral inferior quadrantanopia |
| Visual cortex (occipital lobe) | Contralateral homonymous hemianopia (congruous), with macular sparing |
Clinical Importance
- Craniopharyngioma
- Suprasellar meningioma
- Aneurysm of the internal carotid or anterior communicating artery
- Suprachiasmatic nucleus of hypothalamus - controls circadian rhythms
- Pretectal nuclei of midbrain - pupillary light reflex
- Superior colliculus - rapid directional eye movements
- Ventral lateral geniculate nucleus - behavioral functions