
Oxygen hemoglobin dissociation curve diagram with millers as reference
Reading File
The oxygen-hemoglobin dissociation curve (OHDC) is a sigmoid-shaped curve showing the relationship between PO2 and hemoglobin oxygen saturation. It has both right and left shift variants depending on physiological conditions.
Searching sources...
Finding Sources
Searching the Web
oxygen hemoglobin dissociation curve diagram Miller's anesthesia
Finding Sources
Reading File
I found the main OHDC diagram in Guyton. Now let me fetch this image and also search for any Miller's anesthesia content specifically:
Loading Image
Finding Sources
Now let me fetch the Rosen's OHDC diagram (with the shift curves) and also read the surrounding text from Guyton for key values:
Loading Image
Reading File
Loading Image
Finding Sources
I now have both the key diagrams and the full content. The library doesn't have Miller's Anesthesia directly, but I have the authoritative content from Guyton & Hall (the definitive physiology reference used by Miller's). Let me now compile the comprehensive answer.
Oxygen-Hemoglobin Dissociation Curve (OHDC)
Diagram 1 - Standard OHDC
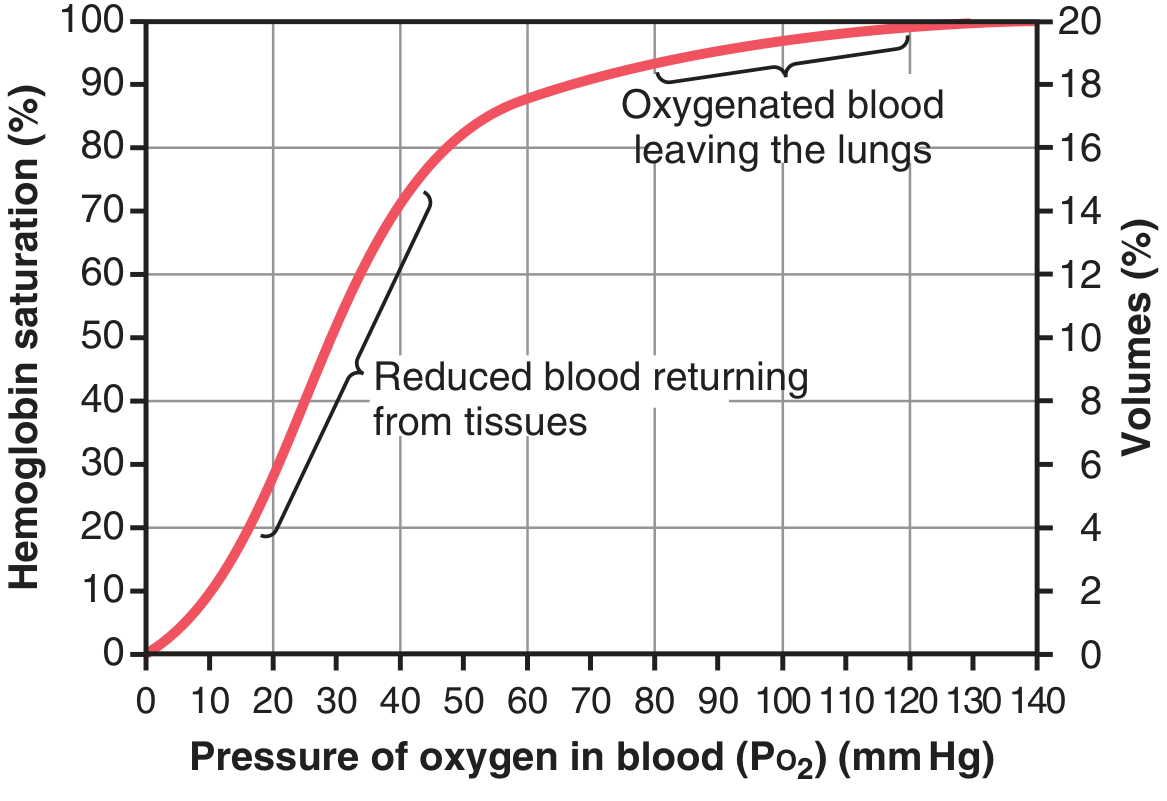
Figure 41.8 from Guyton & Hall Textbook of Medical Physiology - Oxygen-hemoglobin dissociation curve
Diagram 2 - Curve Shifts (Bohr Effect + BPG)
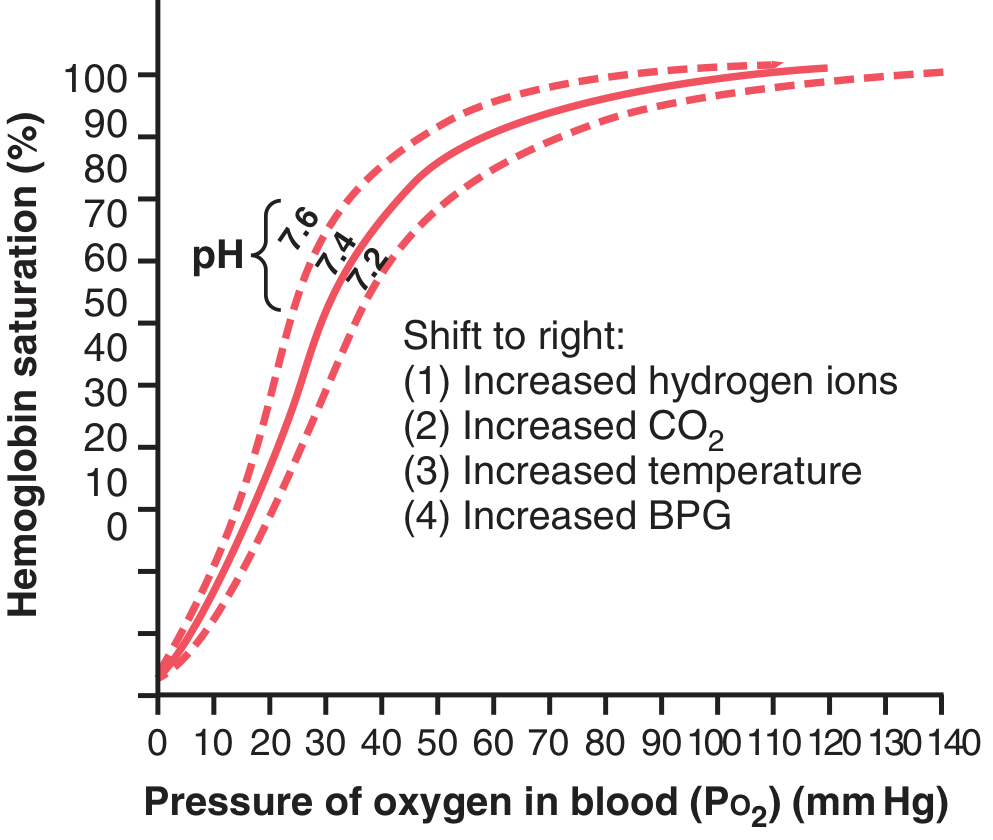
Figure 41.10 - Shift of the OHDC caused by H+ concentration (pH) changes, CO2, temperature, and BPG
Key Features of the Curve
Shape and Normal Values
The OHDC is sigmoid (S-shaped), reflecting the cooperative binding of O2 to hemoglobin's four heme groups. Key normal values:
| Point | PO2 (mm Hg) | SaO2 |
|---|---|---|
| Arterial blood (lungs) | ~95 mm Hg | 97% |
| Venous blood (tissues) | ~40 mm Hg | 75% |
| P50 (50% saturation) | 26.5 mm Hg | 50% |
Normal O2 delivery: ~5 mL O2 released per 100 mL blood per cardiac cycle (from 19.4 mL to 14.4 mL/100 mL).
Maximum O2 capacity: 15 g Hb × 1.34 mL O2/g = ~20 mL O2/100 mL blood (20 vol%).
Curve Shifts - Clinical Mnemonic
Right Shift (decreased O2 affinity, increased O2 delivery to tissues)
CADET, face Right!
- CO2 increased
- Acid (increased H+, decreased pH) - Bohr effect
- DPG/BPG increased (2,3-bisphosphoglycerate)
- Exercise
- Temperature increased
Right shift raises P50 > 26.5 mm Hg. Beneficial during exercise - O2 unloaded at PO2 as high as 40 mm Hg even when 70% of Hb remains saturated.
Left Shift (increased O2 affinity, less delivery to tissues)
- Alkalosis (decreased H+, increased pH)
- Decreased CO2
- Decreased temperature (hypothermia)
- Decreased 2,3-BPG
- CO poisoning (HbCO - left shift = functional anemia; CO has 240x greater affinity for Hb than O2)
- Fetal hemoglobin (HbF) - left shift, higher O2 affinity than adult HbA
- Methemoglobin - left shift
Left shift lowers P50 < 26.5 mm Hg.
Clinically Important Segments
Flat (Upper) Portion (PO2 60-140 mm Hg)
- Hb saturation stays high (>90%) despite large changes in PO2
- Protects against hypoxemia at altitude or with mild lung disease
- At PO2 = 60 mm Hg: SaO2 still ~90% - this is why SpO2 ≥ 90% is a key clinical threshold
Steep (Lower) Portion (PO2 10-60 mm Hg)
- Small drop in PO2 releases large amounts of O2
- Allows efficient O2 unloading in tissues
- The tissue extraction reserve - critical during exercise
Miller's Anesthesia Context
Miller's Anesthesia emphasizes several OHDC points particularly relevant to anesthetic practice:
- Pulse oximetry limitation: Because of the flat upper portion, SpO2 readings may not detect early hypoxemia (PO2 can fall from 100 to 60 mm Hg with only ~7% drop in SpO2)
- Hypothermia during surgery: Shifts curve left - O2 is held tighter by Hb, less O2 delivered to tissues. Relevant in cardiac surgery with cardioplegia.
- Stored blood: Banked blood has depleted 2,3-BPG, shifting curve left. O2 delivery may be impaired immediately after massive transfusion (BPG levels recover within ~24 hours)
- CO poisoning: Left shift + functional anemia - SpO2 falsely normal; use co-oximetry
- One-lung ventilation/hypoxic pulmonary vasoconstriction: PO2 optimization relies on understanding the curve's upper flat portion
Source: Guyton and Hall Textbook of Medical Physiology (the physiological basis used by Miller's Anesthesia for O2 transport)
This is a shared conversation. Sign in to Orris to start your own chat.