
Classify & Explain Pulmonary Function Tests in detail
pulmonary function test spirometry flow volume loop
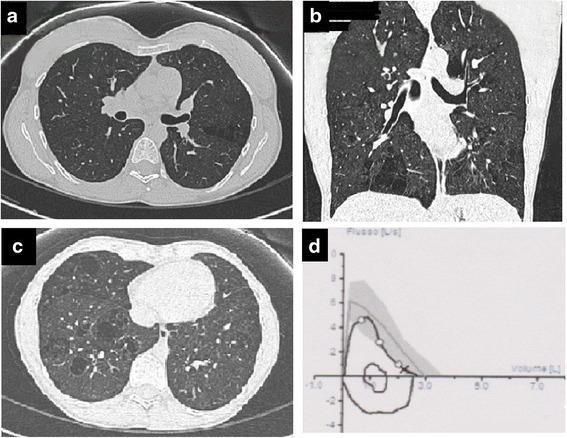
This composite educational graphic consists of High-Resolution Computed Tomography (HRCT) lung windows and a pulmonary function test graph. Panels a and c are axial HRCT slices, while panel b provides a coronal reconstruction. These images demonstrate atypical emphysematous changes characterized by thin-walled, bullous-like destructions. Notably, the emphysema exhibits a distribution pattern featuring a single layer of subpleural-like bubbles delineated by interlobular septa, but unusually located toward the lung center and predominantly affecting the lower lobes. These features are contrasted with typical centrilobular emphysema (upper lobe predominance) and paracicatricial emphysema (thick-walled cysts). Panel d displays a flow-volume loop from a spirometry assessment, plotting flow (L/s) against volume (L). The loop morphology and position within the shaded reference range indicate normal global lung function despite the visual radiological pathology. This case serves as a comparison chart for identifying atypical presentations of paraseptal emphysema in the clinical context of rare systemic conditions like Goltz syndrome.
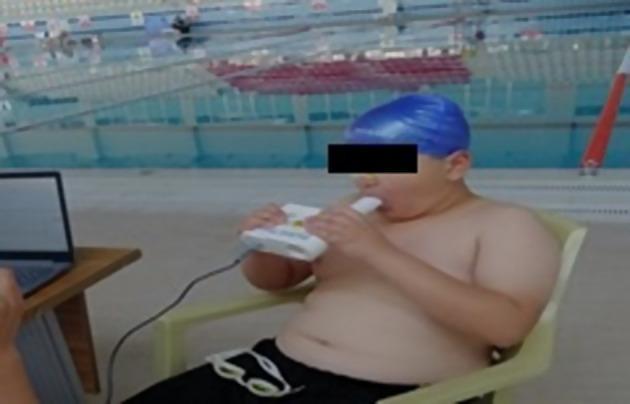
This clinical photograph illustrates the performance of a pulmonary function test, specifically Forced Vital Capacity (FVC) measurement, in an aquatic sports setting. A young male subject, wearing a blue swimming cap and dark shorts, is seated while performing spirometry. He is using a handheld digital spirometer (Pocket Spiro USB-100), gripping the white device with both hands. The subject’s lips are tightly sealed around a disposable cylindrical mouthpiece, and a nose clip is applied to ensure isolated oral expiration. A data cable connects the spirometer to a laptop on a nearby table, indicating real-time data acquisition and flow-volume loop analysis. The background shows a swimming pool environment, suggesting clinical research into the respiratory physiology of swimmers or the impact of aquatic training on lung volumes. This image serves as an educational example of portable spirometry application and proper patient positioning for diagnostic respiratory maneuvers outside a traditional lab setting.
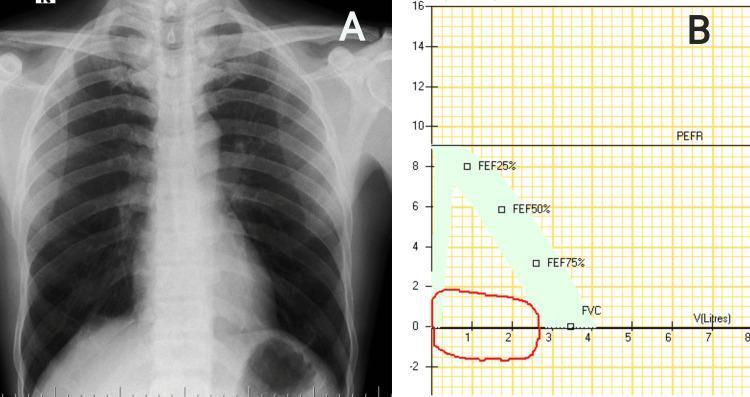
This composite medical image presents diagnostic findings for airway evaluation, consisting of a chest radiograph and a pulmonary function test graph. Image A is a posterior-anterior (PA) chest radiograph demonstrating hyperinflated lung fields characterized by increased radiolucency and flattened diaphragms, while the mediastinal contour and heart size appear within normal limits. Image B is a flow-volume loop from a spirometry assessment. The graph shows a characteristic flattening of both the expiratory (upper) and inspiratory (lower) limbs of the loop, resulting in a rectangular appearance rather than the typical triangular peak. This 'box-like' morphology is a classic physiological sign of a fixed large airway obstruction, such as subglottic stenosis or a tracheal mass. Key data points on the graph include Forced Expiratory Flow (FEF) at 25%, 50%, and 75% of vital capacity, and Peak Expiratory Flow Rate (PEFR). The clinical significance lies in the correlation between radiographic signs of air trapping and the physiological evidence of impaired airflow in both phases of respiration, facilitating the diagnosis of upper airway pathology.
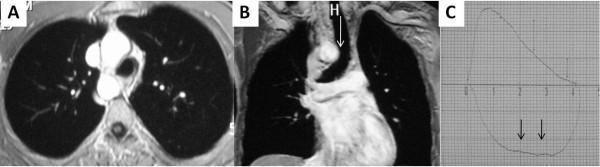
This composite educational image features thoracic MRI scans and a pulmonary function test plot demonstrating a Right-Sided Aortic Arch (RSAA) with associated tracheal compression. Panels A and B are thoracic MRI images: Panel A (axial view) shows the aortic arch positioned to the right of the trachea rather than the typical left. Panel B (coronal view) highlights significant narrowing of the tracheal air column (marked with 'H' and an arrow) caused by extrinsic compression from the RSAA. Panel C is a spirometry flow-volume loop. The expiratory limb (upper curve) shows a relatively preserved peak, but the inspiratory limb (lower curve) demonstrates a characteristic flattening or plateau (indicated by vertical arrows). This visual pattern is a diagnostic hallmark of a variable extrathoracic or fixed intrathoracic upper airway obstruction. The set serves to correlate anatomical cardiovascular anomalies with functional respiratory physiological impairments, illustrating how vascular rings or arches can lead to symptomatic tracheal stenosis.
lung volumes TLC RV FRC spirometry diagram
obstructive restrictive spirometry pattern FEV1 FVC ratio comparison
Pulmonary Function Tests (PFTs): Classification & Detailed Explanation
Classification of PFTs
| Category | Tests |
|---|---|
| 1. Spirometry | FVC, FEV1, FEV1/FVC, FEF25-75%, PEFR, MVV |
| 2. Lung Volumes | TLC, FRC, RV, IC, ERV, VC |
| 3. Diffusing Capacity | DLCO (Transfer Factor) |
| 4. Flow-Volume Loops | Peak flow, shape analysis |
| 5. Airway Resistance / Body Plethysmography | Raw, Gaw, sGaw |
| 6. Bronchoprovocation Tests | Methacholine challenge (PC20) |
| 7. Arterial Blood Gases (ABG) | PaO2, PaCO2, pH, SaO2 |
| 8. Exercise Testing (CPET) | VO2max, VE, work rate, 6MWT |
1. SPIROMETRY
Key Parameters
a) Forced Vital Capacity (FVC)
b) FEV1 (Forced Expiratory Volume in 1 second)
c) FEV1/FVC Ratio
- Normal: ~70-80% (≥0.70)
- Obstructive: FEV1/FVC <0.70 (or below the Lower Limit of Normal, LLN)
- Restrictive: FEV1/FVC >80% (FVC and FEV1 both reduced proportionally)
"A low ratio indicates obstruction and the test should be repeated after bronchodilators. A normal ratio (FVC and FEV1 reduced to the same extent) indicates a restrictive pathology." - Bailey & Love's Surgery, p. 5057
d) FEF25-75% (Mid-Expiratory Flow Rate)
- Volume of air exhaled between 25% and 75% of the FVC
- Reflects small airway function - may detect early or mild obstruction when FEV1/FVC is still normal
- High variability limits its utility; false-positive rates are significant at the 80% predicted cutoff
- Murray & Nadel's, p. 233
e) PEFR (Peak Expiratory Flow Rate)
- Maximum flow rate achieved during forceful exhalation
- Reduced in obstructive disease
- Widely used for monitoring asthma at home
- Does NOT distinguish obstructive from restrictive reliably
f) MVV (Maximal Voluntary Ventilation)
- Volume of air breathed in and out as rapidly as possible for 12-15 seconds
- Reflects respiratory muscle strength and endurance
- Reduced in both obstructive and neuromuscular disease
Spirometry Patterns: Obstructive vs. Restrictive
| Parameter | Obstructive Pattern | Restrictive Pattern |
|---|---|---|
| PEFR | ↓↓ | Normal or ↓ |
| FEV1 | ↓↓ | Normal or ↓ |
| FVC | Normal or ↓ | ↓↓ |
| FEV1/FVC | <70% | >80% |
| TLC | ↑ (air trapping) | ↓ |
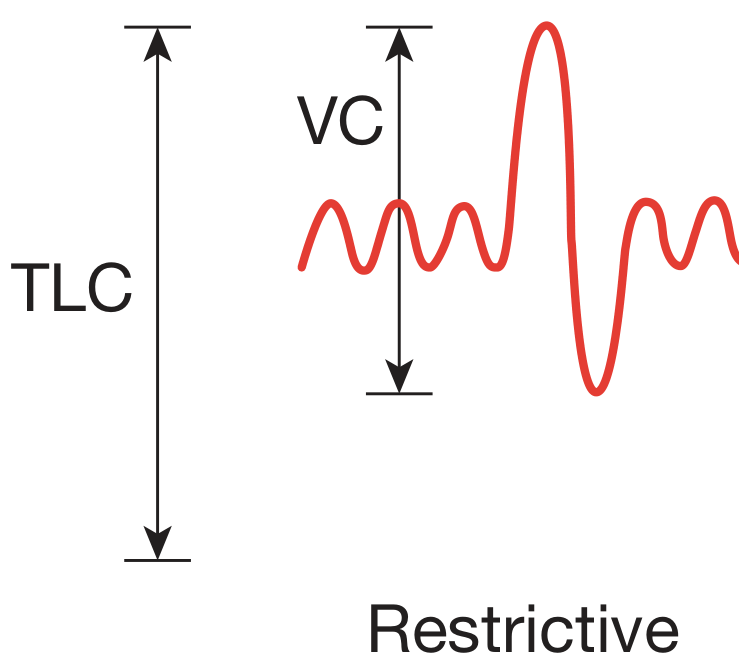
2. LUNG VOLUMES
Key Lung Volume Definitions
| Volume / Capacity | Definition |
|---|---|
| TLC (Total Lung Capacity) | Volume of gas in the lungs at the end of maximal inspiration |
| FRC (Functional Residual Capacity) | Volume at rest: inward pull of lungs balanced by outward pull of chest wall |
| RV (Residual Volume) | FRC - ERV; gas left in lungs after maximal exhalation (cannot be exhaled) |
| IC (Inspiratory Capacity) | Volume inspired from FRC to TLC |
| ERV (Expiratory Reserve Volume) | Volume exhaled from FRC to RV |
| VC (Vital Capacity) | TLC - RV |
Methods to Measure Absolute Lung Volumes
- Patient sits in a sealed box and pants against a closed shutter
- Applies Boyle's Law (P1V1 = P2V2)
- Most accurate; measures ALL gas in the thorax (including poorly ventilated areas)
- May overestimate if abdominal gas is included
- Patient breathes a known concentration of helium in a closed circuit until equilibration
- Only measures communicating air spaces - underestimates lung volumes in air trapping (e.g., COPD)
- Patient breathes 100% oxygen; nitrogen is "washed out" and measured
- Similar limitation to helium dilution in poorly ventilated areas
3. DIFFUSING CAPACITY (DLCO)
What It Measures
"Tests for measuring diffusing capacity permit diagnosis of an impaired surface area for the transfer of gases from the alveoli to the pulmonary capillaries, sometimes even during early stages of disease." - Murray & Nadel's, p. 2624
Why CO is Used
Single-Breath Method (Standard)
- Patient inhales a gas mixture containing 0.3% CO + inert tracer gas (helium/neon)
- Holds breath for 10 seconds
- Exhales; the concentration of CO remaining is measured
- DLCO is calculated from the rate of CO disappearance
Factors Affecting DLCO
| Factor | Effect | Mechanism |
|---|---|---|
| Anemia (without Hb adjustment) | Reduced | Fewer heme sites for CO binding |
| Polycythemia | Increased | More heme sites |
| Altitude | Increased | More heme sites available |
| Valsalva maneuver | Reduced | Less capillary blood volume |
| Mueller maneuver | Increased | More capillary blood volume |
| Carboxyhemoglobin | Reduced | Fewer free heme sites |
| Exercise / supine position | Increased | Capillary recruitment |
| Incomplete inspiration | Reduced | Less alveolar surface area |
Clinical Interpretation of DLCO
| DLCO | Condition |
|---|---|
| Reduced | Emphysema, IPF, ILD, pulmonary HTN, pulmonary emboli, asbestosis, scleroderma, Pneumocystis pneumonia, lung allograft rejection |
| Normal/Elevated | Asthma (normal gas exchange), polycythemia |
| Elevated | Left-to-right shunts, pulmonary hemorrhage (CO binds to alveolar blood) |
4. FLOW-VOLUME LOOPS
Normal Loop
- Expiratory limb: rapid rise to peak flow, then linear decline
- Inspiratory limb: symmetrical, semicircular curve below the x-axis
Pathological Patterns
| Pattern | Appearance | Cause |
|---|---|---|
| Obstructive | Concave ("scooped") expiratory limb | COPD, emphysema, asthma |
| Restrictive | Narrow loop, normal shape, reduced total volume | ILD, fibrosis |
| Fixed upper airway obstruction | "Box-like" - both expiratory AND inspiratory limbs flattened | Tracheal stenosis, goiter, subglottic stenosis |
| Variable extrathoracic obstruction | Inspiratory limb flattened | Vocal cord paralysis, laryngeal edema |
| Variable intrathoracic obstruction | Expiratory limb flattened | Tracheomalacia |
| Negative effort dependence | Expiratory flow decreases with increased effort | Emphysema, severe airflow collapse |
5. INTERPRETATION ALGORITHM
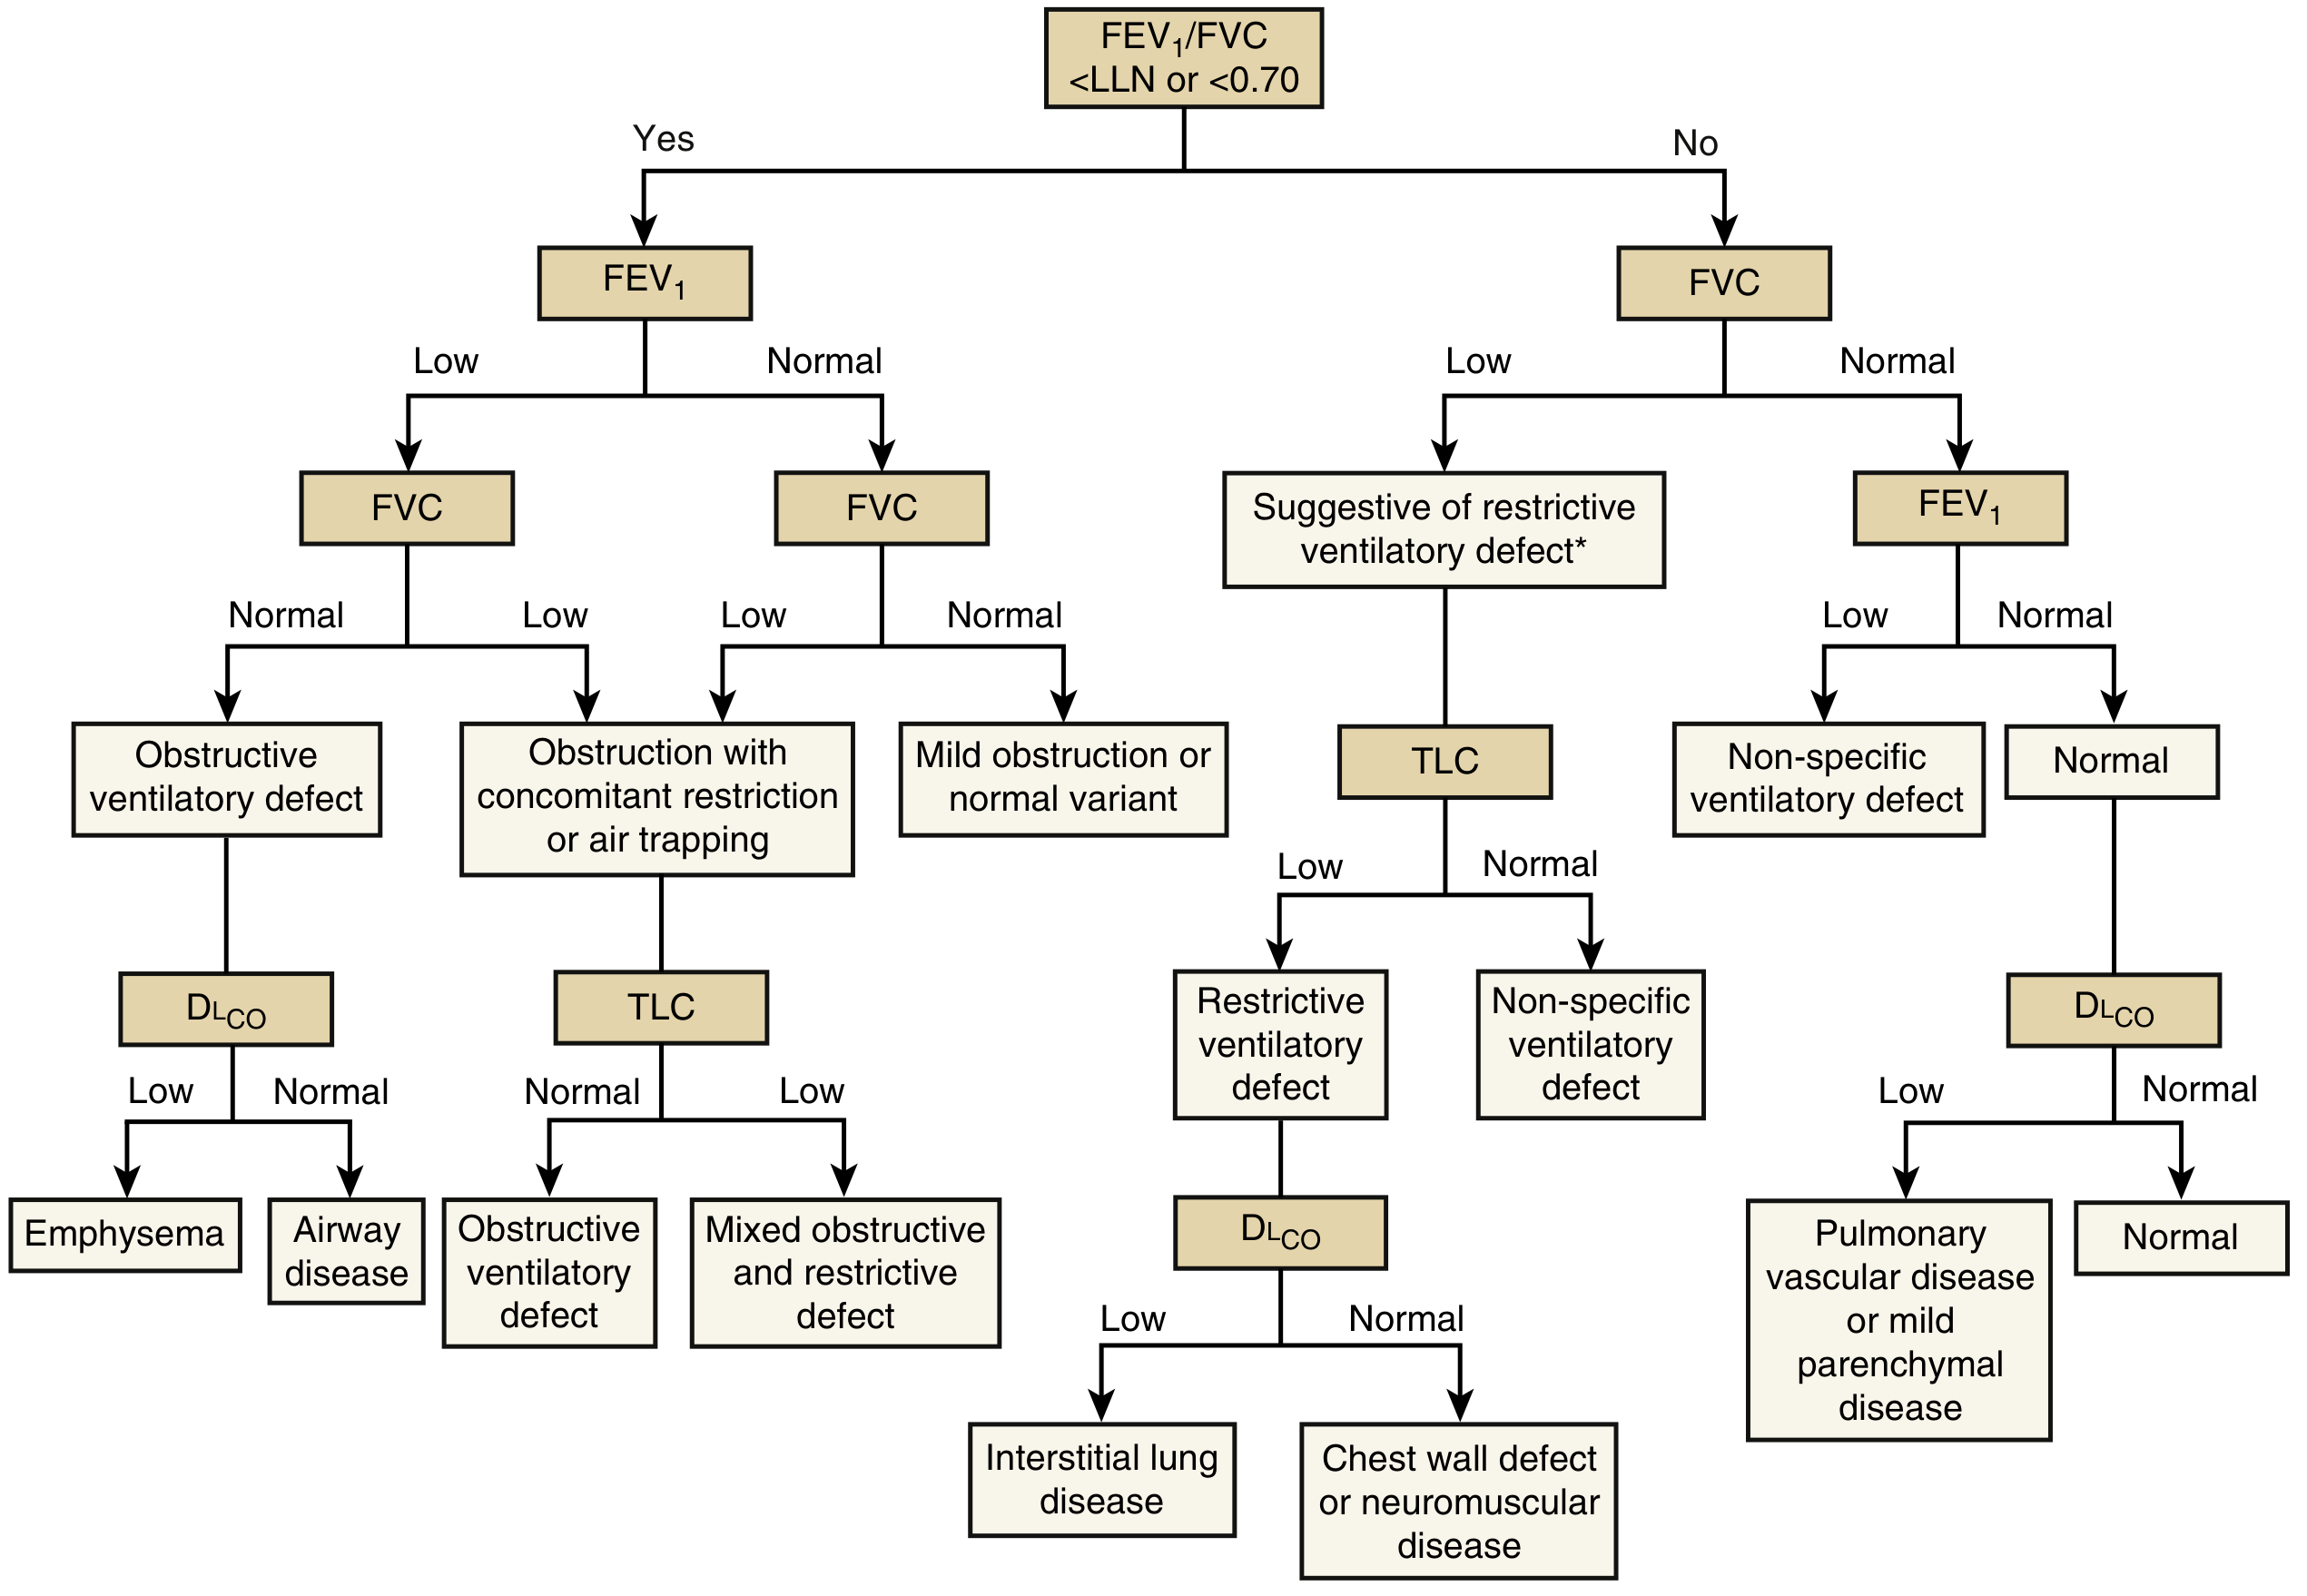
- FEV1/FVC <0.70 (or below LLN)?
- Yes → Obstructive: If FVC is also low, add TLC. If TLC is also low → mixed obstructive-restrictive. If DLCO is low → emphysema; if normal → airway disease (asthma/COPD).
- No → Consider FVC: If FVC is low → suggestive of restriction → confirm with TLC
- TLC <LLN confirms restriction
- If DLCO is also low → interstitial lung disease
- If DLCO is normal → chest wall / neuromuscular disease
- Normal FEV1/FVC, low FEV1 or FVC, normal TLC → Nonspecific ventilatory defect
6. BRONCHOPROVOCATION TESTING
- Inhaled methacholine (direct muscarinic agonist) is given in doubling concentrations
- PC20: Provocative concentration causing a 20% fall in FEV1
- PC20 <16 mg/mL = mild airway hyperresponsiveness (AHR)
- PC20 <4 mg/mL = moderate AHR
- PC20 <1 mg/mL = severe AHR
- High sensitivity for asthma; a normal PC20 (>16 mg/mL) nearly excludes active asthma
- Superimposes sound waves on tidal breathing
- Measures airway resistance (R5, R20) and reactance (X5)
- Non-invasive; useful for patients who cannot perform forced maneuvers (children, elderly)
- Murray & Nadel's, p. 244
7. ARTERIAL BLOOD GASES (ABG)
| Parameter | Normal | Significance |
|---|---|---|
| PaO2 | 80-100 mmHg | Oxygenation failure |
| PaCO2 | 35-45 mmHg | Ventilatory failure |
| pH | 7.35-7.45 | Acid-base status |
| SaO2 | >95% | Hemoglobin oxygen saturation |
8. EXERCISE TESTING (CPET)
- Reduced VO2max (maximal oxygen consumption) = impaired cardiopulmonary reserve
- 6-Minute Walk Test (6MWT): Flat surface walk; measures distance and desaturation. In IPF, strongly correlates with DLCO and is a predictor of mortality. - Murray & Nadel's, p. 3261
- Abnormally high minute ventilation at submaximal workloads in ILD
- Increased dead space/tidal volume ratio in SSc with ILD - Murray & Nadel's, p. 1629
9. CLINICAL PATTERNS SUMMARY
Obstructive Diseases
- Asthma, COPD, emphysema, bronchiectasis, bronchiolitis
- FEV1/FVC <0.70, PEFR ↓↓, TLC normal or ↑ (air trapping), RV ↑
- DLCO: Normal in asthma; ↓ in emphysema
Restrictive Diseases
- Intrinsic: IPF, sarcoidosis, hypersensitivity pneumonitis, asbestosis
- Extrinsic: Chest wall (kyphoscoliosis, obesity), neuromuscular (ALS, myopathy, phrenic palsy)
- FEV1/FVC normal or ↑, TLC ↓, RV ↓, DLCO ↓ in ILD, normal in chest wall/neuromuscular causes
Mixed Pattern
- Obstructive + Restrictive: FEV1/FVC low + TLC low
- Seen in: eosinophilic granulomatosis with polyangiitis, allergic bronchopulmonary aspergillosis, combined pulmonary fibrosis + emphysema, sarcoidosis with airway involvement
Nonspecific Ventilatory Defect
- Normal FEV1/FVC, reduced FEV1 or FVC, normal TLC
- Often seen in obesity, mild deconditioning, or early disease
Key References
- Murray & Nadel's Textbook of Respiratory Medicine - Chapters 31, 32 (Spirometry, Diffusion, Interpretation Algorithm)
- Goldman-Cecil Medicine - Chapter 73 (PFT classification table and clinical patterns)
- Bailey & Love's Short Practice of Surgery - Chapter 60 (Table 60.1, Spirometry patterns)
- Miller's Anesthesia - Chapter 4 (Spirometry and DLCO for preoperative assessment)