
In detail about intracardiac electrocardiogram.
Reading File
Reading File
Finding Sources
Finding Sources
Searching PubMed
intracardiac electrocardiography
Searching the Web
intracardiac electrogram electrophysiology study recording interpretation His bundle coronary sinus
Searching Images
intracardiac electrogram electrophysiology study His bundle recording diagram
Finding Sources
Finding Sources
query_images_db
Reading Web Page
https://www.ncbi.nlm.nih.gov/sites/books/NBK560784
Reading File
Reading File
Reading File
Loading Image
Intracardiac electrocardiogram (intracardiac ECG) / intracardiac electrogram (IEGM)
An intracardiac electrocardiogram, more accurately called an intracardiac electrogram (IEGM), is a recording of electrical activity made by electrode catheters placed inside the cardiac chambers or near the conduction system during an invasive electrophysiology study (EPS).
Unlike the 12-lead surface ECG, which records the summed electrical field reaching the body surface, an intracardiac electrogram records electrical activation very close to its source. It can therefore identify the timing and sequence of activation in the atria, AV node, His bundle, ventricles, coronary sinus, and an accessory pathway.
Do not confuse it with intracardiac echocardiography (ICE), which is ultrasound imaging performed inside the heart. Intracardiac electrograms record electricity, not anatomy or blood flow.
1. Principles
Each intracardiac catheter has several closely spaced electrodes. The recording system amplifies, filters, digitizes, and displays their voltage signals simultaneously with surface ECG leads, usually I, II, aVF, V1, and V6.
Recordings are usually displayed at 100-200 mm/s, much faster than the usual 25 mm/s surface-ECG speed, allowing millisecond-level timing of atrial, His, and ventricular signals. The EPS interpretation reference describes interpretation as assessment of electrogram timing and morphology against simultaneous surface ECG recordings.
Why it is useful
Intracardiac electrograms help to:
- Locate the level of conduction delay or block.
- Determine whether tachycardia is supraventricular or ventricular.
- Define the mechanism of SVT, such as AV nodal re-entry tachycardia (AVNRT), AV re-entry tachycardia (AVRT), or atrial tachycardia.
- Identify accessory pathways in Wolff-Parkinson-White syndrome.
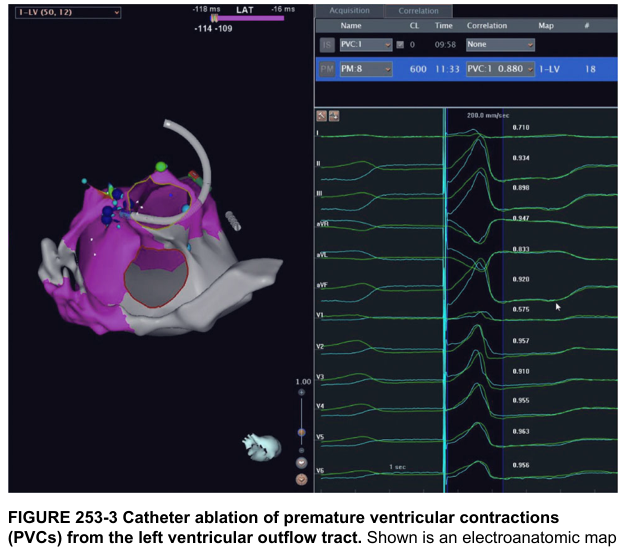
- Map the origin or circuit of atrial fibrillation, atrial flutter, premature ventricular complexes, and ventricular tachycardia.
- Guide and verify catheter ablation.
- Assess sinus-node, AV-nodal, and His-Purkinje function.
- Evaluate unexplained syncope with suspected infranodal conduction disease.
2. Recording configurations
Bipolar electrogram
A bipolar EGM records the voltage difference between two adjacent intracardiac electrodes, usually separated by about 2-3 mm.
Features:
- Most commonly used for routine mapping and timing.
- Produces a sharp, local signal.
- Rejects much of the distant electrical activity.
- Good for recognizing the exact local onset of activation.
Unipolar electrogram
A unipolar EGM records between one intracardiac electrode and a remote indifferent electrode, often placed in the inferior vena cava.
Features:
- Detects a broader field of electrical activity.
- Useful to establish the direction of a wavefront.
- At the site of earliest focal activation, a QS-type unipolar signal may support that the electrode is at or very near the activation origin.
- More vulnerable to far-field signals and noise.
Near-field versus far-field signals
- Near-field signal: sharp, rapid, high-frequency deflection caused by activation immediately adjacent to the recording electrode.
- Far-field signal: broader, lower-frequency deflection originating from more distant myocardium.
Distinguishing these is essential. For example, a catheter in the coronary sinus may record a local left-atrial electrogram and a far-field ventricular electrogram. Mislabeling them can produce an incorrect diagnosis of tachycardia mechanism.
3. Usual catheter positions and what they record
| Catheter site | Main structures assessed | Typical use |
|---|---|---|
| High right atrium (HRA) | Right atrial activation, sinus-node region | Atrial timing and pacing |
| His-bundle region | Atrial, His, and ventricular signals | AV-node and His-Purkinje assessment |
| Coronary sinus (CS) | Left atrial activation, mitral annulus region | Left atrial sequence, accessory pathway localization |
| Right ventricular apex or septum (RVA/RV) | Ventricular activation | Ventricular pacing, induction of VT |
| Mapping or ablation catheter | Local tissue at target site | Earliest activation, scar, fractionation, ablation endpoint |
Normal atrial activation sequence during sinus rhythm
Because the sinus node is high in the right atrium, atrial activation is usually seen in this order:
- High right atrium
- His-region atrium
- Proximal coronary sinus
- Distal coronary sinus, near the lateral left atrium
- His signal
- Ventricular electrogram
A reversal or alteration of this sequence can identify the direction of atrial activation and may reveal a left-sided atrial tachycardia, atypical flutter, or accessory-pathway conduction.
4. The His-bundle electrogram
The His-bundle electrogram (HBE) is the classic intracardiac recording for evaluating AV conduction. A catheter is placed at the superior aspect of the tricuspid annulus, near the membranous septum and His bundle.
A well-recorded HBE shows three deflections:
- A wave: local atrial depolarization.
- H wave: depolarization in the His bundle.
- V wave: local ventricular depolarization.
Ganong describes the normal HBE as A, H, and V deflections, allowing measurement of PA, AH, and HV conduction intervals. Ganong's Review of Medical Physiology, 26th ed., p. 528.
Important intervals
| Interval | Measurement | Physiological meaning | Approximate adult value |
|---|---|---|---|
| PA | Earliest atrial activation to His-region A wave | Intra-atrial conduction from sinus-node region toward AV node | ~27 ms |
| AH | A wave to onset of H wave | Conduction through AV node | ~92 ms, generally <130 ms |
| HV | Onset of H wave to earliest QRS onset | His-Purkinje conduction | ~43 ms, generally ≤55 ms |
Ganong's Review of Medical Physiology, 26th ed., p. 528.
Harrison’s Principles of Internal Medicine, 22nd ed., p. 1971.
Harrison’s Principles of Internal Medicine, 22nd ed., p. 1971.
Clinical interpretation of intervals
Prolonged AH interval
A prolonged AH interval means delayed conduction within the AV node.
Common settings:
- High vagal tone
- AV nodal disease
- AV nodal blocking drugs: beta-blockers, verapamil, diltiazem, digoxin
- AV nodal re-entry physiology
AH conduction is normally decremental. During faster atrial pacing or increasingly premature atrial extrastimuli, the AH interval lengthens progressively because the AV node has rate-dependent conduction delay.
Prolonged HV interval
A prolonged HV interval indicates delayed conduction below the AV node, in the His bundle, bundle branches, or Purkinje system.
This is more concerning than isolated AV-nodal delay because it may indicate progressive His-Purkinje disease and susceptibility to higher-grade AV block. Harrison notes that an abnormal prolonged HV interval localizes impaired infranodal conduction. Harrison’s Principles of Internal Medicine, 22nd ed., p. 1971.
Split His potential
Two separated His deflections, often termed H and H′, may indicate conduction delay within the His bundle itself. It suggests advanced conduction-system disease and can help localize an intra-Hisian block.
5. Intracardiac ECG in tachycardia analysis
The central principle is to determine:
- What activates first: atrium or ventricle?
- What is the activation sequence?
- Is the atrium necessary for the tachycardia circuit?
- Does the AV node participate in the circuit?
- How does pacing alter the rhythm?
A. AV nodal re-entry tachycardia, AVNRT
In typical slow-fast AVNRT:
- The re-entry circuit is in or very near the AV node.
- Atrial and ventricular activation occur almost simultaneously.
- The His-region atrial electrogram is often very close to the ventricular electrogram.
- The septal VA interval is short, classically often <70 ms.
A common finding during programmed atrial stimulation is an AH jump:
- A 10 ms shortening of the atrial coupling interval produces a sudden AH prolongation of ≥50 ms.
- This reflects antegrade conduction switching from the fast pathway to the slower AV-nodal pathway.
- It demonstrates dual AV-nodal physiology, although it is not by itself synonymous with clinical AVNRT.
Fuster and Hurst describes a ≥50 ms rise in AH interval with a 10 ms reduction in A1-A2 as evidence of dual AV-nodal physiology. Fuster and Hurst's The Heart, 15th ed., p. 1127.
B. AV re-entry tachycardia, AVRT
In orthodromic AVRT:
- Conduction travels antegradely through the AV node and His-Purkinje system.
- The ventricle activates through the normal conduction system, usually producing a narrow QRS.
- The impulse returns retrogradely to the atrium via an accessory pathway.
- Atrial activation follows ventricular activation with a measurable VA interval.
The earliest retrograde atrial electrogram helps localize the pathway:
- Earliest distal coronary-sinus activation: often a left lateral accessory pathway.
- Earliest His-region/low septal atrial activation: often a septal accessory pathway.
- Earliest right atrial free-wall activation: suggests a right free-wall pathway.
C. Atrial tachycardia
In focal atrial tachycardia:
- The atrium is the driver of the rhythm.
- Atrial electrograms precede His and ventricular electrograms.
- Mapping seeks the site with the earliest local atrial activation relative to the onset of the surface P wave.
- A unipolar QS pattern at the earliest site may provide further supportive evidence for a focal origin.
D. Atrial flutter
Intracardiac recordings reveal continuous or nearly continuous atrial activation. Mapping identifies:
- The sequence of activation around the tricuspid annulus in typical flutter.
- Whether activation is clockwise or counterclockwise.
- Areas of slow conduction and the critical isthmus, commonly the cavotricuspid isthmus in typical right atrial flutter.
E. Ventricular tachycardia
During VT mapping, operators use intracardiac EGMs to identify:
- Earliest ventricular activation in focal VT or PVCs.
- Late potentials, which occur after the surface QRS and may represent slow conduction in scarred myocardium.
- Fractionated electrograms, suggesting heterogeneous scar and conduction channels.
- Diastolic potentials during re-entrant VT, which may identify part of the tachycardia circuit.
For scar-related VT, a local electrogram occurring in diastole during VT can indicate tissue within the re-entry circuit and a potential ablation target.
6. Pacing maneuvers used with intracardiac recordings
Intracardiac ECG is not interpreted in isolation. It is combined with programmed electrical stimulation.
Atrial pacing
Used to assess:
- Sinus-node recovery and sinoatrial conduction.
- AV-nodal conduction and refractoriness.
- Dual AV-nodal physiology.
- Inducibility of SVT.
A gradual increase in AH interval with faster atrial pacing is normal AV-nodal decremental conduction.
Ventricular pacing
Used to assess:
- Retrograde VA conduction.
- Whether an accessory pathway is present.
- Tachycardia mechanism.
Premature extrastimuli
Atrial or ventricular beats are introduced earlier and earlier in the cardiac cycle to test refractoriness and provoke arrhythmias.
Examples:
- Premature atrial stimulation can reveal an AH jump and induce AVNRT.
- A ventricular premature beat delivered when the His bundle is refractory that advances the atrium supports an accessory pathway participating in AVRT.
- Ventricular stimulation can induce sustained monomorphic VT in selected patients.
Entrainment
Entrainment pacing slightly faster than an ongoing re-entrant tachycardia is used to determine whether the pacing site lies in or near the tachycardia circuit. It is particularly useful in macroreentrant atrial flutter and scar-related VT.
7. Role in catheter ablation
During ablation, intracardiac EGMs identify the target and confirm treatment success.
Examples of procedural endpoints
- AVNRT: noninducibility of sustained AVNRT after slow-pathway modification.
- Accessory-pathway ablation: elimination of pathway conduction and loss of pre-excitation if it was manifest.
- Cavotricuspid-isthmus flutter ablation: bidirectional isthmus block.
- Pulmonary-vein isolation: disappearance or dissociation of pulmonary-vein potentials.
- PVC/VT ablation: elimination of targeted abnormal local potentials, inability to induce the clinical VT, or disappearance of the PVC.
In pulmonary-vein isolation, a circular catheter records local pulmonary-vein signals. Their elimination or electrical dissociation from the left atrium is an important endpoint.
8. Indications
Intracardiac ECG is obtained as part of an EPS when there is a clinical reason to define arrhythmia mechanism or conduction disease. Typical indications include:
- Recurrent symptomatic SVT where diagnosis or ablation is planned.
- Wolff-Parkinson-White syndrome or suspected accessory pathway.
- Symptomatic or recurrent atrial flutter and selected atrial tachycardias.
- Ventricular tachycardia or frequent PVCs planned for ablation.
- Unexplained syncope with bundle-branch block or suspected intermittent high-grade AV block.
- Assessment of suspected infranodal disease.
- Evaluation and treatment of some device-related arrhythmias.
It is not routinely needed for simple palpitations with a clearly benign surface ECG. Its invasive nature means the expected diagnostic or therapeutic benefit should justify catheterization.
9. Limitations and sources of error
- Catheter movement: respiration, patient motion, or cardiac motion can alter electrogram morphology.
- Far-field signals: may be mistaken for local activation.
- Poor contact: produces low-amplitude or inconsistent signals.
- Filter settings: excessive filtering can distort signal morphology; inadequate filtering increases noise.
- Atrial or ventricular pacing artifact: can obscure local EGMs.
- Anatomic variation: can complicate catheter placement and pathway localization.
- Interpretation depends on context: the same activation sequence may have different meanings during sinus rhythm, pacing, and tachycardia.
Correct interpretation requires correlation of intracardiac signals with the surface ECG, catheter position, pacing response, and, increasingly, three-dimensional electroanatomic maps.
10. Risks
EPS and intracardiac recording are generally safe in experienced centers, but potential complications include:
- Vascular bleeding or hematoma
- Venous thrombosis
- Cardiac perforation and pericardial tamponade
- Induction of sustained arrhythmia requiring cardioversion
- Embolism or stroke, especially during left-sided procedures
- Infection
- Radiation exposure if fluoroscopy is used
- AV block, particularly during ablation near the AV node or His bundle
The recording itself is diagnostic, but risk increases when extensive pacing, transseptal access, or ablation is performed.
Key summary
An intracardiac ECG is an invasive, high-resolution electrical recording from inside the heart. Its basic unit is the local electrogram. The His-bundle recording, with A, H, and V deflections, permits measurement of:
- PA: intra-atrial conduction
- AH: AV-nodal conduction
- HV: His-Purkinje conduction
It is indispensable for defining arrhythmia mechanisms, localizing conduction disease, guiding catheter ablation, and proving procedural endpoints.
This is a shared conversation. Sign in to Orris to start your own chat.