
Approach to proteinuria
proteinuria evaluation management
approach to proteinuria diagnostic algorithm flowchart
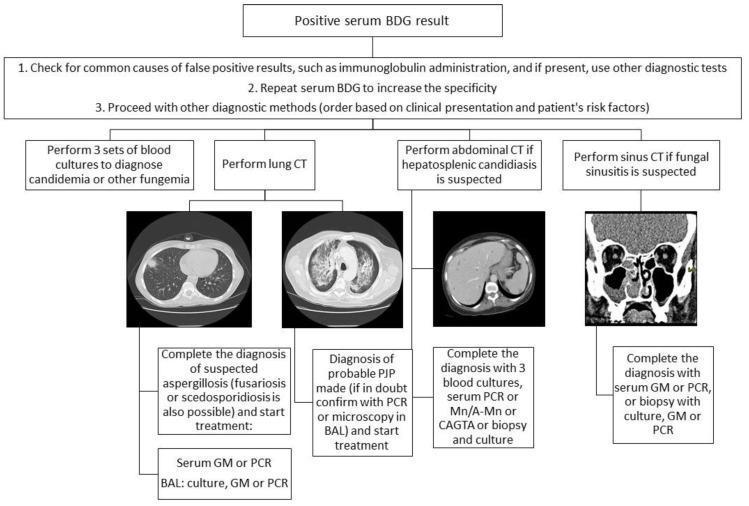
This educational clinical flowchart illustrates the diagnostic approach to a positive serum (1,3)-beta-D-glucan (BDG) result in patients with hematological malignancies. The algorithm begins by recommending a check for false positives, such as immunoglobulin administration, followed by repeated BDG testing and clinical risk assessment. The flowchart branches into four diagnostic pathways based on clinical suspicion, each integrated with representative CT imaging examples. The first branch focuses on blood cultures for candidemia. The second branch focuses on pulmonary involvement, showcasing lung CT scans illustrating a localized opacity (suggesting aspergillosis, fusariosis, or scedosporidiosis) and bilateral ground-glass opacities (suggesting Pneumocystis jirovecii pneumonia, PJP). The third branch addresses hepatosplenic candidiasis with an abdominal CT scan. The fourth branch focuses on fungal sinusitis, displaying a coronal sinus CT with mucosal thickening and opacification. Each imaging branch concludes with specific confirmatory tests, including galactomannan (GM), PCR, bronchoalveolar lavage (BAL), or tissue biopsy. This resource serves as a clinical guideline for managing invasive fungal infections in immunocompromised populations.
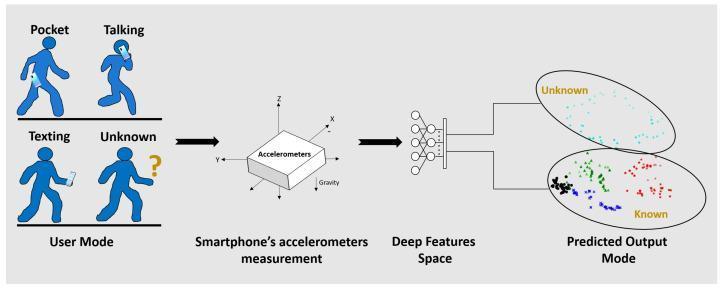
This diagnostic algorithm flowchart illustrates a machine-learning approach for human activity recognition (HAR) and smartphone location recognition (SLR). The diagram depicts a four-stage process: 1) User Mode input (Pocket, Talking, Texting, and Unknown); 2) Smartphone's accelerometer measurement, showing tri-axial (X, Y, Z) gravitational force data; 3) Deep Features Space, represented by an artificial neural network (ANN) architecture; and 4) Predicted Output Mode. The final stage displays a 2D cluster plot (latent space representation) that differentiates 'Known' activities (clustered data points in black, blue, green, and red) from 'Unknown' activities (cyan points). This methodology is used in clinical research for remote patient monitoring and mobile health (mHealth) applications to automatically detect and classify human physical activities or anomalies in movement patterns. The visualization demonstrates how deep learning features can achieve spatial separation between established behavioral patterns and novel or unknown movements, aiding in the development of robust gait and activity monitoring systems for physical therapy and rehabilitation.
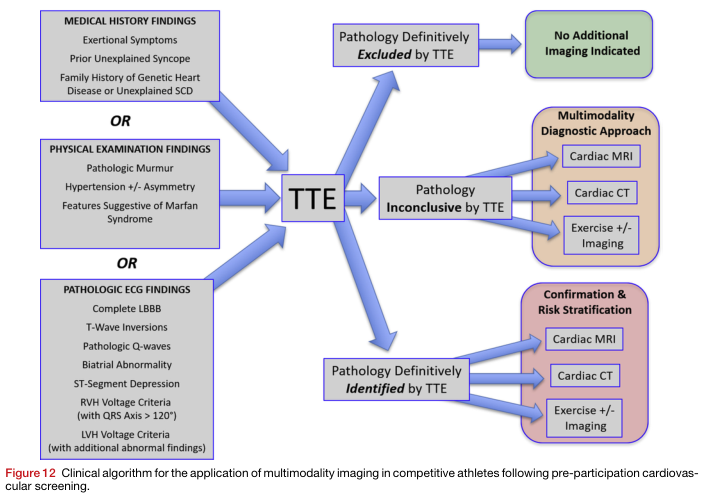
Summary : This flowchart presents a clinical algorithm for the use of multimodality imaging in competitive athletes after pre-participation cardiovascular screening, based on medical history, physical exam, or ECG findings. flowchart: # Nodes : • MEDICAL HISTORY FINDINGS (rectangle): "Exertional Symptoms; Prior Unexplained Syncope; Family History of Genetic Heart Disease or Unexplained SCD" • PHYSICAL EXAMINATION FINDINGS (rectangle): "Pathologic Murmur; Hypertension +/- Asymmetry; Features Suggestive of Marfan Syndrome" • PATHOLOGIC ECG FINDINGS (rectangle): "Complete LBBB; T-Wave Inversions; Pathologic Q-waves; Biatrial Abnormality; ST-Segment Depression; RVH Voltage Criteria (with QRS Axis > 120°); LVH Voltage Criteria (with additional abnormal findings)" • TTE (rectangle, central): Transthoracic Echocardiogram (TTE) • Pathology Definitively Excluded by TTE (rectangle) • No Additional Imaging Indicated (rounded rectangle, green) • Pathology Inconclusive by TTE (rectangle) • Multimodality Diagnostic Approach (rounded rectangle, tan): "Cardiac MRI; Cardiac CT; Exercise +/- Imaging" • Pathology Definitively Identified by TTE (rectangle) • Confirmation & Risk Stratification (rounded rectangle, pink): "Cardiac MRI; Cardiac CT; Exercise +/- Imaging" # Connectors : • Arrows from each of the three initial findings boxes (Medical History, Physical Exam, ECG) point to TTE. • From TTE, three arrows branch: – To "Pathology Definitively Excluded by TTE" → then to "No Additional Imaging Indicated" – To "Pathology Inconclusive by TTE" → then to "Multimodality Diagnostic Approach" (with sub-arrows to Cardiac MRI, Cardiac CT, Exercise +/- Imaging) – To "Pathology Definitively Identified by TTE" → then to "Confirmation & Risk Stratification" (with sub-arrows to Cardiac MRI, Cardiac CT, Exercise +/- Imaging) • Logical "OR" labels between the three initial findings boxes. # Layout : • Three input boxes (Medical History, Physical Exam, ECG) arranged vertically on the left, each separated by "OR". • All three feed into a central TTE box. • TTE branches rightward into three possible outcomes, each leading to further action or no action. • Multimodality Diagnostic Approach and Confirmation & Risk Stratification are grouped on the right, each with three imaging options listed. # Analysis : • The algorithm starts with any abnormal finding in medical history, physical exam, or ECG, prompting a TTE. • If TTE excludes pathology, no further imaging is needed. • If TTE is inconclusive, a multimodality approach (MRI, CT, exercise imaging) is recommended. • If TTE identifies pathology, further imaging is used for confirmation and risk stratification. • The flowchart emphasizes a stepwise, evidence-driven escalation of imaging based on initial findings and TTE results.
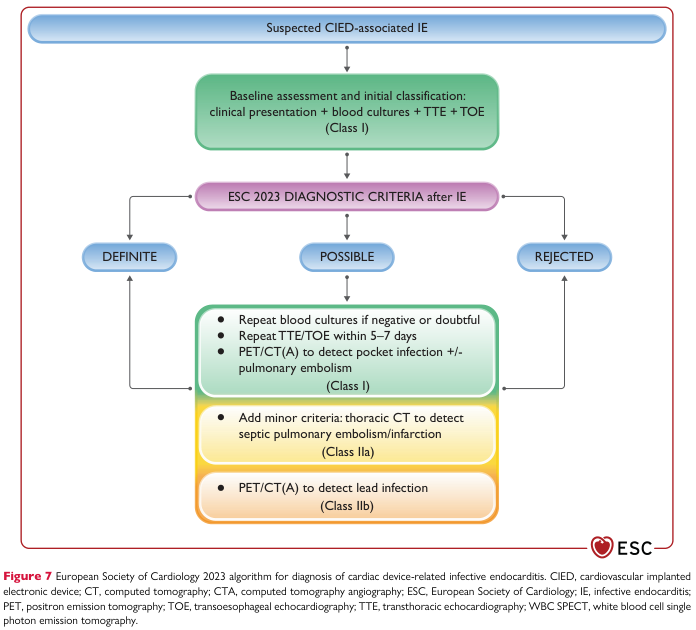
Summary : This flowchart presents the European Society of Cardiology (ESC) 2023 algorithm for diagnosing cardiac device-related infective endocarditis (CIED-associated IE), outlining the stepwise approach from initial suspicion to definitive, possible, or rejected diagnosis, and subsequent recommended investigations. flowchart: # Nodes : • Suspected CIED-associated IE (rounded rectangle, top) • Baseline assessment and initial classification: clinical presentation + blood cultures + TTE + TOE (rounded rectangle, green) • ESC 2023 DIAGNOSTIC CRITERIA after IE (rounded rectangle, purple) • Three outcome nodes: DEFINITE (rounded rectangle, blue), POSSIBLE (rounded rectangle, blue), REJECTED (rounded rectangle, blue) • For POSSIBLE branch, three investigation nodes: – Repeat blood cultures if negative or doubtful; Repeat TTE/TOE within 5–7 days; PET/CT(A) to detect pocket infection +/- pulmonary embolism (rounded rectangle, green, Class I) – Add minor criteria: thoracic CT to detect septic pulmonary embolism/infarction (rounded rectangle, yellow, Class IIa) – PET/CT(A) to detect lead infection (rounded rectangle, orange, Class IIb) # Connectors : • Downward arrow from Suspected CIED-associated IE to Baseline assessment and initial classification. • Downward arrow from Baseline assessment to ESC 2023 DIAGNOSTIC CRITERIA after IE. • Three arrows from ESC 2023 DIAGNOSTIC CRITERIA after IE to DEFINITE, POSSIBLE, and REJECTED. • From POSSIBLE, downward arrows to each of the three investigation nodes. • Arrow from investigation nodes (Class I, IIa, IIb) back to DEFINITE node, indicating possible reclassification after further testing. # Layout : • Vertical flow from top (suspicion) to bottom (diagnosis and further testing). • Three branches from diagnostic criteria: left (DEFINITE), center (POSSIBLE with further investigations), right (REJECTED). • Investigation steps for POSSIBLE diagnosis are stacked vertically and color-coded by recommendation class (Class I: green, Class IIa: yellow, Class IIb: orange). • Feedback loop from further investigations to DEFINITE diagnosis. # Analysis : • The algorithm emphasizes a structured, stepwise approach: initial assessment with clinical, microbiological, and echocardiographic data, followed by application of ESC diagnostic criteria. • If diagnosis is POSSIBLE, additional investigations (repeat cultures, imaging) are recommended, with the possibility of upgrading to DEFINITE diagnosis. • Color-coding highlights the strength of recommendations for each investigation (Class I strongest, Class IIb weakest). • The flowchart visually reinforces the importance of repeated and multimodal testing in ambiguous cases, and provides clear decision pathways for clinicians.
Approach to Proteinuria
1. Normal Protein Excretion
2. Types of Proteinuria
| Type | Mechanism | Proteins Excreted | Causes | Notes |
|---|---|---|---|---|
| Glomerular | Increased GBM permeability; podocyte injury | High-MW proteins (albumin ~70% of total) | IgA nephropathy, FSGS, diabetic nephropathy, MN, MPGN, lupus nephritis | Most common; dipstick positive |
| Tubular | Failure to reabsorb normally filtered low-MW proteins | Low-MW proteins (immunoglobulins dominant; albumin only 10-20%) | Fanconi syndrome, Dent disease, interstitial nephritis, toxins (aminoglycosides) | Rarely >2-3 g/day; dipstick may miss it |
| Overflow | Plasma overproduction of abnormal proteins saturating tubular reabsorption | Light chains (Bence Jones), myoglobin, hemoglobin | Multiple myeloma, rhabdomyolysis, hemolysis | No intrinsic renal disease; dipstick often negative (not albumin); SSA positive |
| Functional/Transient | Physiologic changes in GFR | Albumin | Fever, strenuous exercise, dehydration, orthostatic (postural) | Resolves with repeat testing |
Key point: Dipstick measures primarily albumin. A negative dipstick in the setting of suspected myeloma should prompt sulfosalicylic acid (SSA) testing or urine protein electrophoresis (UPEP).
3. Quantification Methods
| Test | Threshold | Notes |
|---|---|---|
| Urine dipstick | ≥1+ (SG ≤1.015) or ≥2+ (SG >1.015) | Rapid screen; insensitive for non-albumin proteins |
| Spot urine protein:creatinine ratio (UPCr) | >0.2 in adults; >0.25 in children >2 yr; >0.5 in 6 mo-2 yr | Best correlates with 24-hr collection; preferred over 24-hr collection in practice |
| Urine albumin:creatinine ratio (UACr) | >30 mg/g (microalbuminuria); >300 mg/g (overt albuminuria) | Used in high-risk patients (diabetes, hypertension) |
| 24-hour urine protein | 30-300 mg = microalbuminuria; >300 mg = albuminuria; >3.5 g = nephrotic range | Gold standard but cumbersome; usually not needed |
Patients with low or high muscle mass (e.g., sarcopenic elderly, bodybuilders) may have less accurate UPCr ratios.
4. Clinical Classification by Syndrome
| Syndrome | Proteinuria | Edema | Hematuria | BP | Serum Albumin | Casts |
|---|---|---|---|---|---|---|
| Nephrotic | >3.5 g/day | Severe | May/may not | Normal | Low | Fatty, hyaline |
| Nephritic | Subnephrotic | Moderate | ++ (RBCs, brown urine) | Elevated | Normal/slightly ↓ | RBC casts |
| RPGN | Variable | Variable | ++ | Elevated | Variable | Cellular crescents |
| Isolated proteinuria | Mild-moderate | None | None | Normal | Normal | None |
5. Diagnostic Approach - Stepwise
Step 1: Confirm Proteinuria
- Positive dipstick should never be taken as definitive on a single sample.
- Repeat dipstick after excluding transient causes (fever, exercise, UTI, concentrated urine).
- Two of three weekly positive samples = persistent proteinuria - warrants full evaluation.
Step 2: Quantify and Characterize
- Spot UPCr (preferred) or 24-hr urine protein.
- Albumin-specific testing (UACr) in high-risk patients (diabetes, hypertension, CKD).
- If dipstick negative but clinical suspicion high: SSA acid test for Bence Jones protein.
- Urine protein electrophoresis (UPEP) to distinguish glomerular vs. tubular vs. overflow.
Step 3: Urinalysis with Microscopy
- RBC casts → nephritic syndrome / glomerulonephritis.
- Fatty casts, oval fat bodies, "Maltese cross" lipid → nephrotic syndrome.
- WBC casts → interstitial nephritis / pyelonephritis.
- Dysmorphic RBCs → glomerular origin of hematuria.
Step 4: Assess Renal Function
- Serum creatinine, eGFR, BUN.
- Serum albumin, lipid panel (↓ albumin + hyperlipidemia = nephrotic syndrome).
- Electrolytes.
Step 5: Identify the Cause - Investigations
| Investigation | Targets |
|---|---|
| Fasting glucose, HbA1c | Diabetic nephropathy |
| Blood pressure | Hypertensive nephropathy |
| ANA, anti-dsDNA, complement (C3, C4) | Lupus nephritis |
| ANCA (pANCA, cANCA) | ANCA vasculitis, RPGN |
| Anti-GBM antibody | Goodpasture syndrome |
| ASO titer, complement | Post-streptococcal GN |
| Hepatitis B and C serology | Membranous, MPGN, cryoglobulinemia |
| Serum/urine protein electrophoresis | Multiple myeloma, MGUS |
| Cryoglobulins | Cryoglobulinemia |
| HIV | HIV-associated nephropathy (FSGS) |
| Renal ultrasound | Structural anomalies, echogenicity, size |
| Urine culture | Exclude UTI |
Step 6: Renal Biopsy
- Nephrotic syndrome (especially in adults where cause is unclear).
- Rapidly progressive deterioration in renal function.
- Persistent non-nephrotic proteinuria without a clear diagnosis after workup.
- Before starting immunosuppressive therapy.
- Not indicated for classic diabetic nephropathy with typical history or for orthostatic proteinuria.
6. Special Populations
Proteinuria in Adults
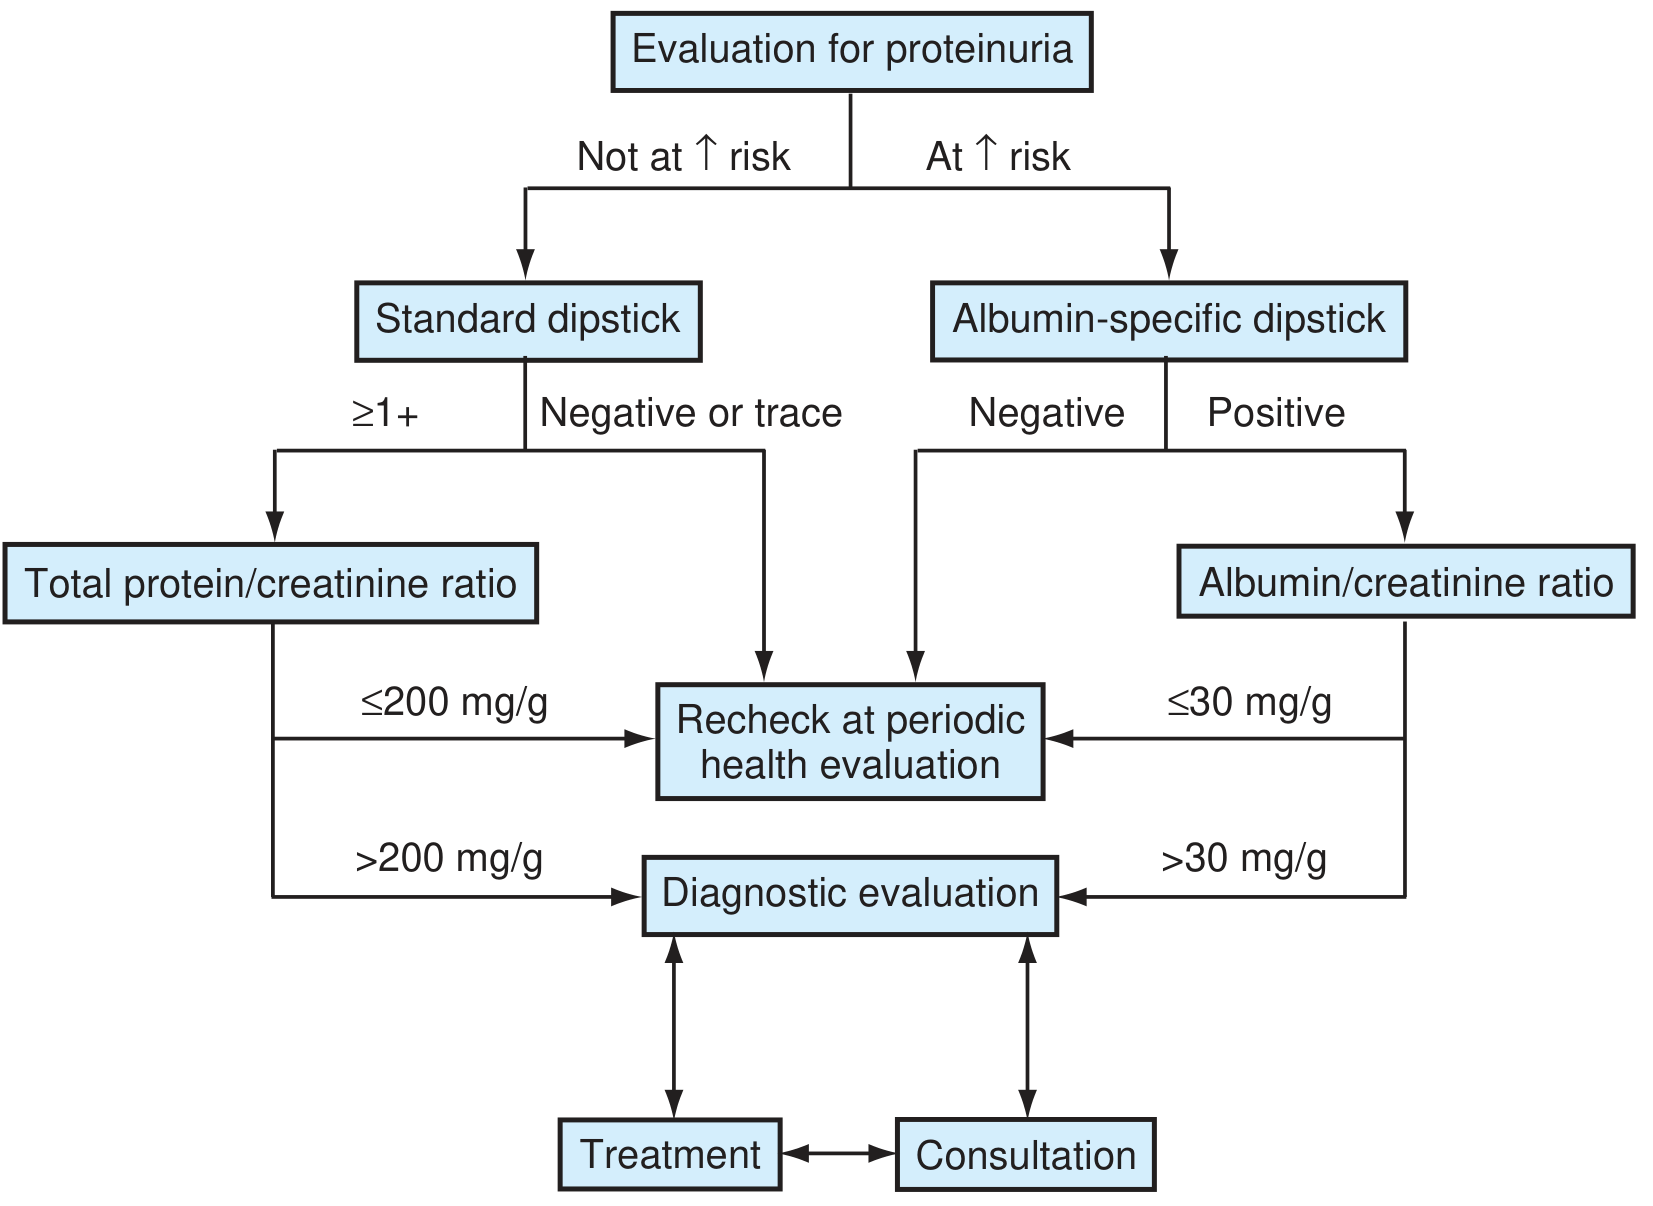
- Patients at elevated risk (diabetes, hypertension, CKD family history): albumin-specific dipstick or UACr.
- Not at elevated risk: standard dipstick.
- If positive → quantify with protein/creatinine ratio.
- UPCr ≤200 mg/g: recheck at periodic health evaluation.
- UPCr >200 mg/g: full diagnostic evaluation → treatment + nephrology consultation.
Proteinuria in Children
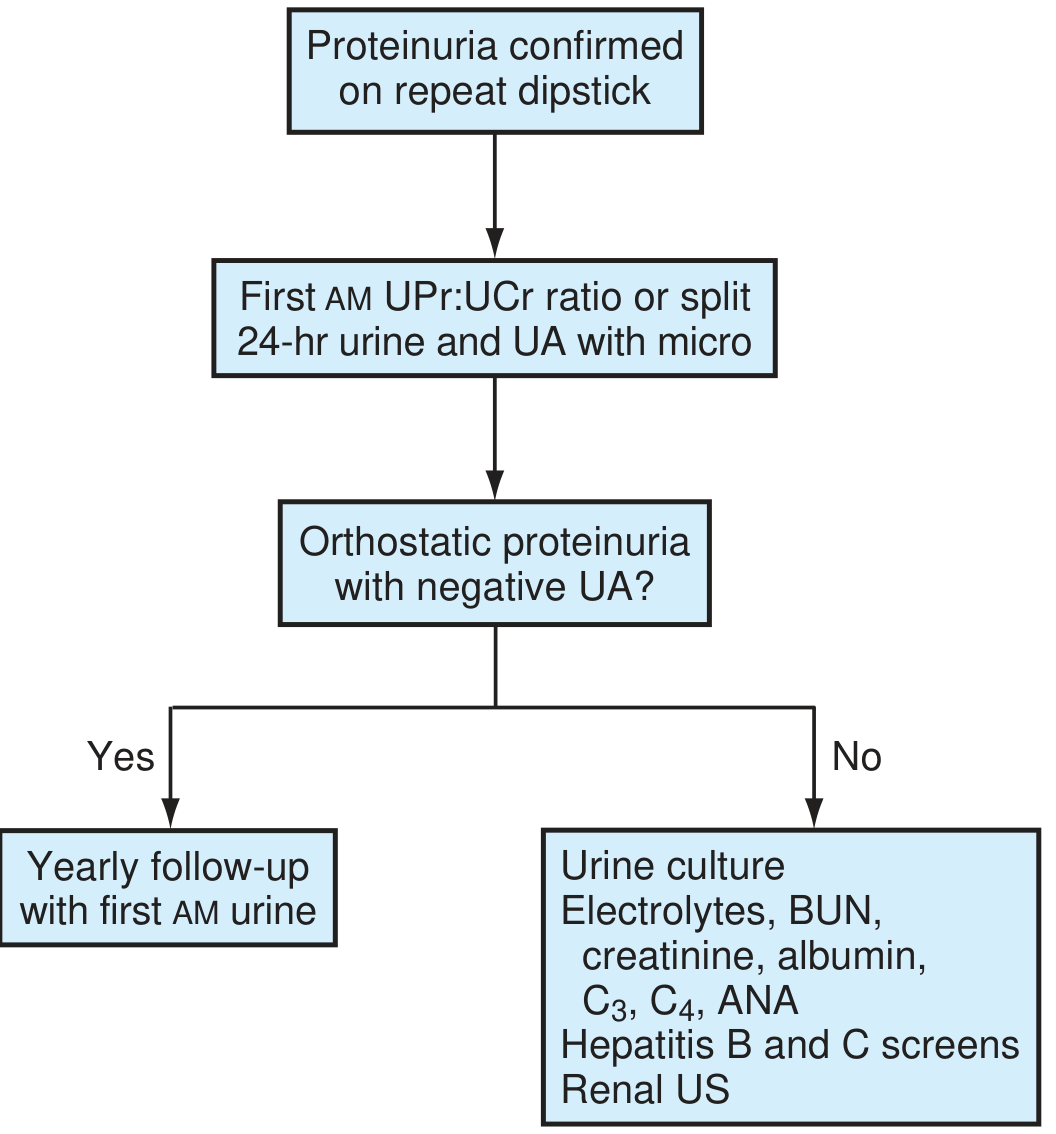
- Most proteinuria in children is transient - check weekly for 3 weeks; 2 of 3 positives = persistent.
- Confirm with repeat dipstick, then first-morning UPr:UCr ratio + UA with microscopy.
- Orthostatic (postural) proteinuria - most common benign cause:
- Absence of protein in first AM sample (supine overnight).
- Confirmed by split 24-hr collection.
- Excellent prognosis; annual follow-up with first-morning urine.
- If not orthostatic: workup with urine culture, electrolytes, BUN, creatinine, albumin, C3, C4, ANA, hepatitis B/C, renal ultrasound.
- Causes include: minimal change disease, FSGS, membranous nephropathy, IgA nephropathy, lupus nephritis, Alport syndrome, tubulointerstitial disease.
Proteinuria in Pregnancy
- Significant proteinuria in pregnancy (>300 mg/24 hr) raises concern for preeclampsia.
- In the setting of hypertension after 20 weeks gestation, proteinuria is a defining criterion for preeclampsia.
7. Management Principles
General
- Treat the underlying cause (immunosuppression for GN, antibiotics for post-infectious, etc.).
- Blood pressure control is paramount: target <130/80 mmHg in proteinuric CKD.
Renin-Angiotensin System (RAS) Blockade - Cornerstone of Treatment
- ACE inhibitors or ARBs are first-line for proteinuria reduction regardless of BP:
- Reduce intraglomerular pressure (efferent arteriolar dilation).
- Reduce podocyte injury (angiotensin II decreases nephrin expression; ACEi/ARB reverses this).
- Reduce TGF-β-mediated fibrosis and tubulointerstitial scarring.
- Reduce proteinuria and slow GFR decline in both diabetic and non-diabetic nephropathy.
- Higher-dose ARB therapy is most efficacious in reducing proteinuria.
- Adding spironolactone to ACEi/ARB provides additional ~40-60% proteinuria reduction (multiple trials).
Newer Therapies
- SGLT2 inhibitors (dapagliflozin, empagliflozin): reduce proteinuria and slow CKD progression in diabetic and non-diabetic CKD - now first-line adjunct per KDIGO 2024 guidelines.
- Finerenone (non-steroidal MRA): reduces proteinuria and CV/renal events in diabetic CKD.
Additional Measures
- Dietary protein restriction (0.6-0.8 g/kg/day) in CKD.
- Lipid lowering (statins) in nephrotic syndrome.
- Anticoagulation consideration in nephrotic syndrome (especially membranous nephropathy with albumin <2.5 g/dL due to hypercoagulable state).
- Sodium restriction + diuretics for edema management.
8. Proteinuria as a Risk Marker
- A cardinal manifestation of glomerular injury.
- An independent predictor of CKD progression, cardiovascular events, and all-cause mortality.
- A therapeutic target - reduction in proteinuria predicts renal protection.
- Likely a pathogenetic factor itself (filtered protein contributes to tubulointerstitial injury and fibrosis via reabsorption of protein in proximal tubular cells triggering cytokine release).
- Campbell-Walsh-Wein Urology (pathophysiology, types)
- Brenner & Rector's The Kidney (physiology, measurement, management)
- Textbook of Family Medicine, 9e (clinical approach, figures)
- Comprehensive Clinical Nephrology, 7th ed. (nephrotic vs. nephritic syndromes)
- National Kidney Foundation Primer on Kidney Diseases, 8e (GN classification)
- Harrison's Principles of Internal Medicine, 22e
- Heerspink et al. (2026). Proteinuria or Albuminuria as Markers of Kidney and Cardiovascular Disease Risk. Ann Intern Med. PMID 41183334
How congestive heart failure causes folate deficiency
heart failure folate deficiency mechanism
PMID: 40976554
How Congestive Heart Failure Causes Folate Deficiency
- Malabsorption (minor cause)
- Excess urinary loss
Mechanism 1: Excess Urinary Folate Loss (Primary Mechanism)
- Excess urinary folate losses of >100 µg/day may occur in patients with CHF.
- This appears to be due to release of folate from damaged liver cells - hepatic congestion from right-sided heart failure (congestive hepatopathy) causes hepatocyte injury, releasing intracellular folate stores into the circulation, from where it is filtered and lost in the urine.
- Folate is loosely bound to plasma proteins (unlike vitamin B12 which is tightly bound), making it easily filtered at the glomerulus. Any sudden rise in plasma free folate (from liver cell release) exceeds tubular reabsorptive capacity and is excreted.
- Active liver disease independently shares this mechanism, which is why Harrison's groups "CHF and liver disease" together under this heading.
"Excess urinary folate losses of >100 µg per day may occur in some of these patients [CHF and liver disease]. It appears to be due to release of folate from damaged liver cells." - Harrison's, 22e
Mechanism 2: Malabsorption (Minor Cause)
- Congestion of intestinal veins - elevated right atrial pressure in CHF backs up into the portal and splanchnic venous systems, causing passive venous congestion of the gut wall (intestinal edema).
- This edema of the intestinal mucosa impairs the normal absorptive function of enterocytes, including the uptake of folate (which is absorbed primarily in the proximal jejunum via the proton-coupled folate transporter, PCFT).
- The same mechanism underlies malabsorption of other nutrients (fat-soluble vitamins, iron, some water-soluble vitamins) in severe chronic heart failure.
- This is analogous to folate malabsorption seen in other conditions with mucosal disruption (Crohn's disease, jejunal resection, Whipple's disease, scleroderma, diabetic enteropathy) - all of which appear in the same "minor causes" row of Harrison's table alongside CHF.
Mechanism 3: Poor Dietary Intake (Contributory)
- Cardiac cachexia - chronic low-grade systemic inflammation (elevated TNF-α, IL-6) causing anorexia and muscle wasting.
- Fatigue and dyspnea impairing ability to prepare or eat adequate meals.
- Nausea and early satiety from gut congestion, hepatomegaly, and ascites.
- Iatrogenic fluid and dietary restriction (sodium restriction diets often reduce overall dietary variety and folate-rich food intake).
- CHF patients are often elderly, isolated, or in lower socioeconomic groups - all independently listed risk factors for dietary folate deficiency.
Mechanism 4: Diuretic Use (Indirect)
- High urine flow rates that wash out water-soluble vitamins including folate.
- This is well-established for thiamine (Kaplan & Sadock's cites CHF treated with diuretics as a cause of thiamine deficiency via "renal tubular reabsorption" impairment), and the same mechanism applies in principle to folate.
- Triamterene (a potassium-sparing diuretic occasionally used in CHF) is a known folate antagonist - it inhibits dihydrofolate reductase, impairing folate utilization (Harrison's, 22e).
Summary Table
| Mechanism | How CHF Triggers It | Notes |
|---|---|---|
| Excess urinary folate loss | Hepatic congestion → hepatocyte injury → folate released from liver cells → filtered and lost | Primary CHF-specific mechanism; >100 µg/day loss |
| Intestinal malabsorption | Venous congestion → gut wall edema → impaired jejunal absorption | Minor cause; same mechanism as Crohn's, scleroderma |
| Poor dietary intake | Anorexia, fatigue, nausea, cardiac cachexia | Common but non-specific to CHF |
| Diuretic-related loss | High urine flow (loop diuretics) washes out folate; triamterene inhibits DHFR | Iatrogenic contribution |
Clinical Consequence and the Folate-Homocysteine-CHF Cycle
- CHF → folate deficiency (as above).
- Folate deficiency → homocysteine accumulation (hyperhomocysteinemia, HHcy): folate is required as a methyl donor in the methionine cycle to remethylate homocysteine back to methionine.
- HHcy → myocardial hypertrophy and worsening HF: via oxidative stress, endothelial injury, impaired methylation reactions critical for cardiac function, and epigenetic modifications.
- Harrison's Principles of Internal Medicine, 22e - Table 104-5 and dedicated CHF/liver disease section
- Kaplan & Sadock's Comprehensive Textbook of Psychiatry (diuretic-related vitamin loss mechanism)
- Wang Y et al. (2026). The complex link of the folate-homocysteine axis to myocardial hypertrophy and heart failure. J Adv Res. PMID 40976554
What does left and right shift means in neutrophil maturation
neutrophil maturation stages left shift band forms peripheral blood smear
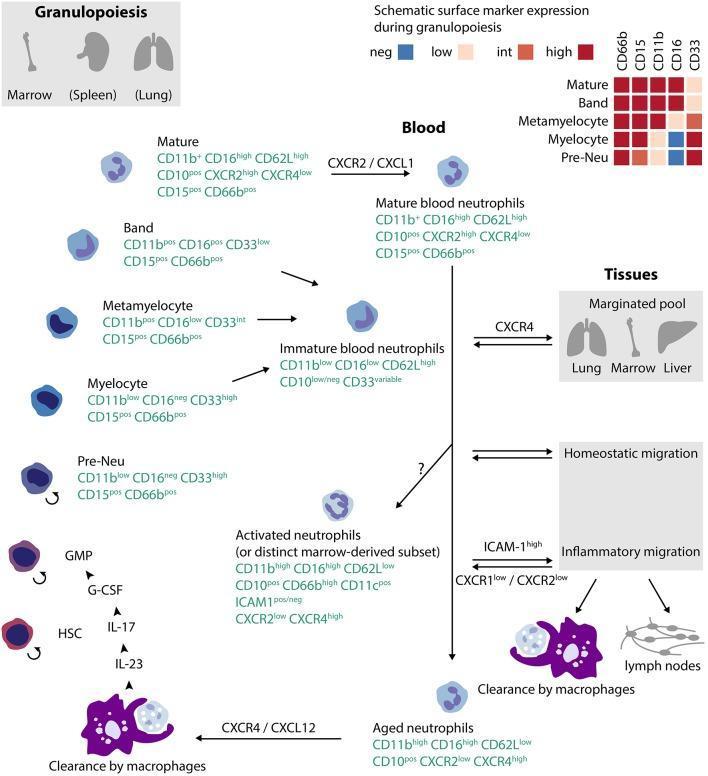
This pathophysiology diagram illustrates the lifecycle of human neutrophils, from granulopoiesis in the bone marrow to blood circulation and tissue clearance. The diagram details the progression from Hematopoietic Stem Cells (HSC) and Granulocyte-Monocyte Progenitors (GMP) through maturation stages including pre-Neu, myelocyte, metamyelocyte, and band cells to mature neutrophils. Key surface marker profiles are provided for each stage, highlighting the dynamic expression of CD11b, CD16, CD10, CD33, and CD62L. A heatmap indicates the transition of CD66b, CD15, CD11b, CD16, and CD33 expression levels during differentiation. In the blood compartment, the diagram distinguishes between mature, immature, activated, and aged neutrophils, noting chemotactic receptors like CXCR2 (mobilization) and CXCR4 (homing/aging). The right side of the infographic shows neutrophil fates: margination in the lung, marrow, and liver; homeostatic tissue migration; and inflammatory migration mediated by ICAM-1. The lifecycle concludes with clearance by macrophages in the tissues or bone marrow, providing a comprehensive overview of neutrophil ontogeny, heterogeneity, and functional trafficking.
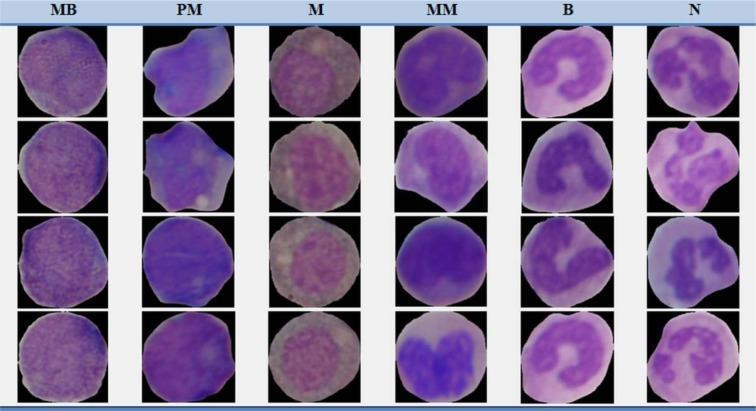
This composite diagnostic image displays a comparison chart of hematological cells from non-cancerous bone marrow aspirations, organized to show the maturation stages of the myeloid series. The visual consists of a grid with six columns, each representing a specific stage of development: Myeloblast (MB), Promyelocyte (PM), Myelocyte (M), Metamyelocyte (MM), Band (B), and Neutrophil (N). The cells are stained with Giemsa, revealing characteristic morphological changes in nuclear and cytoplasmic structure. Early stages (MB, PM) show large, round to oval nuclei with high nuclear-to-cytoplasmic (N:C) ratios and basophilic cytoplasm. As maturation progresses through the Myelocyte and Metamyelocyte stages, the nuclei become smaller and more indented. The Band (B) stage is characterized by an elongated, curved, non-segmented nucleus. The terminal stage, the Neutrophil (N), demonstrates distinct nuclear lobulation (typically 2-3 lobes) and increased cytoplasmic granularity. This image serves as an educational reference for identifying white blood cell precursors in the context of healthy hematopoiesis and chronic myelogenous leukemia (CML) classification.
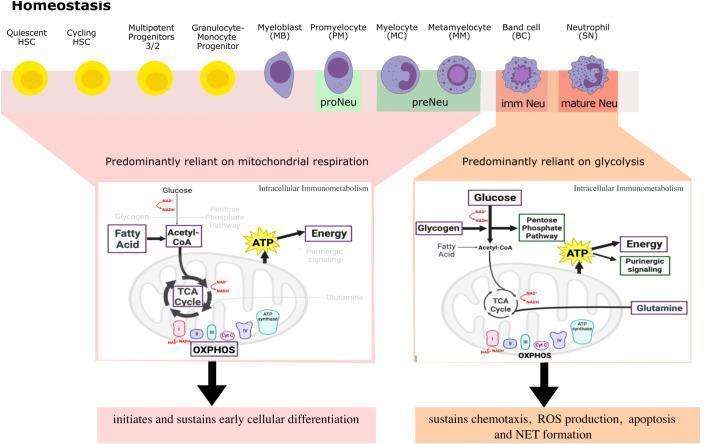
This hematology infographic illustrates the metabolic reprogramming of neutrophils during homeostasis. The top panel depicts neutrophil development (granulopoiesis) from hematopoietic stem cells (HSCs) through various stages: Myeloblast (MB), Promyelocyte (PM), Myelocyte (MC), Metamyelocyte (MM), Band cell (BC), and segmented Neutrophil (SN). Morphological changes show nuclear progression from round/ovoid to indented and ultimately multi-lobed. The bottom panel highlights a significant immunometabolic shift. Immature stages (HSCs to Metamyelocytes) are predominantly reliant on mitochondrial respiration, utilizing fatty acids and glucose to fuel the TCA cycle and oxidative phosphorylation (OXPHOS) for ATP generation; this metabolic state sustains early cellular differentiation. In contrast, mature neutrophils (Band cells and SNs) transition to being predominantly reliant on glycolysis. In these mature cells, glucose and glycogen fuel the pentose phosphate pathway and glycolysis to produce ATP, which sustains effector functions including chemotaxis, ROS production, apoptosis, and NET formation. The diagram emphasizes the shift from high mitochondrial activity in progenitors to glycolytic dominance in terminally differentiated innate immune cells.
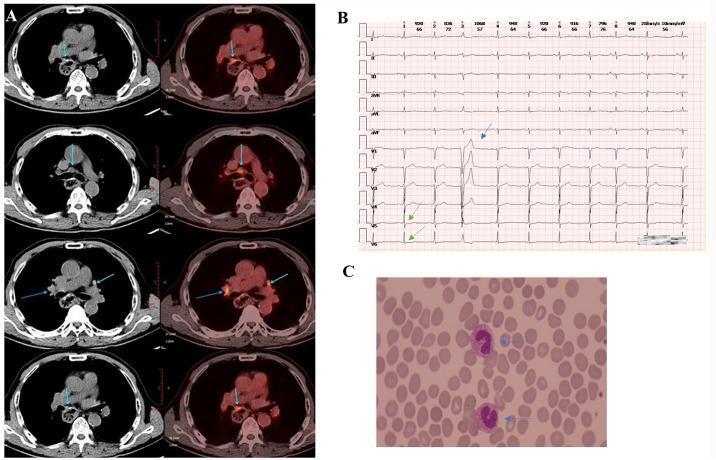
A multi-panel figure containing diagnostic imaging, an electrocardiogram (ECG), and a blood smear. Panel A presents axial PET/CT fusion and CT images of the thoracic and upper abdominal regions, showing a soft tissue mass near the esophageal hiatus and retroperitoneal abdominal trunk with hypermetabolic fluorodeoxyglucose (FDG) uptake, indicating tumor recurrence or metastasis. Panel B displays a 12-lead ECG strip demonstrating arrhythmias including premature atrial contractions (PACs) and premature ventricular contractions (PVCs). Green arrows highlight mild ST-segment depression in leads V5 and V6, while the blue arrow points to significant T-wave morphology changes, suggesting immunotherapy-related myocardial injury. Panel C is a peripheral blood smear micrograph showing two neutrophils with a left shift in nuclei (indicated by blue arrows), characterized by immature band forms, which is suggestive of an acute inflammatory response or infection. This composite illustrates the clinical monitoring of a patient with esophageal squamous cell carcinoma experiencing immune-related adverse events.
Left Shift and Right Shift in Neutrophil Maturation
The Origin of the Terminology
Normal Neutrophil Maturation Sequence
| Stage | Size | Nuclear Features | Cytoplasmic Features | Normal Location |
|---|---|---|---|---|
| Myeloblast | 15-20 µm | Round/ovoid; high N/C ratio; finely dispersed chromatin; 1+ prominent nucleoli | Thin rim, lightly basophilic; agranular | Bone marrow only |
| Promyelocyte | 12-24 µm (largest) | Ovoid, eccentric; nucleoli still visible | Basophilic with primary (azurophilic) granules; paranuclear hof | Bone marrow only |
| Myelocyte | 10-18 µm | Round to ovoid; no nucleolus; condensing chromatin | Secondary (specific) granules appear; amphophilic appearance. Last stage capable of mitosis | Bone marrow only |
| Metamyelocyte | 10-18 µm | Kidney-shaped (indented <50% of width) | Abundant secondary pink granules | Bone marrow only |
| Band | 10-18 µm | U-, S-, or horseshoe-shaped; indentation >50% of width; no distinct lobes | Pale with tan-pink secondary granules | Bone marrow + up to 10% of blood |
| Segmented neutrophil | 10-14 µm | 2-5 lobes connected by thin chromatin threads | Pale with pink granules | Bone marrow + blood (predominant blood form) |
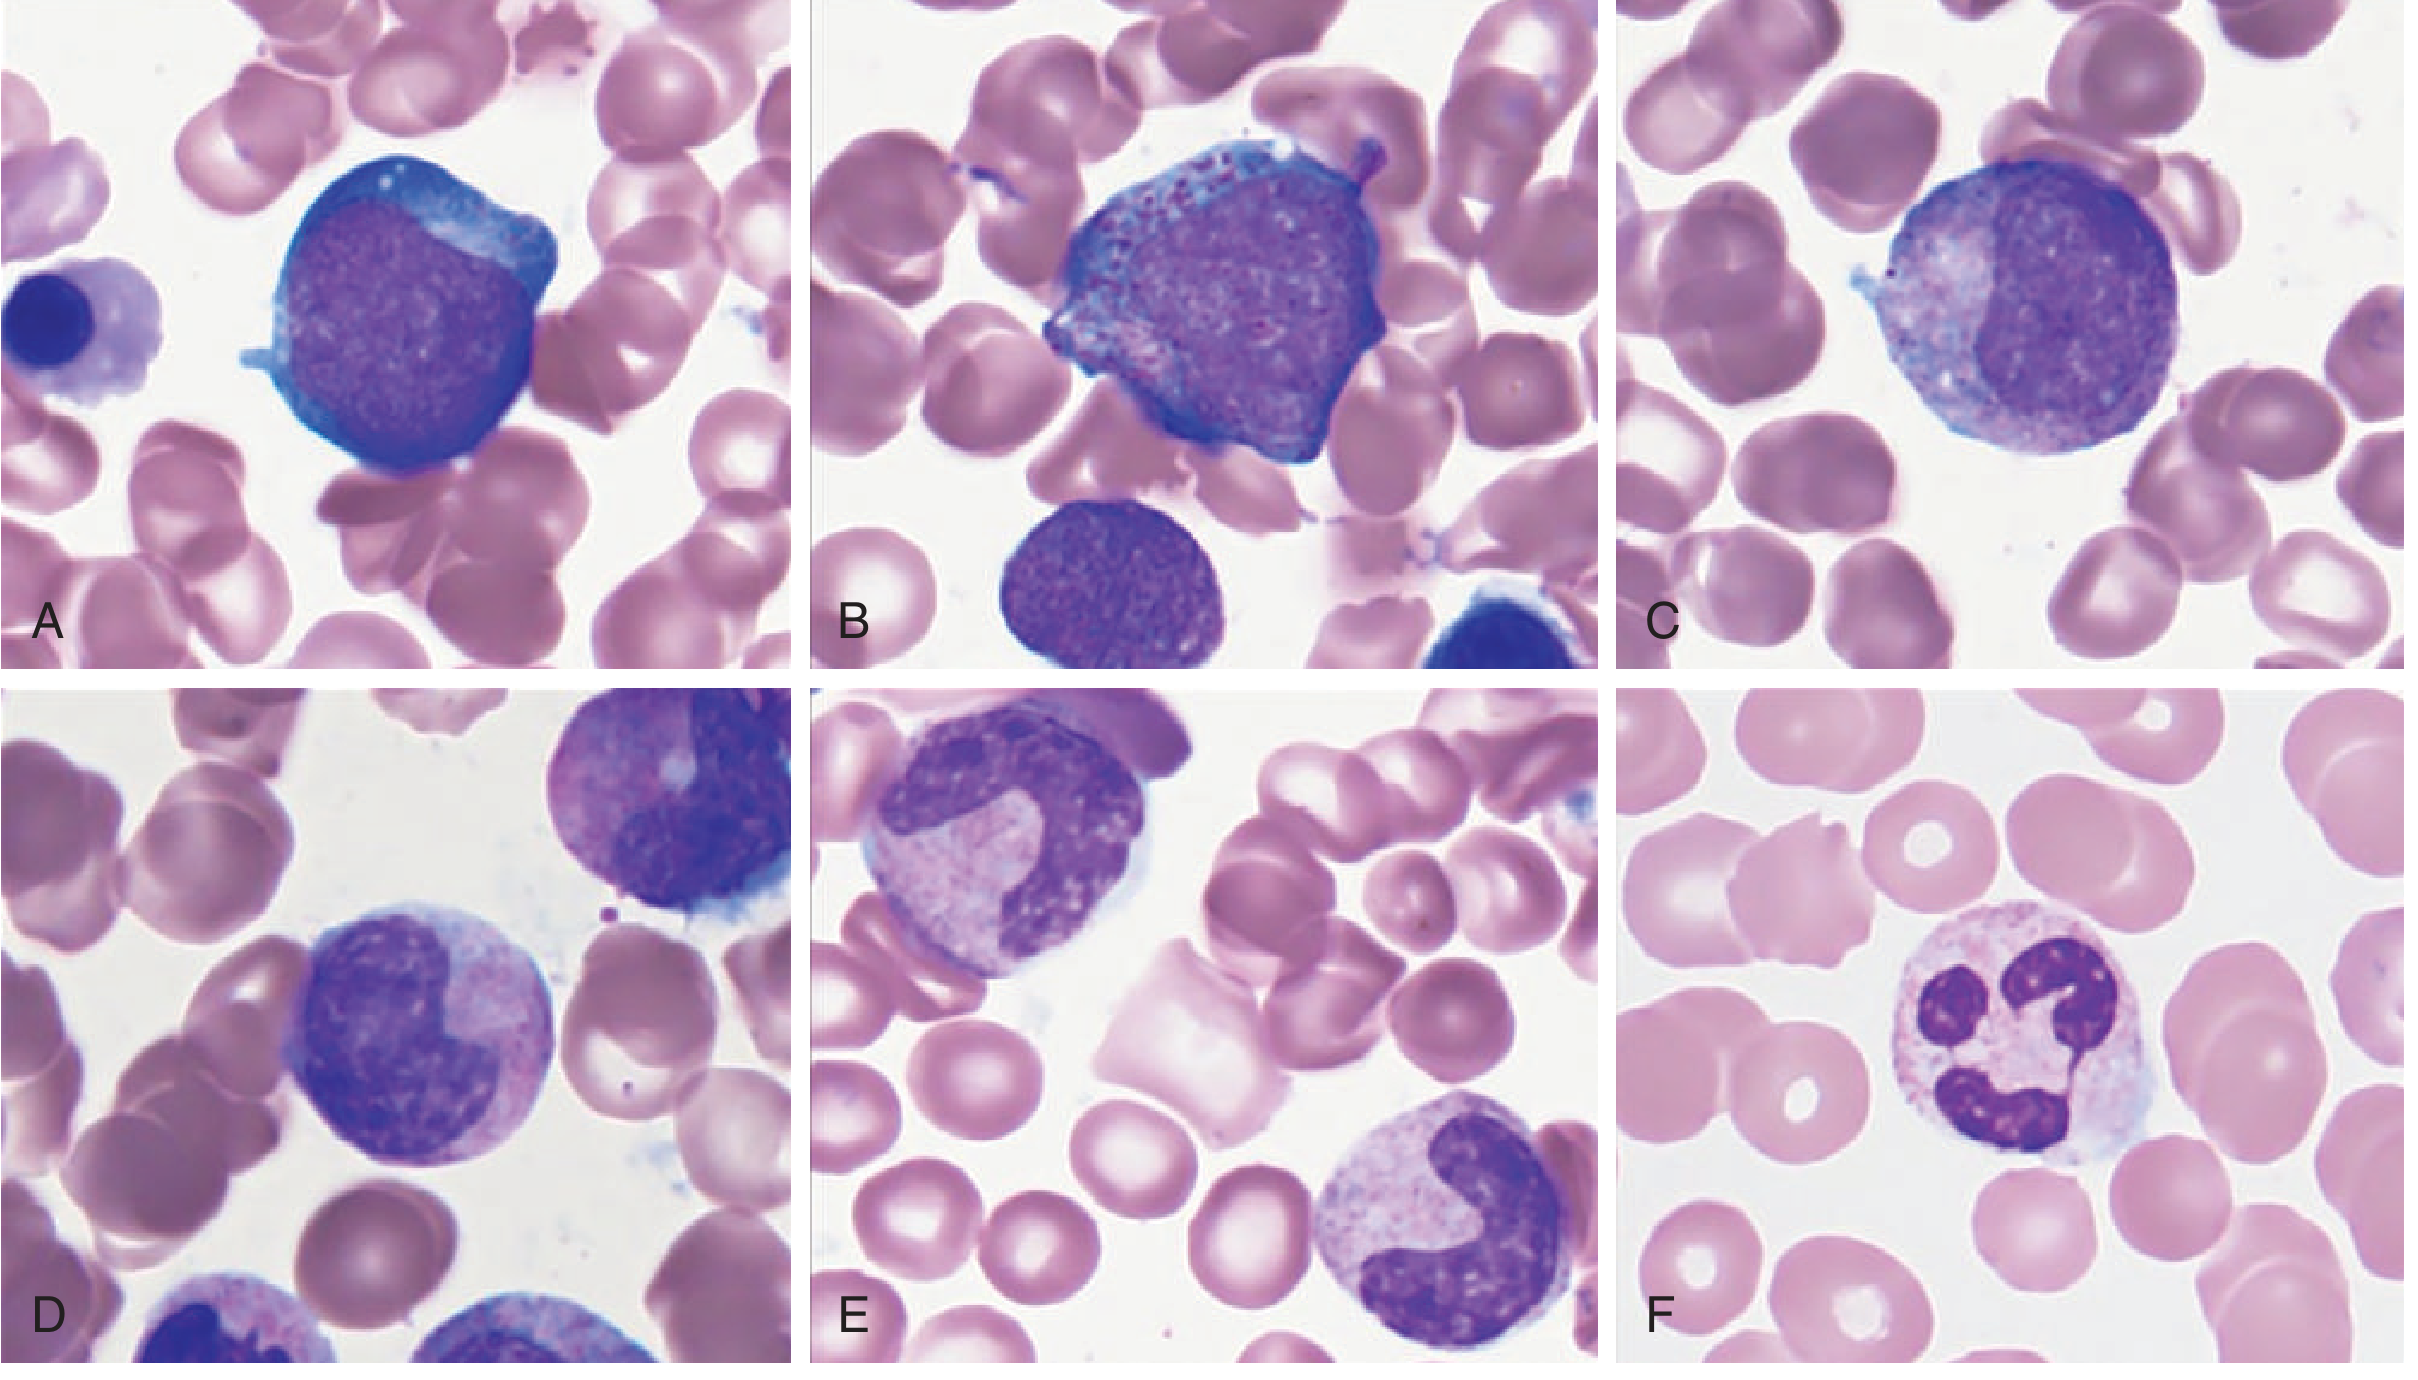
LEFT SHIFT
Definition
"Bands are immature neutrophils that have not completed nuclear condensation and have a U-shaped nucleus. Bands reflect a left shift in neutrophil maturation in an effort to make more cells more rapidly." - Harrison's Principles of Internal Medicine, 22e
Forms seen (in order of increasing severity of left shift)
- Bands (most common immature form in blood)
- Metamyelocytes
- Myelocytes
- Promyelocytes (severe left shift - suggests leukemia or leukemoid reaction)
- Myeloblasts (extreme - leukaemia until proven otherwise)
Why it happens - Mechanism
- The bone marrow is forced to release immature cells prematurely to meet an urgent demand for more neutrophils.
- The marrow's storage pool of mature forms is depleted faster than new ones can be made, so earlier precursors are released.
Associated findings on smear
- Toxic granulation: darker, coarser primary granules in cytoplasm - reflects accelerated production.
- Döhle bodies: small blue cytoplasmic inclusions (remnant rough ER) - sign of infection/burns.
- Cytoplasmic vacuolation: suggests bacterial sepsis.
Causes
| Cause | Notes |
|---|---|
| Bacterial infection | Most common cause |
| Sepsis | Severe left shift with toxic changes |
| Tissue necrosis / trauma / surgery | |
| Burns | |
| Inflammatory states (e.g., appendicitis, pancreatitis) | |
| Leukemoid reaction | WBC >50,000/µL with left shift; bands + metamyelocytes + myelocytes; distinguished from CML by elevated neutrophil alkaline phosphatase |
| CML (leukaemia) | Left shift but with decreased NAP score, Philadelphia chromosome |
| Corticosteroids | Demargination + release from marrow storage pools |
RIGHT SHIFT
Definition
"The presence of neutrophils with more than five nuclear lobes suggests megaloblastic anemia." - Harrison's, 22e
Criteria for hypersegmentation (right shift)
- Any single neutrophil with ≥6 lobes, OR
- >5% of neutrophils with 5 lobes, OR
- Increased median lobe count (Tietz, 7e; Goldman-Cecil Medicine)
Photomicrograph - Hypersegmented neutrophil (right shift) in megaloblastic anemia:
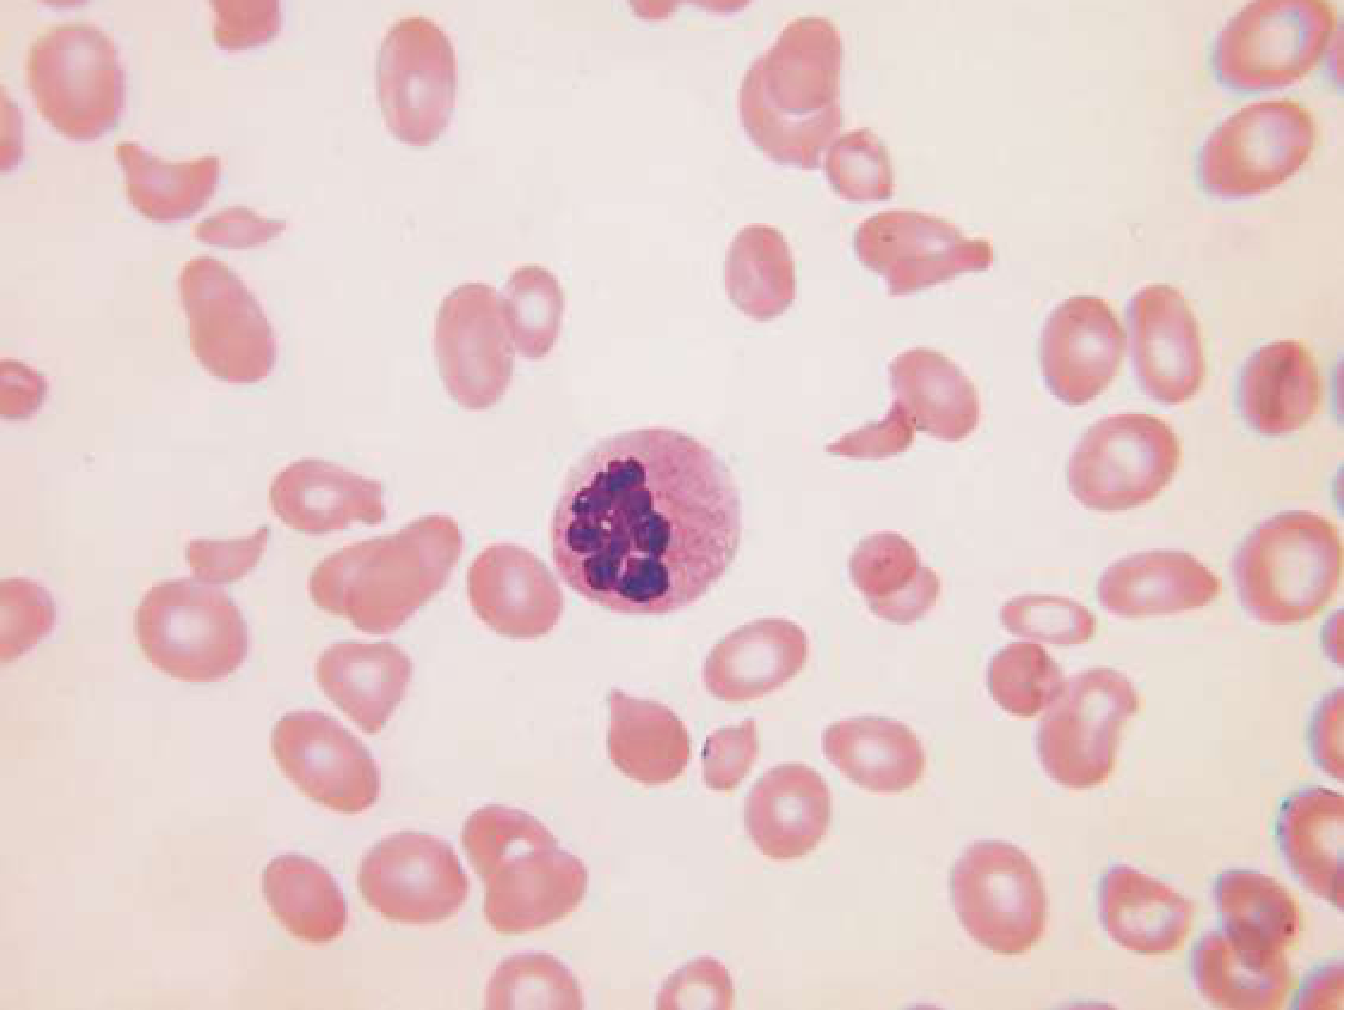
Why it happens - Mechanism
- In vitamin B12 or folate deficiency, DNA synthesis is impaired but RNA/protein synthesis continues normally.
- This causes nuclear-cytoplasmic dissynchrony: cytoplasm matures normally, but the nucleus lags behind and cannot complete proper segmentation and lobulation cycles.
- As the neutrophil ages in circulation, it continues to segment into additional lobes rather than dying off - resulting in hypersegmentation.
- Per Henry's Clinical Diagnosis: "The cell cytoplasm matures, while the nucleus remains immature, and the cell appears megaloblastic. This lack of synchrony produces hypersegmented neutrophils."
Causes
| Cause | Notes |
|---|---|
| Folate deficiency | Most common cause |
| Vitamin B12 deficiency | Pernicious anemia, vegans, malabsorption |
| Myelodysplastic syndrome (MDS) | Also shows hypolobulated (pseudo-Pelger-Huet) neutrophils |
| Renal failure / uraemia | |
| Iron deficiency (rarely) | Mild hypersegmentation |
| Hereditary hypersegmentation | Rare benign variant |
Side-by-Side Comparison
| Feature | Left Shift | Right Shift |
|---|---|---|
| Nuclear appearance | Immature (unsegmented, U-/kidney-shaped) | Hypersegmented (≥6 lobes) |
| Forms seen | Bands, metamyelocytes, myelocytes | Segmented neutrophils with excess lobes |
| Mechanism | Rapid demand → premature BM release | DNA synthesis failure → nuclear maturation arrest |
| Primary cause | Infection, inflammation, sepsis | Megaloblastic anemia (B12/folate deficiency) |
| Associated smear | Toxic granulation, Döhle bodies, vacuolation | Macroovalocytes, anisocytosis, poikilocytosis |
| WBC count | Usually elevated (leukocytosis) | Usually normal or low |
| Clinical urgency | Suggests active infection/sepsis | Suggests nutritional deficiency |
- Harrison's Principles of Internal Medicine, 22e - Chapter 65 (Interpreting Peripheral Blood Smears)
- Tietz Textbook of Laboratory Medicine, 7e - Chapter 75 (Normal Morphology and Stages of Maturation)
- Henry's Clinical Diagnosis and Management by Laboratory Methods - Macrocytic Anemia section
- Goldman-Cecil Medicine - Figure 143-21 (Hypersegmented Neutrophils)
- Henry's Clinical Diagnosis - Leukemoid Reaction section