
Amidarone side affects
amiodarone side effects toxicity 2025
amiodarone corneal microdeposits side effects
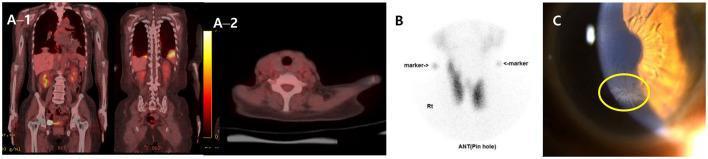
This composite educational image illustrates multi-organ manifestations of amiodarone toxicity through diagnostic imaging and clinical photography. Panel A shows FDG PET-CT scans: the whole-body coronal view (A-1) displays multiple hypermetabolic lesions throughout the lung fields, while the axial thyroid view (A-2) shows no abnormal tracer uptake. Panel B presents a technetium-99m pertechnetate thyroid scintigraphy scan, demonstrating diffuse, homogenous tracer uptake in both lobes, characteristic of type 1 amiodarone-induced thyrotoxicosis in the context of Graves' disease. Panel C is a slit-lamp biomicroscopy photograph of the cornea, highlighting 'vortex keratopathy' (cornea verticillata). A yellow circle denotes the characteristic dense, gray granular lines forming a swirling, vortex-like pattern radiating from the inferior corneal region. Together, these images demonstrate the systemic impact of amiodarone, including pulmonary toxicity (hypermetabolic lung lesions), thyroid dysfunction, and ocular side effects (corneal deposits).
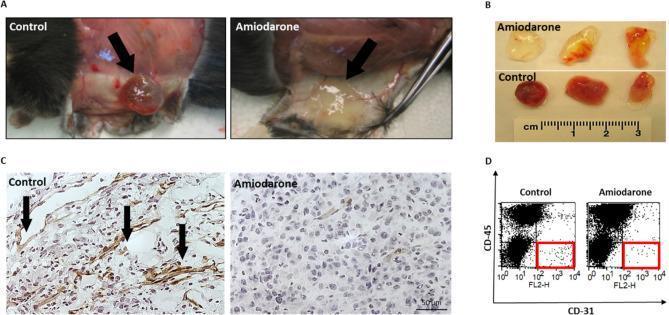
This composite educational figure illustrates the anti-angiogenic effects of Amiodarone using a mouse Matrigel plug assay. Panel A and B present clinical photographs of Matrigel plugs in situ and post-excision. The control group shows deep red, bloody plugs with extensive surrounding vasculature, while the Amiodarone-treated group exhibits pale, translucent plugs with significantly reduced vessel formation. Panel C shows light microscopy images of histological sections (400x magnification) stained with anti-CD31 antibodies (DAB-brown) and Gill’s Hematoxylin (blue nuclei). The control section demonstrates numerous brown-stained vascular structures with open lumens (indicated by arrows), whereas the treated section shows sparse CD31 positivity and a lack of organized vessel architecture. Panel D contains flow cytometry (FACS) dot plots comparing CD31+ / CD45- endothelial cell populations (highlighted in red squares). The plots demonstrate a quantitative reduction in infiltrating endothelial cells in the Amiodarone-treated plugs compared to the untreated control. This image is relevant for studying pharmacological inhibition of angiogenesis and tumor microenvironment modulation.
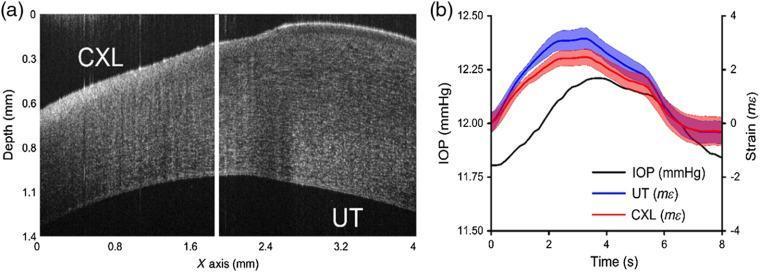
Educational medical graphic depicting corneal biomechanical analysis through Optical Coherence Tomography (OCT) and strain measurement. Panel (a) presents a cross-sectional structural OCT image of a cornea, divided into a cross-linked region (CXL) and an untreated region (UT). Visually, the CXL side demonstrates a notable reduction in corneal thickness and altered optical scattering compared to the thicker, untreated UT side. Panel (b) features a line graph correlating intraocular pressure (IOP) with cumulative tissue strain over an 8-second interval. The graph shows that under a pulsed IOP load (black line, 11.75 to 12.25 mmHg), the CXL cornea (red curve) exhibits significantly lower cumulative strain (mε) than the UT cornea (blue curve). This visual comparison highlights the increased mechanical stiffness and structural changes resulting from corneal cross-linking treatment, a common ophthalmic procedure for keratoconus. The image serves as a clinical demonstration of how optical coherence elastography (OCE) can monitor and quantify the effects of corneal strengthening interventions.
Amiodarone Side Effects
1. Pulmonary Toxicity (Most Serious Non-Cardiac Effect)
- Incidence: 1-17% depending on dose and duration; fatal in ~10% of cases
- Presentations: Hypersensitivity pneumonitis, interstitial/alveolar pneumonitis, pleural effusions, pulmonary fibrosis
- Symptoms: Progressive dyspnoea, non-productive cough, fatigue, weight loss, low-grade fever
- Mechanism: Direct toxic phospholipid accumulation + possible hypersensitivity reaction
- Monitoring: Baseline chest X-ray + pulmonary function tests (including DLCO); repeat every 3-6 months
- Management: Usually reversible on withdrawal ± corticosteroids, but may be permanent
2. Thyroid Dysfunction
- Both hypothyroidism AND hyperthyroidism can occur (amiodarone contains ~37% iodine by weight)
- Hyperthyroidism can be Type 1 (excess iodine driving synthesis) or Type 2 (destructive thyroiditis)
- Monitor TFTs before starting and every 3-6 months during therapy
- Can persist for months after stopping due to the drug's extremely long half-life (40-55 days)
3. Hepatotoxicity
- Elevation of liver enzymes is common (up to 3x normal in many patients)
- Overt liver injury is less common but can be fatal
- Mechanism: phospholipidosis and direct hepatocellular damage
- Monitoring: Baseline LFTs; discontinue if transaminases rise >3x normal or double from an elevated baseline
4. Ocular Effects
- Corneal microdeposits (vortex keratopathy): Occurs in virtually all patients on long-term therapy; usually asymptomatic or causes mild visual halos/blurring - not a reason to stop the drug
- Optic neuritis/atrophy: Rare but can cause permanent visual loss; causal relationship not firmly established
- Annual ophthalmology review is recommended
5. Cardiovascular (Proarrhythmic + Conduction Effects)
- Bradycardia and heart block (especially in patients on concurrent beta-blockers or calcium channel blockers)
- QT prolongation - can rarely precipitate torsades de pointes (less common than with other QT-prolonging drugs due to amiodarone's complex pharmacology)
- Hypotension with IV administration (partly due to the solvent polysorbate 80)
- Can paradoxically worsen existing arrhythmias or trigger new ones
6. Neurological / Neuromuscular
- Peripheral neuropathy (correlates with serum levels)
- Proximal muscle weakness / myopathy
- Tremor, ataxia, sleep disturbances
- These often improve with dose reduction
7. Skin / Dermatological
- Photosensitivity - patients must use high-SPF sunscreen and protective clothing
- Blue-grey skin discolouration (slate-grey pigmentation) with prolonged use, especially sun-exposed areas - this is largely irreversible
8. Gastrointestinal
- Nausea, vomiting, anorexia, constipation (especially early in therapy or at high doses)
- Often the most common reason patients find the drug uncomfortable
Key Drug Interactions
- Warfarin - significantly increases INR (reduce warfarin dose by ~30-50%)
- Digoxin - raises digoxin levels (halve the digoxin dose)
- Statins - increased risk of myopathy (especially simvastatin)
- Other QT-prolonging drugs - additive risk of torsades
Monitoring Summary
| Parameter | Baseline | During therapy |
|---|---|---|
| CXR + PFTs | Yes | Every 3-6 months |
| LFTs | Yes | Every 6 months |
| TFTs | Yes | Every 3-6 months |
| Serum electrolytes | Yes | Periodically |
| ECG | Yes | Periodically |
| Eye exam | Yes | Annually |
Densonumab
denosumab mechanism uses side effects 2025 2026
denosumab RANKL osteoclast mechanism bone resorption
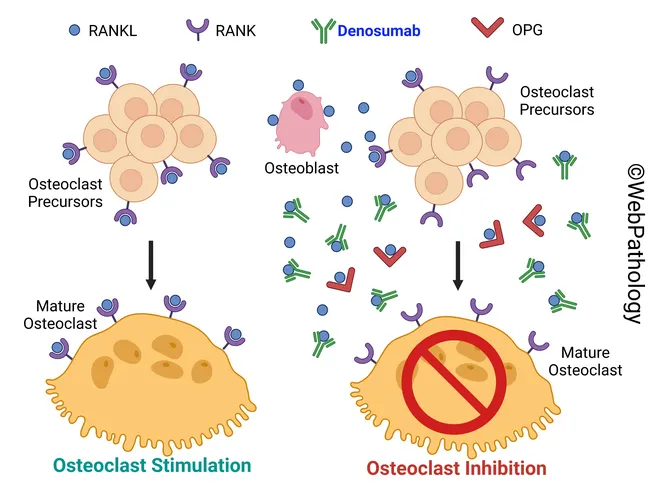
This educational digital illustration depicts the RANKL-RANK-OPG regulatory axis governing osteoclast development and bone resorption. The left panel shows osteoblasts secreting RANKL (receptor activator of NF-kB ligand) that engages RANK on osteoclast precursors, promoting osteoclast maturation and bone-resorbing activity; osteoclasts become mature osteoclasts at the bone surface, initiating resorption on a cortical or trabecular bone interface. The right panel demonstrates pharmacologic inhibition by denosumab, a human monoclonal antibody that binds RANKL and prevents RANK-RANKL signaling, thereby blocking osteoclast formation, reducing resorptive function, and decreasing osteoclast survival. In this inhibited scenario, osteoblasts continue signaling but osteoclastogenesis is suppressed, leading to reduced cavitation and diminished bone turnover. The image also references osteoprotegerin (OPG) as the endogenous decoy receptor for RANKL. The layout includes legend items labeling RANKL, RANK, denosumab, and OPG, and captions Osteoclast Stimulation and Osteoclast Inhibition. Although schematic, the depiction captures clinically relevant concepts: denosumab therapy for osteoporosis and Paget disease when bisphosphonates are contraindicated (e.g., renal failure). This illustration supports educational understanding of antiresorptive therapy, mechanism of action, and pathway interactions, useful for teaching, review, and clinical discussion about bone remodeling, osteoclast biology, and targeted osteoporosis treatment. This educational figure is intended for medical students, residents, and clinicians.
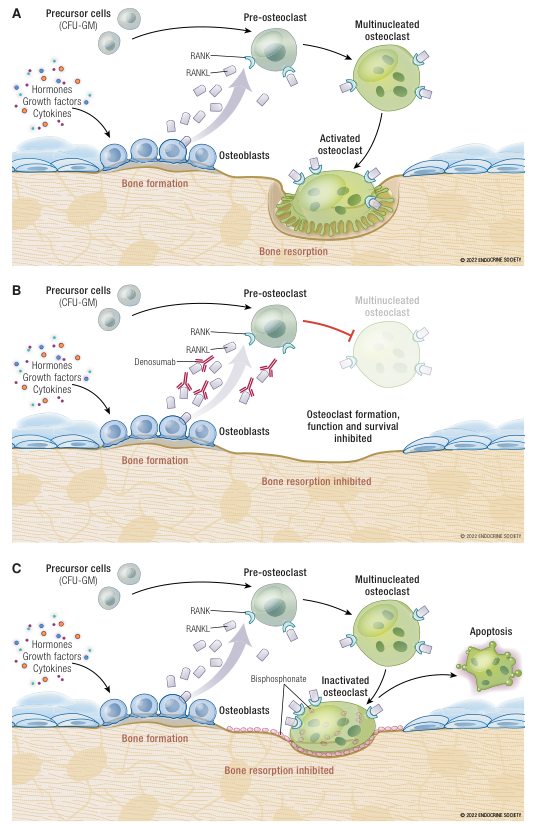
Summary : This figure illustrates the cellular mechanisms of bone formation and resorption, and the effects of two classes of drugs (denosumab and bisphosphonates) on osteoclast development and activity. It is divided into three panels (A, B, C) showing normal physiology, denosumab action, and bisphosphonate action, respectively. process diagram: # Panel A: Normal Bone Remodeling : • Precursor cells (CFU-GM) differentiate into pre-osteoclasts under the influence of hormones, growth factors, and cytokines. • Osteoblasts produce RANKL, which binds to RANK on pre-osteoclasts, promoting their maturation into multinucleated osteoclasts. • Activated osteoclasts resorb bone, while osteoblasts form bone, maintaining bone homeostasis. # Panel B: Denosumab Action : • Denosumab (depicted as Y-shaped antibodies) binds to RANKL, preventing its interaction with RANK on pre-osteoclasts. • This inhibits the formation, function, and survival of osteoclasts (multinucleated osteoclast faded out). • Bone resorption is inhibited, while bone formation by osteoblasts continues. # Panel C: Bisphosphonate Action : • Precursor cells and RANKL-RANK signaling proceed as in normal physiology, allowing osteoclast formation. • Bisphosphonate (depicted as pink triangles) acts on activated osteoclasts, inactivating them and inducing apoptosis. • Inactivated osteoclasts cannot resorb bone, and apoptotic osteoclasts are removed. • Bone resorption is inhibited, while bone formation by osteoblasts continues. # Nodes : • Precursor cells (CFU-GM) (circle) • Pre-osteoclast (circle) • Multinucleated osteoclast (large circle with nuclei) • Activated osteoclast (large cell with ruffled border) • Inactivated osteoclast (large cell, faded) • Apoptosis (fragmented cell) • Osteoblasts (row of blue cells) • Hormones, growth factors, cytokines (colored dots) • RANK/RANKL (small squares) • Denosumab (Y-shaped antibodies) • Bisphosphonate (pink triangles) # Connectors : • Arrows show differentiation from precursor to pre-osteoclast to multinucleated osteoclast. • RANKL arrows from osteoblasts to pre-osteoclasts. • In panel B, red inhibitory line from pre-osteoclast to multinucleated osteoclast. • In panel C, arrow from bisphosphonate to activated osteoclast, then to inactivated osteoclast and apoptosis. # Layout : • Each panel is arranged horizontally: precursor cells on the left, osteoblasts at the bone surface, osteoclast lineage above the bone, and bone formation/resorption processes below. • Drug actions are superimposed on the normal pathway in panels B and C. # Analysis : • The figure demonstrates that normal bone remodeling involves a balance between osteoblast-mediated bone formation and osteoclast-mediated bone resorption. • Denosumab inhibits osteoclast formation by blocking RANKL, preventing bone resorption. • Bisphosphonates inactivate and induce apoptosis in mature osteoclasts, also inhibiting bone resorption. • Both drugs preserve bone formation while reducing bone loss, but act at different stages of the osteoclast lifecycle.
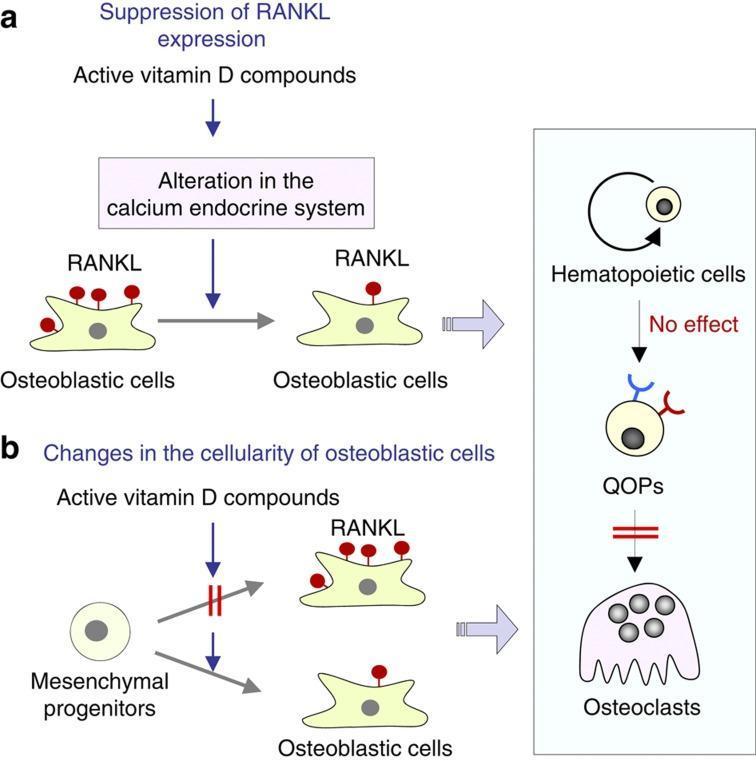
A medical signaling pathway diagram illustrating two mechanisms (a and b) by which active vitamin D compounds inhibit bone resorption by modulating RANKL expression. Mechanism (a) shows active vitamin D inducing an 'alteration in the calcium endocrine system,' which leads to the suppression of RANKL expression on the surface of osteoblastic cells, evidenced by a reduction in surface-bound RANKL molecules (red circles). Mechanism (b) depicts 'changes in the cellularity of osteoblastic cells,' where active vitamin D influences the differentiation of mesenchymal progenitors. This results in a population shift toward osteoblastic cells with lower RANKL expression. The right panel outlines the osteoclastogenic lineage, showing the progression from hematopoietic cells to cell-cycle-arrested quiescent osteoclast precursors (QOPs), and finally to multinucleated osteoclasts. A red inhibitory bar indicates that active vitamin D potentially blocks the maturation of QOPs into active osteoclasts, while having 'no effect' on the initial hematopoietic-to-QOP transition.
Denosumab (Prolia / Xgeva)
Drug Class
Mechanism of Action
Approved Indications
| Indication | Formulation |
|---|---|
| Postmenopausal osteoporosis (high fracture risk) | Prolia 60 mg SC every 6 months |
| Osteoporosis in men at high risk | Prolia 60 mg SC every 6 months |
| Glucocorticoid-induced osteoporosis | Prolia 60 mg SC every 6 months |
| Breast cancer on aromatase inhibitors | Prolia |
| Prostate cancer on androgen deprivation therapy | Prolia |
| Bone metastases / multiple myeloma (skeletal-related events) | Xgeva 120 mg SC monthly |
| Hypercalcaemia of malignancy | Xgeva |
| Giant cell tumour of bone | Xgeva |
Efficacy
- Reduces vertebral fractures by ~68%, hip fractures by ~40%, and non-vertebral fractures by ~20% over 3 years (FREEDOM trial)
- Fracture rates remain low over 10 years of continuous treatment
- Reduces falls risk in osteoporotic patients
- Increases BMD in men on androgen deprivation therapy and women on aromatase inhibitors
Administration
- Route: Subcutaneous injection
- Dose (Prolia): 60 mg every 6 months
- Dose (Xgeva): 120 mg monthly (oncology indications)
- Does NOT require renal dose adjustment (unlike bisphosphonates), though caution needed in severe CKD
Side Effects
Common
- Musculoskeletal pain (back pain, limb pain, joint pain)
- Dermatitis, eczema, rash
- Urinary tract / upper respiratory infections
- GI upset, nausea
Serious / Important
| Side Effect | Details |
|---|---|
| Hypocalcaemia | Most important - occurs 1-2 weeks post-injection; severe in CKD (eGFR <30) / dialysis patients; correct with calcium + vitamin D |
| Osteonecrosis of the Jaw (MRONJ) | ~5/10,000 patient-years; risk rises with invasive dental procedures; inform dentist before procedures |
| Atypical femur fractures | ~1/10,000 patient-years; warn patients about unexplained thigh/groin pain |
| Serious infections | Cellulitis, endocarditis (rare); drug modulates immune function via RANKL pathway |
| Hypersensitivity / anaphylaxis | Rare but possible |
Critical: Rebound Effect on Discontinuation
- Rapid bone loss (especially trabecular)
- Significant increase in vertebral fracture risk (including multiple simultaneous fractures)
Key Monitoring
| Parameter | Timing |
|---|---|
| Serum calcium | Before each dose and within 2 weeks after |
| BMD (DEXA scan) | Every 1-2 years |
| Dental review | Before starting; regular during treatment |
| Signs of infection | Ongoing vigilance |
Comparison with Bisphosphonates
| Feature | Denosumab | Bisphosphonates |
|---|---|---|
| Site of action | Blocks RANKL (pre-osteoclast) | Acts on mature osteoclasts |
| Renal clearance | Not renally cleared - safer in CKD | Contraindicated if eGFR <30-35 |
| Rebound on stopping | Yes - significant | No |
| Route | Subcutaneous injection | Oral or IV |
| Duration of action | Short (reversible on stopping) | Long (incorporated into bone matrix) |
Pharmacokinetics
denosumab pharmacokinetics half-life bioavailability distribution metabolism
Denosumab Pharmacokinetics
A. Absorption
| Parameter | Value |
|---|---|
| Route | Subcutaneous (SC) injection |
| Bioavailability | ~61-64% |
| Onset of effect | 3-7 days |
| Time to peak concentration (T-max) | ~10 days (range: 3-21 days) |
| Absorption half-life | ~2.7 days |
- Serum concentrations are detectable within 1 hour of injection
- The slow absorption from the SC depot is reflected in the wide T-max range
B. Distribution
| Parameter | Value |
|---|---|
| Volume of distribution (central) | ~2.5-3.8 L (normalized to 66 kg) |
| Two-compartment model | Yes - with linear distribution to peripheral compartment |
| Crosses blood-brain barrier | No |
| Plasma protein binding | Not applicable (it IS a protein - an IgG2 antibody) |
| Bone incorporation | None - does not bind hydroxyapatite |
C. Metabolism
- Denosumab is a protein (monoclonal antibody) - it does not undergo hepatic cytochrome P450 metabolism
- Degraded via proteolytic catabolism to small peptides and amino acids, mainly by the reticuloendothelial system (RES)
- No active metabolites
- No hepatic involvement
- No CYP interactions (tested against CYP3A4 substrate midazolam - no interaction found)
D. Elimination
| Parameter | Value |
|---|---|
| Mean half-life | 25-28 days (after 60 mg SC dose) |
| Terminal half-life | 5-10 days (at end of serum concentration curve) |
| Linear (non-specific) clearance | ~3.1-3.25 mL/h per 66 kg |
| Renal excretion | None |
| Hepatic excretion | None |
| Detectable in serum for | Up to 9 months after dosing |
E. Steady State
- Achieved after approximately 6 months of every-6-month dosing (Prolia regimen)
- With the Xgeva regimen (120 mg monthly), RANKL occupancy at steady state exceeds 97% throughout the dosing interval in >95% of subjects
- No meaningful accumulation beyond steady state
F. Special Populations
| Population | Impact |
|---|---|
| Renal impairment (any stage) | No dose adjustment needed - not renally eliminated; however, hypocalcaemia risk is significantly higher with eGFR <30 |
| Hepatic impairment | No dose adjustment (not hepatically metabolised) |
| Body weight | Clearance and volume scale proportionally with body weight; no dose adjustment needed across typical weight ranges |
| Age | No clinically meaningful impact on PK |
| Race (Black/Hispanic patients) | Minor differences in clearance observed in some studies but not clinically significant |
| Aromatase inhibitor co-treatment | No impact on denosumab PK |
G. Why PK Explains the Rebound Phenomenon
Summary Table
| PK Parameter | Denosumab |
|---|---|
| Bioavailability (SC) | 61-64% |
| T-max | ~10 days |
| Half-life | ~25-28 days |
| Volume of distribution | ~2.5-3.8 L |
| Metabolism | Proteolytic catabolism (RES) |
| Renal excretion | None |
| CYP interactions | None |
| Bone incorporation | None |
| Kinetics type | TMDD (target-mediated) - non-linear at low doses |
About osteoporosis
osteoporosis diagnosis treatment guidelines 2025 2026
osteoporosis bone microarchitecture DEXA scan vertebral fracture
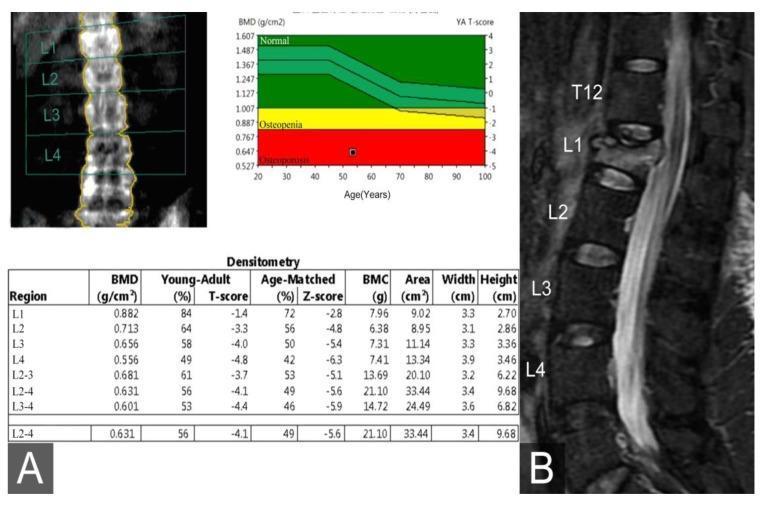
Educational medical composite image illustrating diagnostic findings of osteoporosis and an associated vertebral compression fracture. Panel A displays a Dual-Energy X-ray Absorptiometry (DEXA) report including a coronal lumbar spine scan (L1-L4), a densitometry table showing a critical T-score of -4.8 at L4, and a corresponding bone mineral density (BMD) graph. The graph plots BMD (g/cm²) against age, with color-coded reference ranges: green for normal, yellow for osteopenia, and red for osteoporosis; the patient's data point falls significantly within the osteoporosis range. Panel B presents a sagittal view MRI of the lumbar spine using a Short Tau Inversion Recovery (STIR) sequence. The MRI reveals a wedge-shaped deformity and hyperintense signal at the L1 vertebral body, characteristic of bone marrow edema from an acute osteoporotic compression fracture. Normal rectangular morphology is maintained in T12 and L2-L4. This visual set demonstrates the correlation between quantitative bone density measurements and clinical pathology in geriatric orthopedics.
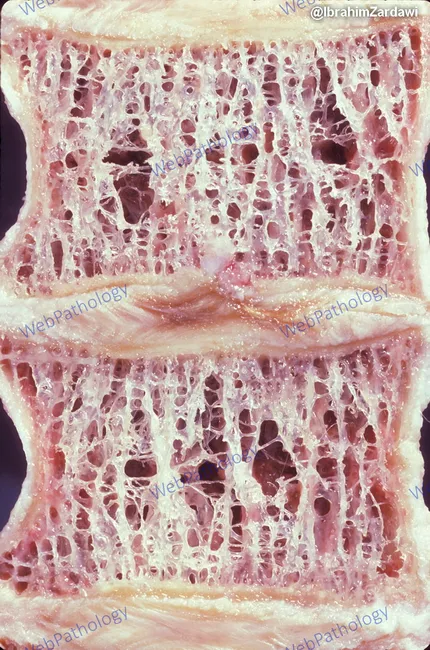
Light microscopy examination of a decalcified vertebral cancellous bone section from the vertebral body, stained with Hematoxylin and Eosin. The specimen demonstrates osteoporotic microarchitecture with thinning and dropout of bone spicules. The trabecular network shows enlarged intertrabecular spaces and extensive perforations, yielding a porous, lattice-like appearance. Horizontal trabeculae are thinner and there is loss of interconnectivity between trabecular plates, consistent with reduced bone strength. The endplates and cortical shell are variably preserved in this plane, while the marrow spaces appear expanded. These histologic features reflect diminished bone mass and compromised structural integrity. Clinically, this pattern is typical of osteoporosis or severe osteopenia, often associated with aging or postmenopausal status, and correlates with increased vertebral fracture risk. Differential considerations include disuse osteoporosis and other metabolic bone diseases when osteoid deposition or mineralization abnormalities are prominent. The diagnostic relevance lies in correlating histology with radiographic bone density (DEXA) and clinical risk factors, guiding therapy decisions such as antiresorptive or anabolic agents. This image serves educational purposes in teaching vertebral trabecular bone histology, osteoporosis pathology, and microarchitectural deterioration. Potential research applications include evaluating therapeutics aimed at preserving trabecular connectivity and vertebral strength. This histology correlates with radiographic densitometry and fracture risk in patients.
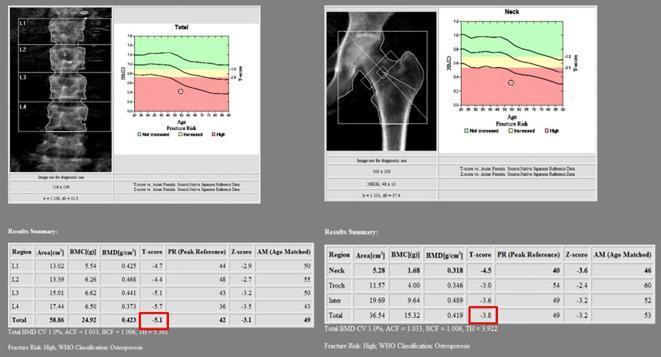
Dual-energy X-ray absorptiometry (DEXA) scan report presenting bone mineral density (BMD) analysis of the lumbar spine and proximal femur. The image is divided into two clinical diagnostic panels. The left panel shows the lumbar spine (L1–L4) with segmented vertebral regions, an associated fracture risk graph plotting BMD against age, and a quantitative 'Results Summary' table. The highlighted total T-score of -5.1 for the lumbar spine is significantly below the -2.5 threshold, indicating severe osteoporosis. The right panel displays the proximal femur (hip) with demarcated regions for the femoral neck, trochanter, and intertrochanteric area. Its corresponding fracture risk graph shows a data point deep within the red 'High Risk' zone. The summary table for the femur highlights a total T-score of -3.8, confirming a diagnosis of osteoporosis. Both panels include Z-scores, peak reference percentages (PR), and age-matched percentages (AM). This comparison chart illustrates diagnostic imaging and metabolic bone disease assessment for clinical education on osteoporosis classification and fracture risk stratification.
Osteoporosis
Definition
Epidemiology
- Affects ~200 million people worldwide
- 1 in 5 women has osteoporosis; postmenopausal women are most affected
- Hip fracture 1-year mortality: 20-30%
- <25% of fracture patients receive follow-up evaluation or treatment - a major missed opportunity in clinical practice - Harrison's 22E
-
50% of fractures (including hip fractures) occur in individuals with osteopenia, not frank osteoporosis
Pathophysiology
Key mechanisms:
- Estrogen normally suppresses RANKL and promotes osteoprotegerin (OPG)
- Loss of estrogen → ↑ RANKL, ↓ OPG → increased osteoclast formation, activity and lifespan
- Decreased osteoblast lifespan (accelerated apoptosis)
- Trabecular bone preferentially affected (80% of remodelling surface) → vertebral fractures earliest
- Harrison's 22E
- Declining osteoblast function with age
- Reduced calcium absorption and vitamin D synthesis
- Secondary hyperparathyroidism in the elderly
Risk Factors
| Non-modifiable | Modifiable |
|---|---|
| Female sex | Low calcium / vitamin D intake |
| Advancing age | Physical inactivity |
| White or Asian ethnicity | Smoking |
| Family history of osteoporosis | Excess alcohol (>2 units/day) |
| Prior fragility fracture | Low body weight (BMI <18.5) |
| Early menopause (<45 yrs) | Glucocorticoid use |
| Male hypogonadism | Excess thyroid hormone |
| Falls risk factors |
Secondary causes (SHATTERED mnemonic)
Clinical Features
- Often silent until a fracture occurs
- Fragility fracture = fracture from a force that would not normally break healthy bone (e.g., fall from standing height or less)
Fracture sites (in order of frequency):
- Vertebral (most common - often clinically silent; found incidentally on imaging)
- Distal radius (Colles' fracture)
- Hip (most dangerous - 20-30% 1-year mortality)
- Proximal humerus, pelvis, ribs
Consequences of vertebral fractures:
- Height loss, progressive kyphosis ("dowager's hump")
- Chronic back pain (from muscle/ligament strain, not the fracture itself)
- Respiratory compromise (severe kyphosis)
- Psychological: depression, social isolation, fear of falling
Diagnosis
1. Dual-Energy X-ray Absorptiometry (DEXA)
| T-score | Classification |
|---|---|
| > -1.0 | Normal |
| -1.0 to -2.5 | Osteopenia |
| ≤ -2.5 | Osteoporosis |
| ≤ -2.5 + fragility fracture | Severe osteoporosis |
- Sites measured: lumbar spine (L1-L4) and hip (femoral neck)
- Z-score used in premenopausal women and men <50 (compares to age-matched peers)
2. FRAX Score
- WHO fracture risk assessment tool
- Calculates 10-year probability of major osteoporotic fracture (spine, hip, wrist, humerus) and hip fracture
- Incorporates BMD + clinical risk factors
- Treatment thresholds: FRAX hip fracture risk ≥3% OR major fracture risk ≥20% (US guidelines)
- Per 2025 guidelines: primary osteoanabolic therapy recommended if 3-year fracture risk ≥10%; antiresorptive if risk >3%
3. Investigations to exclude secondary causes
| Test | Reason |
|---|---|
| Serum calcium, phosphate, ALP | Exclude osteomalacia, hyperparathyroidism |
| PTH | Hyperparathyroidism |
| Vitamin D (25-OH) | Deficiency |
| TFTs | Thyrotoxicosis |
| Testosterone (men) | Hypogonadism |
| CBC, ESR, CRP | Myeloma, inflammatory disease |
| Serum/urine protein electrophoresis | Myeloma |
| Celiac antibodies | Malabsorption |
| LFTs, renal function | Liver/kidney disease |
| 24-hr urinary calcium | Hypercalciuria |
| Bone turnover markers (CTX, P1NP) | Monitor treatment response |
Management
A. Non-pharmacological
| Intervention | Benefit |
|---|---|
| Calcium 1000-1200 mg/day (dietary preferred) | Substrate for bone formation |
| Vitamin D 800-1000 IU/day | Calcium absorption, muscle function |
| Weight-bearing exercise | Increases bone mass 2-4%; reduces falls by ~25% |
| Balance/functional training | Reduces falls and fracture risk |
| Smoking cessation | Reduces ongoing bone loss |
| Alcohol reduction | <2 units/day |
| Falls prevention | Home assessment, vision correction, medication review, hip protectors |
B. Pharmacological
Antiresorptive Agents
| Drug | Class | Dose | Notes |
|---|---|---|---|
| Alendronate | Bisphosphonate | 70 mg weekly oral | First-line; reduces vertebral fractures ~50%, hip ~40% |
| Risedronate | Bisphosphonate | 35 mg weekly oral | Similar efficacy to alendronate |
| Zoledronic acid | Bisphosphonate | 5 mg IV annually | Preferred in GI intolerance; also used post-hip fracture |
| Denosumab | RANKL inhibitor | 60 mg SC every 6 months | Alternative first-line; avoid stopping without transition |
| Raloxifene | SERM | 60 mg daily oral | Postmenopausal women; reduces vertebral fracture; increases VTE risk |
| HRT | Estrogen ± progestogen | Various | Reduces fracture risk; limited by breast cancer/VTE risks |
Anabolic Agents (bone-building)
| Drug | Class | BMD gain | Notes |
|---|---|---|---|
| Teriparatide | PTH analogue | +8-10% | For high/very high fracture risk; max 2 years |
| Abaloparatide | PTHrP analogue | +9-10% | Similar to teriparatide |
| Romosozumab | Sclerostin inhibitor | +15% | Greatest BMD gain; 12 months; caution in CV disease |
Anabolic agents must always be followed by antiresorptive therapy to consolidate gains.
C. Treatment Sequencing (2025 Guideline Update)
- Very high fracture risk (multiple vertebral fractures, T-score ≤ -3.0, recent fracture): start with anabolic agent first, then transition to antiresorptive
- High risk: antiresorptive (bisphosphonate or denosumab) as first-line
- After stopping denosumab: always bridge with bisphosphonate to prevent rebound
Monitoring
- DEXA repeat every 1-2 years while on treatment
- Bone turnover markers (CTX for resorption, P1NP for formation): rapid response seen within 3 months
- Review for compliance, side effects, and fracture liaison services
- Drug holidays: bisphosphonates can be paused after 3-5 years in lower-risk patients (benefit retained in bone matrix); not applicable to denosumab