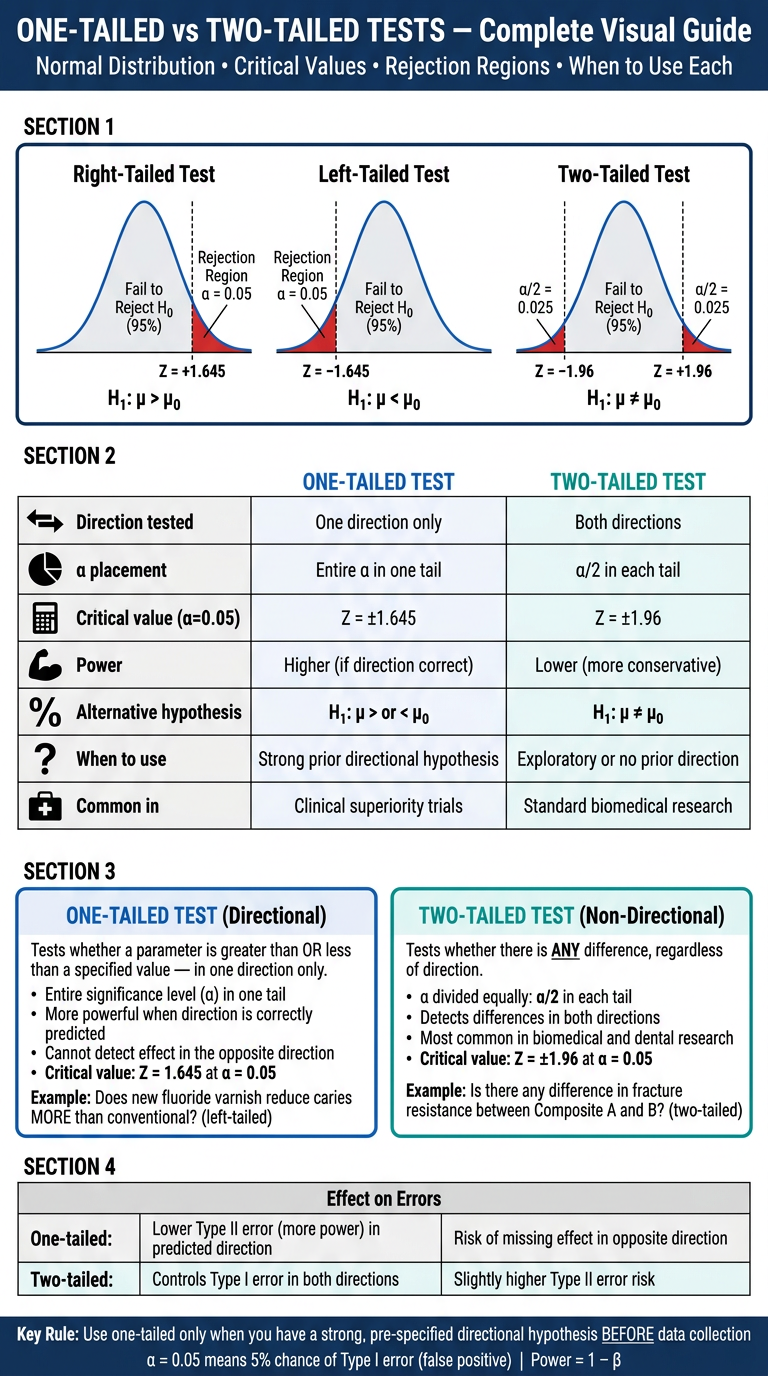
One-Tailed Test (Directional Test) Definition A one-tailed test evaluates whether a parameter is either greater than or less than a specified value. It tests for an effect in one direction only.Characteristics Tests only one direction (greater than or less than). Entire significance level (α) is placed in one tail of the distribution. More powerful than a two-tailed test when the direction is correctly predicted. Cannot detect a significant effect in the opposite direction. Critical Value (α = 0.05) Z = +1.645 (right-tailed) Z = −1.645 (left-tailed) Dental Example A researcher wants to determine whether a new fluoride varnish reduces dental caries more effectively than the conventional varnish. H₀: New varnish is not better than conventional varnish. H₁: New varnish reduces dental caries more effectively. Since only improvement is of interest, a one-tailed test is appropriate.Two-Tailed Test (Non-Directional Test) Definition A two-tailed test evaluates whether there is any difference, regardless of direction. Null and Alternative Hypotheses H₀: μ₁ = μ₂ H₁: μ₁ ≠ μ₂ Characteristics Detects differences in both directions. Significance level (α) is divided equally between the two tails. Most commonly used in biomedical and dental research. Critical Value (α = 0.05) Z = ±1.96 t = ± critical value (depends on degrees of freedom) Dental Example A researcher compares the fracture resistance of Composite A and Composite B without expecting which material is stronger. H₀: No difference in fracture resistance. H₁: There is a difference in fracture resistance. Since either material could perform better, a two-tailed test is appropriate.all matter intio images presentation
mkdir -p /tmp/workspace/hypothesis-testing-pptx && ls /tmp/workspace/hypothesis-testing-pptx/
~/hypothesis-testing-pptx/create_pptx.py
from pptx import Presentation
from pptx.util import Inches, Pt, Emu
from pptx.dml.color import RGBColor
from pptx.enum.text import PP_ALIGN, MSO_ANCHOR
from pptx.util import Inches, Pt
import io

# ── Colour palette ──────────────────────────────────────────────
NAVY       = RGBColor(0x0D, 0x2B, 0x55)   # dark blue – header BG
SKY        = RGBColor(0x1A, 0x73, 0xBC)   # medium blue – accents
TEAL       = RGBColor(0x00, 0x99, 0x99)   # teal – two-tailed accent
WHITE      = RGBColor(0xFF, 0xFF, 0xFF)
LIGHT_BLUE = RGBColor(0xD6, 0xEA, 0xF8)   # card background
LIGHT_TEAL = RGBColor(0xD0, 0xF0, 0xF0)   # card background two-tailed
LIGHT_GREY = RGBColor(0xF2, 0xF4, 0xF7)   # slide background
DARK_TEXT  = RGBColor(0x1C, 0x1C, 0x3C)
GREEN      = RGBColor(0x1E, 0x8B, 0x4C)
ORANGE     = RGBColor(0xE6, 0x7E, 0x22)
RED        = RGBColor(0xC0, 0x39, 0x2B)

prs = Presentation()
prs.slide_width  = Inches(13.333)
prs.slide_height = Inches(7.5)
blank = prs.slide_layouts[6]

# ────────────────────────────────────────────────────────────────
# HELPERS
# ────────────────────────────────────────────────────────────────

def bg(slide, color):
    """Fill slide background with a solid colour."""
    from pptx.oxml.ns import qn
    from lxml import etree
    fill = slide.background.fill
    fill.solid()
    fill.fore_color.rgb = color

def rect(slide, l, t, w, h, fill_color, line_color=None, line_width=Pt(0)):
    shape = slide.shapes.add_shape(
        1,  # MSO_SHAPE_TYPE.RECTANGLE
        Inches(l), Inches(t), Inches(w), Inches(h)
    )
    shape.fill.solid()
    shape.fill.fore_color.rgb = fill_color
    if line_color:
        shape.line.color.rgb = line_color
        shape.line.width = line_width
    else:
        shape.line.fill.background()
    return shape

def rounded_rect(slide, l, t, w, h, fill_color, radius=0.05, line_color=None, line_width=Pt(1)):
    from pptx.oxml.ns import qn
    from lxml import etree
    shape = slide.shapes.add_shape(
        5,  # rounded rectangle
        Inches(l), Inches(t), Inches(w), Inches(h)
    )
    shape.fill.solid()
    shape.fill.fore_color.rgb = fill_color
    if line_color:
        shape.line.color.rgb = line_color
        shape.line.width = line_width
    else:
        shape.line.fill.background()
    # adjust corner radius
    adj = shape.adjustments
    if adj:
        adj[0] = radius
    return shape

def tb(slide, text, l, t, w, h,
       font_size=16, bold=False, color=DARK_TEXT,
       align=PP_ALIGN.LEFT, wrap=True, italic=False):
    txb = slide.shapes.add_textbox(Inches(l), Inches(t), Inches(w), Inches(h))
    tf  = txb.text_frame
    tf.word_wrap = wrap
    tf.margin_left   = Pt(4)
    tf.margin_right  = Pt(4)
    tf.margin_top    = Pt(2)
    tf.margin_bottom = Pt(2)
    p   = tf.paragraphs[0]
    p.alignment = align
    run = p.add_run()
    run.text = text
    run.font.size   = Pt(font_size)
    run.font.bold   = bold
    run.font.italic = italic
    run.font.color.rgb = color
    run.font.name = "Calibri"
    return txb

def tb_multi(slide, lines, l, t, w, h,
             default_size=15, default_color=DARK_TEXT,
             default_align=PP_ALIGN.LEFT, wrap=True):
    """
    lines = list of dicts:
      { text, size, bold, italic, color, align, space_before }
    """
    txb = slide.shapes.add_textbox(Inches(l), Inches(t), Inches(w), Inches(h))
    tf  = txb.text_frame
    tf.word_wrap = wrap
    tf.margin_left   = Pt(4)
    tf.margin_right  = Pt(4)
    tf.margin_top    = Pt(2)
    tf.margin_bottom = Pt(2)
    first = True
    for line in lines:
        if first:
            p = tf.paragraphs[0]
            first = False
        else:
            p = tf.add_paragraph()
        p.alignment = line.get("align", default_align)
        if "space_before" in line:
            p.space_before = Pt(line["space_before"])
        run = p.add_run()
        run.text = line.get("text", "")
        run.font.size   = Pt(line.get("size", default_size))
        run.font.bold   = line.get("bold", False)
        run.font.italic = line.get("italic", False)
        run.font.color.rgb = line.get("color", default_color)
        run.font.name = "Calibri"
    return txb

def bullet_box(slide, items, l, t, w, h, size=15, color=DARK_TEXT, bullet="•"):
    txb = slide.shapes.add_textbox(Inches(l), Inches(t), Inches(w), Inches(h))
    tf  = txb.text_frame
    tf.word_wrap = True
    tf.margin_left   = Pt(4)
    tf.margin_right  = Pt(4)
    tf.margin_top    = Pt(2)
    tf.margin_bottom = Pt(2)
    first = True
    for item in items:
        if first:
            p = tf.paragraphs[0]
            first = False
        else:
            p = tf.add_paragraph()
        p.space_before = Pt(3)
        run = p.add_run()
        run.text = f"{bullet}  {item}"
        run.font.size  = Pt(size)
        run.font.color.rgb = color
        run.font.name = "Calibri"
    return txb

def divider_line(slide, l, t, w, color, thickness=Pt(2)):
    from pptx.util import Inches
    line = slide.shapes.add_connector(1, Inches(l), Inches(t), Inches(l+w), Inches(t))
    line.line.color.rgb = color
    line.line.width = thickness
    return line

# ════════════════════════════════════════════════════════════════
# SLIDE 1 – TITLE SLIDE
# ════════════════════════════════════════════════════════════════
slide = prs.slides.add_slide(blank)
bg(slide, NAVY)

# decorative accent strip top
rect(slide, 0, 0, 13.333, 0.12, SKY)

# large white card
rounded_rect(slide, 1.2, 1.0, 10.9, 5.5, WHITE, radius=0.03)

# top colour bar inside card
rect(slide, 1.2, 1.0, 10.9, 0.8, SKY)

tb(slide, "HYPOTHESIS TESTING", 1.4, 1.05, 10.5, 0.75,
   font_size=30, bold=True, color=WHITE, align=PP_ALIGN.CENTER)

tb(slide, "One-Tailed vs Two-Tailed Tests",
   1.4, 1.85, 10.5, 0.7,
   font_size=22, bold=True, color=NAVY, align=PP_ALIGN.CENTER)

divider_line(slide, 3.5, 2.7, 6.3, SKY, Pt(2))

tb(slide, "Understanding directional and non-directional statistical tests\nin biomedical and dental research",
   1.4, 2.85, 10.5, 1.0,
   font_size=16, color=DARK_TEXT, align=PP_ALIGN.CENTER, italic=True)

# bottom tag
rect(slide, 1.2, 5.6, 10.9, 0.9, LIGHT_BLUE)
tb(slide, "Significance Level  •  Critical Values  •  Dental Research Applications",
   1.4, 5.65, 10.5, 0.7,
   font_size=13, color=SKY, align=PP_ALIGN.CENTER, bold=True)

# bottom accent
rect(slide, 0, 7.38, 13.333, 0.12, SKY)

# ════════════════════════════════════════════════════════════════
# SLIDE 2 – OVERVIEW / AGENDA
# ════════════════════════════════════════════════════════════════
slide = prs.slides.add_slide(blank)
bg(slide, LIGHT_GREY)
rect(slide, 0, 0, 13.333, 0.12, NAVY)
rect(slide, 0, 0.12, 13.333, 1.0, NAVY)
tb(slide, "Overview", 0.4, 0.18, 12.5, 0.85,
   font_size=28, bold=True, color=WHITE, align=PP_ALIGN.LEFT)
rect(slide, 0, 1.12, 13.333, 0.06, SKY)

# two columns
# left card - one-tailed
rounded_rect(slide, 0.4, 1.5, 5.9, 5.6, WHITE, line_color=SKY, line_width=Pt(1.5))
rect(slide, 0.4, 1.5, 5.9, 0.65, SKY)
tb(slide, "ONE-TAILED TEST", 0.5, 1.52, 5.7, 0.6,
   font_size=17, bold=True, color=WHITE, align=PP_ALIGN.CENTER)

items_left = [
    "Definition & concept",
    "Key characteristics",
    "Critical values (α = 0.05)",
    "Right-tailed & left-tailed",
    "Dental example: Fluoride varnish",
]
bullet_box(slide, items_left, 0.55, 2.25, 5.6, 4.5, size=15, color=DARK_TEXT)

# right card - two-tailed
rounded_rect(slide, 7.0, 1.5, 5.9, 5.6, WHITE, line_color=TEAL, line_width=Pt(1.5))
rect(slide, 7.0, 1.5, 5.9, 0.65, TEAL)
tb(slide, "TWO-TAILED TEST", 7.1, 1.52, 5.7, 0.6,
   font_size=17, bold=True, color=WHITE, align=PP_ALIGN.CENTER)

items_right = [
    "Definition & concept",
    "Null & alternative hypotheses",
    "Key characteristics",
    "Critical values (α = 0.05)",
    "Dental example: Composite fracture",
]
bullet_box(slide, items_right, 7.1, 2.25, 5.6, 4.5, size=15, color=DARK_TEXT)

rect(slide, 0, 7.38, 13.333, 0.12, NAVY)

# ════════════════════════════════════════════════════════════════
# SLIDE 3 – ONE-TAILED TEST: DEFINITION & CHARACTERISTICS
# ════════════════════════════════════════════════════════════════
slide = prs.slides.add_slide(blank)
bg(slide, LIGHT_GREY)
rect(slide, 0, 0, 13.333, 0.12, NAVY)
rect(slide, 0, 0.12, 13.333, 1.0, SKY)
tb(slide, "One-Tailed Test  (Directional Test)", 0.4, 0.18, 12.5, 0.85,
   font_size=26, bold=True, color=WHITE)
rect(slide, 0, 1.12, 13.333, 0.06, NAVY)

# Definition card
rounded_rect(slide, 0.4, 1.3, 12.5, 1.2, LIGHT_BLUE, line_color=SKY, line_width=Pt(1))
tb(slide, "DEFINITION", 0.6, 1.32, 3.0, 0.4, font_size=12, bold=True, color=SKY)
tb(slide, "A one-tailed test evaluates whether a parameter is either greater than or less than\na specified value. It tests for an effect in ONE direction only.",
   0.6, 1.68, 12.1, 0.75, font_size=15, color=DARK_TEXT)

# Characteristics
tb(slide, "CHARACTERISTICS", 0.4, 2.65, 5.0, 0.4, font_size=13, bold=True, color=SKY)
divider_line(slide, 0.4, 3.05, 6.0, SKY, Pt(1.5))

chars = [
    "Tests only ONE direction (greater than or less than)",
    "Entire significance level (α) is placed in one tail of the distribution",
    "More powerful than a two-tailed test when direction is correctly predicted",
    "Cannot detect a significant effect in the opposite direction",
]
bullet_box(slide, chars, 0.4, 3.1, 6.1, 3.8, size=14, color=DARK_TEXT)

# Critical values card
rounded_rect(slide, 6.9, 2.65, 6.0, 4.35, WHITE, line_color=SKY, line_width=Pt(1.5))
rect(slide, 6.9, 2.65, 6.0, 0.6, SKY)
tb(slide, "CRITICAL VALUE  (α = 0.05)", 7.0, 2.68, 5.8, 0.55,
   font_size=15, bold=True, color=WHITE, align=PP_ALIGN.CENTER)

rounded_rect(slide, 7.1, 3.4, 5.6, 0.9, LIGHT_BLUE, line_color=SKY, line_width=Pt(0.5))
tb(slide, "Right-Tailed", 7.2, 3.42, 2.5, 0.45, font_size=13, bold=True, color=SKY)
tb(slide, "Z = +1.645", 9.8, 3.42, 2.8, 0.45, font_size=20, bold=True, color=NAVY, align=PP_ALIGN.RIGHT)
tb(slide, "Reject H₀ if Z > +1.645  →  effect is larger than expected",
   7.2, 3.85, 5.4, 0.45, font_size=12, color=DARK_TEXT, italic=True)

rounded_rect(slide, 7.1, 4.5, 5.6, 0.9, LIGHT_BLUE, line_color=SKY, line_width=Pt(0.5))
tb(slide, "Left-Tailed", 7.2, 4.52, 2.5, 0.45, font_size=13, bold=True, color=TEAL)
tb(slide, "Z = −1.645", 9.8, 4.52, 2.8, 0.45, font_size=20, bold=True, color=NAVY, align=PP_ALIGN.RIGHT)
tb(slide, "Reject H₀ if Z < −1.645  →  effect is smaller than expected",
   7.2, 4.95, 5.4, 0.45, font_size=12, color=DARK_TEXT, italic=True)

tb(slide, "α = 0.05 means 5% of area is in ONE tail",
   7.1, 5.6, 5.6, 0.5, font_size=13, italic=True, color=ORANGE, align=PP_ALIGN.CENTER)

rect(slide, 0, 7.38, 13.333, 0.12, NAVY)

# ════════════════════════════════════════════════════════════════
# SLIDE 4 – ONE-TAILED: DENTAL EXAMPLE
# ════════════════════════════════════════════════════════════════
slide = prs.slides.add_slide(blank)
bg(slide, LIGHT_GREY)
rect(slide, 0, 0, 13.333, 0.12, NAVY)
rect(slide, 0, 0.12, 13.333, 1.0, SKY)
tb(slide, "One-Tailed Test  —  Dental Application", 0.4, 0.18, 12.5, 0.85,
   font_size=26, bold=True, color=WHITE)
rect(slide, 0, 1.12, 13.333, 0.06, NAVY)

# scenario box
rounded_rect(slide, 0.4, 1.3, 12.5, 1.3, LIGHT_BLUE, line_color=SKY, line_width=Pt(1.5))
tb(slide, "🦷  RESEARCH SCENARIO", 0.65, 1.32, 5.0, 0.45, font_size=13, bold=True, color=SKY)
tb(slide, "A researcher wants to determine whether a new fluoride varnish reduces dental caries\nMORE EFFECTIVELY than the conventional varnish.",
   0.65, 1.72, 12.1, 0.8, font_size=15, color=DARK_TEXT, bold=False)

# hypothesis cards
rounded_rect(slide, 0.4, 2.85, 5.9, 1.5, WHITE, line_color=RED, line_width=Pt(1.5))
rect(slide, 0.4, 2.85, 5.9, 0.55, RED)
tb(slide, "H₀  —  Null Hypothesis", 0.6, 2.87, 5.7, 0.5, font_size=15, bold=True, color=WHITE)
tb(slide, "New varnish is NOT better than conventional varnish.",
   0.6, 3.42, 5.5, 0.85, font_size=15, color=DARK_TEXT)

rounded_rect(slide, 7.0, 2.85, 5.9, 1.5, WHITE, line_color=GREEN, line_width=Pt(1.5))
rect(slide, 7.0, 2.85, 5.9, 0.55, GREEN)
tb(slide, "H₁  —  Alternative Hypothesis", 7.2, 2.87, 5.7, 0.5, font_size=15, bold=True, color=WHITE)
tb(slide, "New varnish reduces dental caries MORE effectively.",
   7.2, 3.42, 5.5, 0.85, font_size=15, color=DARK_TEXT)

# why one-tailed
rounded_rect(slide, 0.4, 4.6, 12.5, 1.5, WHITE, line_color=SKY, line_width=Pt(1))
tb(slide, "WHY ONE-TAILED?", 0.6, 4.62, 5.0, 0.45, font_size=13, bold=True, color=SKY)
tb_multi(slide, [
    {"text": "Since the researcher is ONLY interested in improvement (reduction of caries),", "size": 15, "bold": False},
    {"text": "the hypothesis is directional — the test is one-tailed (left-tailed, testing for reduction).", "size": 15, "bold": True, "color": SKY},
    {"text": "Any effect in the opposite direction is not of interest and would not change the clinical decision.", "size": 14, "italic": True, "color": DARK_TEXT, "space_before": 3},
], 0.6, 5.05, 12.1, 1.0)

rect(slide, 0, 7.38, 13.333, 0.12, NAVY)

# ════════════════════════════════════════════════════════════════
# SLIDE 5 – TWO-TAILED TEST: DEFINITION & CHARACTERISTICS
# ════════════════════════════════════════════════════════════════
slide = prs.slides.add_slide(blank)
bg(slide, LIGHT_GREY)
rect(slide, 0, 0, 13.333, 0.12, NAVY)
rect(slide, 0, 0.12, 13.333, 1.0, TEAL)
tb(slide, "Two-Tailed Test  (Non-Directional Test)", 0.4, 0.18, 12.5, 0.85,
   font_size=26, bold=True, color=WHITE)
rect(slide, 0, 1.12, 13.333, 0.06, NAVY)

# definition card
rounded_rect(slide, 0.4, 1.3, 12.5, 1.2, LIGHT_TEAL, line_color=TEAL, line_width=Pt(1))
tb(slide, "DEFINITION", 0.6, 1.32, 3.0, 0.4, font_size=12, bold=True, color=TEAL)
tb(slide, "A two-tailed test evaluates whether there is ANY DIFFERENCE, regardless of direction.\nIt detects effects in both directions simultaneously.",
   0.6, 1.68, 12.1, 0.75, font_size=15, color=DARK_TEXT)

# hypotheses
rounded_rect(slide, 0.4, 2.65, 5.9, 1.5, WHITE, line_color=TEAL, line_width=Pt(1))
rect(slide, 0.4, 2.65, 5.9, 0.5, TEAL)
tb(slide, "H₀  —  Null Hypothesis", 0.6, 2.67, 5.7, 0.45, font_size=14, bold=True, color=WHITE)
tb(slide, "H₀: μ₁ = μ₂\nNo difference between the two groups.", 0.6, 3.2, 5.5, 0.9, font_size=15, color=DARK_TEXT)

rounded_rect(slide, 7.0, 2.65, 5.9, 1.5, WHITE, line_color=NAVY, line_width=Pt(1))
rect(slide, 7.0, 2.65, 5.9, 0.5, NAVY)
tb(slide, "H₁  —  Alternative Hypothesis", 7.2, 2.67, 5.7, 0.45, font_size=14, bold=True, color=WHITE)
tb(slide, "H₁: μ₁ ≠ μ₂\nThe two groups ARE different (either direction).", 7.2, 3.2, 5.5, 0.9, font_size=15, color=DARK_TEXT)

# characteristics
tb(slide, "CHARACTERISTICS", 0.4, 4.35, 5.0, 0.4, font_size=13, bold=True, color=TEAL)
divider_line(slide, 0.4, 4.75, 12.5, TEAL, Pt(1.5))

chars2 = [
    "Detects differences in BOTH directions (greater than AND less than)",
    "Significance level (α) is divided equally between the two tails  (α/2 per tail)",
    "Most commonly used in biomedical and dental research",
    "More conservative; requires a larger effect to reach significance than a one-tailed test",
]
bullet_box(slide, chars2, 0.4, 4.8, 8.5, 2.5, size=14, color=DARK_TEXT)

# critical value badge
rounded_rect(slide, 9.2, 4.3, 3.8, 2.8, WHITE, line_color=TEAL, line_width=Pt(1.5))
rect(slide, 9.2, 4.3, 3.8, 0.55, TEAL)
tb(slide, "CRITICAL VALUE\n(α = 0.05)", 9.3, 4.3, 3.6, 0.55, font_size=13, bold=True, color=WHITE, align=PP_ALIGN.CENTER)
tb(slide, "Z = ±1.96", 9.3, 4.95, 3.6, 0.7, font_size=28, bold=True, color=NAVY, align=PP_ALIGN.CENTER)
tb(slide, "t = ± critical value\n(depends on degrees of freedom)",
   9.3, 5.65, 3.6, 0.8, font_size=13, color=DARK_TEXT, align=PP_ALIGN.CENTER, italic=True)
tb(slide, "α/2 = 0.025 in each tail", 9.3, 6.45, 3.6, 0.45, font_size=12, color=ORANGE, align=PP_ALIGN.CENTER, italic=True)

rect(slide, 0, 7.38, 13.333, 0.12, NAVY)

# ════════════════════════════════════════════════════════════════
# SLIDE 6 – TWO-TAILED: DENTAL EXAMPLE
# ════════════════════════════════════════════════════════════════
slide = prs.slides.add_slide(blank)
bg(slide, LIGHT_GREY)
rect(slide, 0, 0, 13.333, 0.12, NAVY)
rect(slide, 0, 0.12, 13.333, 1.0, TEAL)
tb(slide, "Two-Tailed Test  —  Dental Application", 0.4, 0.18, 12.5, 0.85,
   font_size=26, bold=True, color=WHITE)
rect(slide, 0, 1.12, 13.333, 0.06, NAVY)

# scenario
rounded_rect(slide, 0.4, 1.3, 12.5, 1.3, LIGHT_TEAL, line_color=TEAL, line_width=Pt(1.5))
tb(slide, "🦷  RESEARCH SCENARIO", 0.65, 1.32, 5.0, 0.45, font_size=13, bold=True, color=TEAL)
tb(slide, "A researcher compares the fracture resistance of Composite A and Composite B\nwithout expecting WHICH material is stronger.",
   0.65, 1.72, 12.1, 0.8, font_size=15, color=DARK_TEXT)

# hypotheses
rounded_rect(slide, 0.4, 2.85, 5.9, 1.5, WHITE, line_color=RED, line_width=Pt(1.5))
rect(slide, 0.4, 2.85, 5.9, 0.55, RED)
tb(slide, "H₀  —  Null Hypothesis", 0.6, 2.87, 5.7, 0.5, font_size=15, bold=True, color=WHITE)
tb(slide, "No difference in fracture resistance\nbetween Composite A and Composite B.",
   0.6, 3.42, 5.5, 0.85, font_size=15, color=DARK_TEXT)

rounded_rect(slide, 7.0, 2.85, 5.9, 1.5, WHITE, line_color=GREEN, line_width=Pt(1.5))
rect(slide, 7.0, 2.85, 5.9, 0.55, GREEN)
tb(slide, "H₁  —  Alternative Hypothesis", 7.2, 2.87, 5.7, 0.5, font_size=15, bold=True, color=WHITE)
tb(slide, "There IS a difference in fracture resistance\nbetween Composite A and Composite B.",
   7.2, 3.42, 5.5, 0.85, font_size=15, color=DARK_TEXT)

# why two-tailed
rounded_rect(slide, 0.4, 4.6, 12.5, 1.55, WHITE, line_color=TEAL, line_width=Pt(1))
tb(slide, "WHY TWO-TAILED?", 0.6, 4.62, 5.0, 0.45, font_size=13, bold=True, color=TEAL)
tb_multi(slide, [
    {"text": "Since the researcher has NO prior expectation about which composite performs better,", "size": 15},
    {"text": "the test must detect differences in EITHER direction — Composite A > B or Composite A < B.", "size": 15, "bold": True, "color": TEAL},
    {"text": "A two-tailed test is the standard choice when direction cannot be predicted in advance.", "size": 14, "italic": True, "color": DARK_TEXT, "space_before": 3},
], 0.6, 5.05, 12.1, 1.1)

rect(slide, 0, 7.38, 13.333, 0.12, NAVY)

# ════════════════════════════════════════════════════════════════
# SLIDE 7 – COMPARISON TABLE
# ════════════════════════════════════════════════════════════════
slide = prs.slides.add_slide(blank)
bg(slide, LIGHT_GREY)
rect(slide, 0, 0, 13.333, 0.12, NAVY)
rect(slide, 0, 0.12, 13.333, 1.0, NAVY)
tb(slide, "One-Tailed vs Two-Tailed  —  Comparison", 0.4, 0.18, 12.5, 0.85,
   font_size=26, bold=True, color=WHITE)
rect(slide, 0, 1.12, 13.333, 0.06, SKY)

# Table header
rect(slide, 0.3, 1.35, 3.6, 0.6, NAVY)
rect(slide, 3.9, 1.35, 4.2, 0.6, SKY)
rect(slide, 8.1, 1.35, 4.9, 0.6, TEAL)
tb(slide, "FEATURE", 0.4, 1.38, 3.4, 0.52, font_size=14, bold=True, color=WHITE, align=PP_ALIGN.CENTER)
tb(slide, "ONE-TAILED", 4.0, 1.38, 4.0, 0.52, font_size=14, bold=True, color=WHITE, align=PP_ALIGN.CENTER)
tb(slide, "TWO-TAILED", 8.2, 1.38, 4.7, 0.52, font_size=14, bold=True, color=WHITE, align=PP_ALIGN.CENTER)

rows = [
    ("Direction", "One direction only", "Both directions"),
    ("α placement", "Entire α in one tail", "α/2 in each tail"),
    ("Critical value\n(α = 0.05)", "Z = ±1.645", "Z = ±1.96"),
    ("Statistical power", "Higher (when correct)", "Lower (more conservative)"),
    ("Hypothesis", "H₁: μ₁ > μ₂ or μ₁ < μ₂", "H₁: μ₁ ≠ μ₂"),
    ("Common use", "Specific directional\nhypothesis", "Exploratory / standard\nbiomedical research"),
]

row_bg_even = RGBColor(0xF0, 0xF7, 0xFF)
row_bg_odd  = WHITE

for i, (feat, one, two) in enumerate(rows):
    y = 2.05 + i * 0.78
    bg_color = row_bg_even if i % 2 == 0 else row_bg_odd
    rect(slide, 0.3, y, 3.6, 0.75, bg_color, line_color=RGBColor(0xCC, 0xCC, 0xCC), line_width=Pt(0.5))
    rect(slide, 3.9, y, 4.2, 0.75, bg_color, line_color=RGBColor(0xCC, 0xCC, 0xCC), line_width=Pt(0.5))
    rect(slide, 8.1, y, 4.9, 0.75, bg_color, line_color=RGBColor(0xCC, 0xCC, 0xCC), line_width=Pt(0.5))
    tb(slide, feat, 0.4, y+0.05, 3.4, 0.65, font_size=13, bold=True, color=NAVY, align=PP_ALIGN.CENTER)
    tb(slide, one,  4.0, y+0.05, 4.0, 0.65, font_size=13, color=SKY,  align=PP_ALIGN.CENTER)
    tb(slide, two,  8.2, y+0.05, 4.7, 0.65, font_size=13, color=TEAL, align=PP_ALIGN.CENTER)

rect(slide, 0, 7.38, 13.333, 0.12, NAVY)

# ════════════════════════════════════════════════════════════════
# SLIDE 8 – KEY TAKEAWAYS
# ════════════════════════════════════════════════════════════════
slide = prs.slides.add_slide(blank)
bg(slide, NAVY)
rect(slide, 0, 0, 13.333, 0.12, SKY)

tb(slide, "Key Takeaways", 0.4, 0.25, 12.5, 0.85, font_size=28, bold=True, color=WHITE)
divider_line(slide, 0.4, 1.15, 12.5, SKY, Pt(2))

takeaways = [
    ("Use a ONE-TAILED test when…", "You have a strong directional hypothesis BEFORE collecting data\n(e.g., testing if a new drug is better, not just different).", SKY),
    ("Use a TWO-TAILED test when…", "You are testing for any difference, or you are unsure of direction.\nThis is the DEFAULT choice for most biomedical research.", TEAL),
    ("Critical value rule…", "One-tailed: Z = ±1.645  |  Two-tailed: Z = ±1.96\nTwo-tailed requires a LARGER test statistic to reject H₀.", ORANGE),
    ("Power vs safety…", "One-tailed has MORE POWER but risks missing effects in the other direction.\nTwo-tailed is more CONSERVATIVE and less prone to Type I errors.", GREEN),
]

for i, (title, body, col) in enumerate(takeaways):
    y = 1.3 + i * 1.45
    rounded_rect(slide, 0.4, y, 12.5, 1.3, RGBColor(0x16, 0x3A, 0x6B), line_color=col, line_width=Pt(2))
    rect(slide, 0.4, y, 0.25, 1.3, col)
    tb(slide, title, 0.8, y+0.05, 5.5, 0.45, font_size=14, bold=True, color=col)
    tb(slide, body, 0.8, y+0.5, 11.8, 0.75, font_size=13, color=WHITE)

rect(slide, 0, 7.38, 13.333, 0.12, SKY)

# ════════════════════════════════════════════════════════════════
# SAVE
# ════════════════════════════════════════════════════════════════
out = "/tmp/workspace/hypothesis-testing-pptx/Hypothesis_Testing_One_Two_Tailed.pptx"
prs.save(out)
print(f"Saved: {out}")
python /tmp/workspace/hypothesis-testing-pptx/create_pptx.py
python -c " from pptx import Presentation prs = Presentation('/tmp/workspace/hypothesis-testing-pptx/Hypothesis_Testing_One_Two_Tailed.pptx') print(f'Slides: {len(prs.slides)}') for i, slide in enumerate(prs.slides, 1): texts = [s.text_frame.text.strip()[:60] for s in slide.shapes if s.has_text_frame and s.text_frame.text.strip()] print(f' Slide {i}: {texts[0] if texts else \"(no text)\"}') "
Hypothesis Testing One Two Tailed
Presentation · PPTX
| # | Slide |
|---|---|
| 1 | Title slide - Hypothesis Testing: One-Tailed vs Two-Tailed Tests |
| 2 | Overview / Agenda - two-column layout showing both test types |
| 3 | One-Tailed Test - Definition, 4 characteristics, right/left-tailed critical values (Z = ±1.645) |
| 4 | One-Tailed: Dental Example - Fluoride varnish scenario with H₀/H₁ cards and rationale |
| 5 | Two-Tailed Test - Definition, H₀/H₁ formulae, 4 characteristics, Z = ±1.96 badge |
| 6 | Two-Tailed: Dental Example - Composite fracture resistance scenario with H₀/H₁ cards |
| 7 | Comparison Table - Side-by-side: direction, α placement, critical values, power, hypothesis form, common use |
| 8 | Key Takeaways - 4 colour-coded summary points covering when to use each test |
Make a poster comparing Type I vs Type II errors in one/two-tailed tests
A professional academic poster titled "Type I vs Type II Errors in Hypothesis Testing" comparing one-tailed and two-tailed statistical tests. Layout: Portrait orientation, clean white background with navy blue and red/green color accents. TOP SECTION - Header: Large bold title "TYPE I & TYPE II ERRORS" subtitle "In One-Tailed vs Two-Tailed Hypothesis Tests" SECTION 1 - Two side-by-side definition boxes: Left box (red border): "TYPE I ERROR (α) — False Positive" - Rejecting H₀ when it is actually TRUE - Probability = α (significance level) - "Crying wolf" — seeing an effect that doesn't exist - Controlled by setting α = 0.05 Right box (green border): "TYPE II ERROR (β) — False Negative" - Failing to reject H₀ when it is actually FALSE - Probability = β - Missing a real effect - Related to statistical power (Power = 1 − β) SECTION 2 - 2x2 Decision Table with colored cells: Title: "The Decision Matrix" Columns: "H₀ is TRUE" | "H₀ is FALSE" Row 1: "Reject H₀" → RED cell "TYPE I ERROR (α) False Positive" | GREEN cell "CORRECT DECISION Power = 1−β" Row 2: "Fail to Reject H₀" → GREEN cell "CORRECT DECISION Confidence = 1−α" | ORANGE cell "TYPE II ERROR (β) False Negative" SECTION 3 - Two columns comparing test types: Left column (blue): "ONE-TAILED TEST" - α entirely in one tail → higher Type I risk in that direction - More power to detect effect in predicted direction - Lower chance of Type II error IF direction is correct - Critical value Z = 1.645 (α = 0.05) - Risk: if true effect is in opposite direction → always Type II error Right column (teal): "TWO-TAILED TEST" - α split equally (α/2 each tail) - More conservative → slightly higher Type II error risk - Protects against Type I error in both directions - Critical value Z = 1.96 (α = 0.05) - Standard choice in biomedical research SECTION 4 - Dental Research Examples: Small boxes: Box 1 (red accent): "Type I Error Example — One-Tailed: Concluding new fluoride varnish reduces caries when it actually does NOT" Box 2 (orange accent): "Type II Error Example — Two-Tailed: Failing to detect a real difference in fracture resistance between Composite A and B" BOTTOM - Key insight banner (navy): "Reducing α decreases Type I errors but increases Type II errors — there is always a trade-off" "Increase sample size to reduce BOTH error types simultaneously" Clean, professional medical/academic poster style with icons, clear typography, well-organized grid layout.
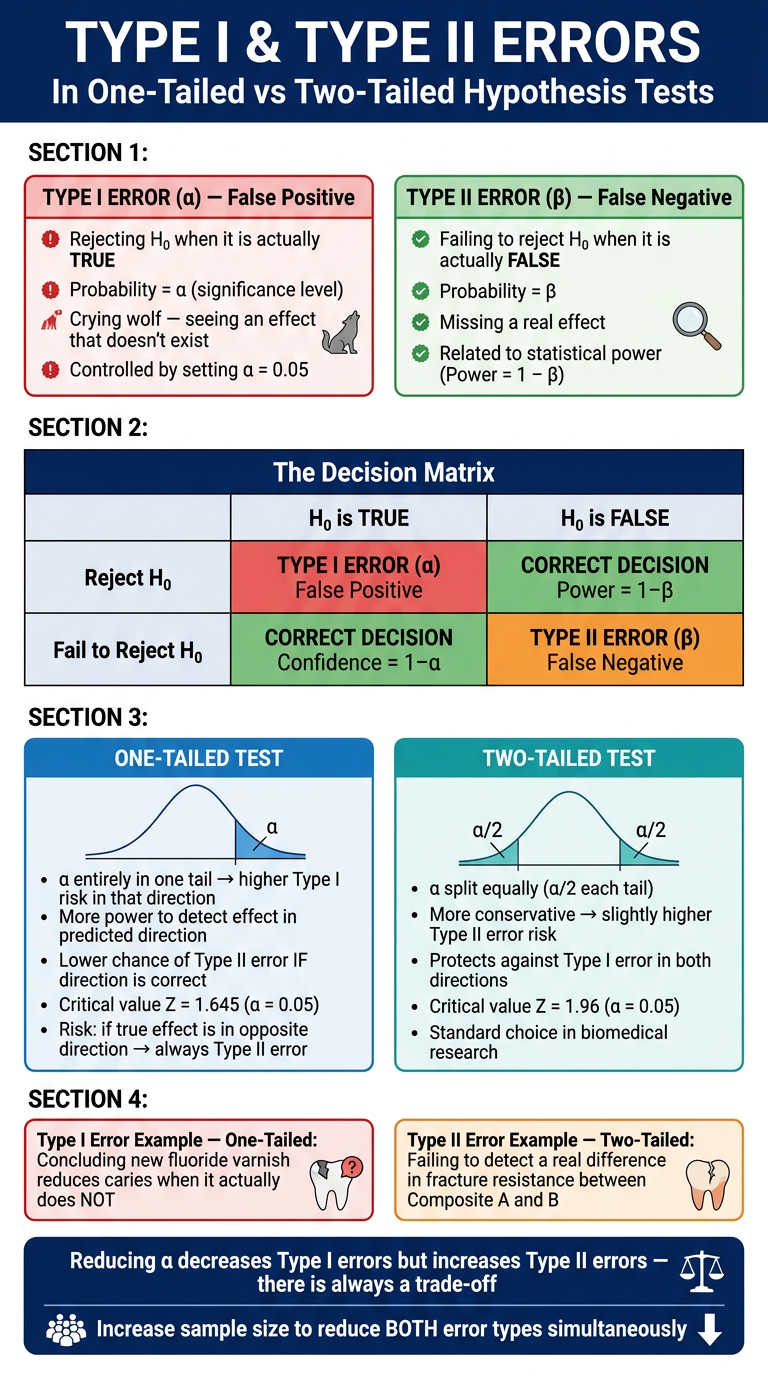
- Definitions - Type I (false positive, α) and Type II (false negative, β) with plain-language descriptions
- 2×2 Decision Matrix - color-coded table showing all four outcomes (correct decisions + both error types)
- One-tailed vs Two-tailed comparison - how α placement affects each error type differently, with critical values
- Dental research examples - concrete Type I and Type II error scenarios using the fluoride varnish and composite fracture studies
- Bottom takeaway - the α/β trade-off and the role of sample size
- One-tailed: more power (less Type II risk) in the predicted direction, but blind to the opposite direction
- Two-tailed: splits α across both tails (Z = ±1.96), slightly more Type II risk but standard for unbiased research
- Increasing sample size is the only way to reduce both errors simultaneously
one tailed and two tailed test difference image
A clean scientific diagram showing the visual difference between one-tailed and two-tailed statistical tests using normal distribution bell curves. THREE bell curve diagrams stacked vertically on white background: DIAGRAM 1 - TOP: "RIGHT-TAILED TEST (One-Tailed)" - A smooth symmetrical normal distribution bell curve in blue outline - The RIGHT tail area beyond Z = +1.645 is shaded in solid red - Label the shaded area: "Rejection Region α = 0.05" - Arrow pointing to the red zone with label "Z = +1.645" - Label on the left non-shaded area: "Fail to Reject H₀ (95%)" - Title above: "One-Tailed Test — Right Tail" in bold navy DIAGRAM 2 - MIDDLE: "LEFT-TAILED TEST (One-Tailed)" - A smooth symmetrical normal distribution bell curve in blue outline - The LEFT tail area beyond Z = −1.645 is shaded in solid red - Label the shaded area: "Rejection Region α = 0.05" - Arrow pointing to the red zone with label "Z = −1.645" - Label on the right non-shaded area: "Fail to Reject H₀ (95%)" - Title above: "One-Tailed Test — Left Tail" in bold navy DIAGRAM 3 - BOTTOM: "TWO-TAILED TEST (Non-Directional)" - A smooth symmetrical normal distribution bell curve in blue outline - BOTH tails shaded in solid red: left tail beyond Z = −1.96 AND right tail beyond Z = +1.96 - Each shaded tail labeled: "α/2 = 0.025" - Arrows pointing to both red zones labeled "Z = −1.96" and "Z = +1.96" - Center unshaded area labeled: "Fail to Reject H₀ (95%)" - Title above: "Two-Tailed Test — Both Tails" in bold navy LAYOUT: - Clean white background - Each diagram is clearly separated with a thin horizontal divider line - All three curves are the same size for easy comparison - Color scheme: navy blue curve lines, red shaded rejection regions, black text labels - A bold header at top: "ONE-TAILED vs TWO-TAILED TESTS — Visual Comparison" - A footer note: "α = 0.05 in all cases | One-tailed: Z = ±1.645 | Two-tailed: Z = ±1.96" - Professional textbook-quality statistical diagram style
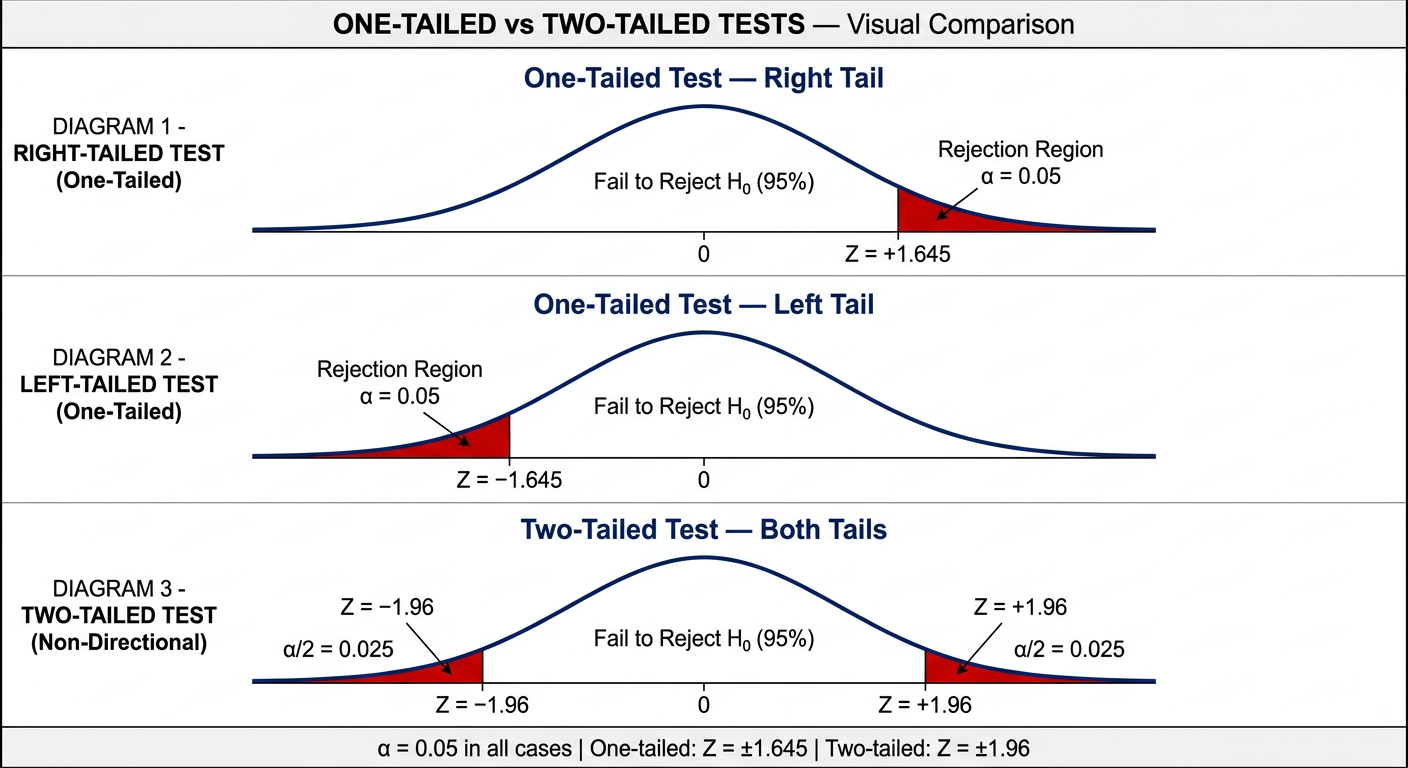
- Right-Tailed (One-Tailed) - red rejection region in the right tail only, beyond Z = +1.645
- Left-Tailed (One-Tailed) - red rejection region in the left tail only, beyond Z = -1.645
- Two-Tailed - red rejection regions in BOTH tails, split equally at Z = ±1.96 (α/2 = 0.025 each side)
add matterr
A detailed scientific educational poster showing the visual and conceptual difference between one-tailed and two-tailed statistical tests. Clean white background, professional academic style. HEADER (navy blue banner): "ONE-TAILED vs TWO-TAILED TESTS — Complete Visual Guide" Subtitle: "Normal Distribution • Critical Values • Rejection Regions • When to Use Each" ═══════════════════════════════════════ SECTION 1: THREE BELL CURVE DIAGRAMS (side by side) LEFT CURVE — "Right-Tailed Test" - Normal bell curve, blue outline - RIGHT tail shaded red beyond Z = +1.645 - Label: "Rejection Region α = 0.05" - Label center: "Fail to Reject H₀ (95%)" - Z = +1.645 marked with vertical dashed line - Below: H₁: μ > μ₀ MIDDLE CURVE — "Left-Tailed Test" - Normal bell curve, blue outline - LEFT tail shaded red beyond Z = −1.645 - Label: "Rejection Region α = 0.05" - Z = −1.645 marked with vertical dashed line - Below: H₁: μ < μ₀ RIGHT CURVE — "Two-Tailed Test" - Normal bell curve, blue outline - BOTH tails shaded red: Z < −1.96 and Z > +1.96 - Each tail labeled: "α/2 = 0.025" - Center: "Fail to Reject H₀ (95%)" - Both Z values marked with dashed lines - Below: H₁: μ ≠ μ₀ ═══════════════════════════════════════ SECTION 2: COMPARISON TABLE (two columns) Column headers: "ONE-TAILED TEST" (blue) | "TWO-TAILED TEST" (teal) Rows with icons: Direction tested | One direction only | Both directions α placement | Entire α in one tail | α/2 in each tail Critical value (α=0.05) | Z = ±1.645 | Z = ±1.96 Power | Higher (if direction correct) | Lower (more conservative) Alternative hypothesis | H₁: μ > or < μ₀ | H₁: μ ≠ μ₀ When to use | Strong prior directional hypothesis | Exploratory or no prior direction Common in | Clinical superiority trials | Standard biomedical research ═══════════════════════════════════════ SECTION 3: DEFINITION BOXES (two side-by-side cards) LEFT CARD (blue border): "ONE-TAILED TEST (Directional)" Definition: Tests whether a parameter is greater than OR less than a specified value — in one direction only. • Entire significance level (α) in one tail • More powerful when direction is correctly predicted • Cannot detect effect in the opposite direction • Critical value: Z = 1.645 at α = 0.05 Example: Does new fluoride varnish reduce caries MORE than conventional? (left-tailed) RIGHT CARD (teal border): "TWO-TAILED TEST (Non-Directional)" Definition: Tests whether there is ANY difference, regardless of direction. • α divided equally: α/2 in each tail • Detects differences in both directions • Most common in biomedical and dental research • Critical value: Z = ±1.96 at α = 0.05 Example: Is there any difference in fracture resistance between Composite A and B? (two-tailed) ═══════════════════════════════════════ SECTION 4: TYPE I AND TYPE II ERROR MINI TABLE "Effect on Errors" One-tailed: Lower Type II error (more power) in predicted direction | Risk of missing effect in opposite direction Two-tailed: Controls Type I error in both directions | Slightly higher Type II error risk ═══════════════════════════════════════ FOOTER (navy): "Key Rule: Use one-tailed only when you have a strong, pre-specified directional hypothesis BEFORE data collection" "α = 0.05 means 5% chance of Type I error (false positive) | Power = 1 − β" Professional, clean, color-coded academic poster with clear typography and well-organized grid sections.