
Grading of mitral stenosis
mitral stenosis grading severity echocardiography MVA
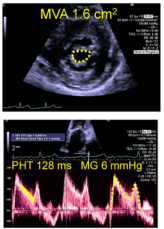
Summary : This figure presents two echocardiographic images assessing mitral valve stenosis, including mitral valve area (MVA), pressure half-time (PHT), and mean gradient (MG). photo: # Top Panel : • Echocardiographic image (likely parasternal short-axis view) of the mitral valve. • The mitral valve orifice is outlined with yellow dots. • On-image text: "MVA 1.6 cm²" indicating mitral valve area measurement. • Additional ultrasound machine interface text and settings visible on the right. # Bottom Panel : • Doppler echocardiography tracing showing transmitral flow velocity over time. • Yellow dots trace the E-wave deceleration slope. • On-image text: "PHT 128 ms" (pressure half-time) and "MG 6 mmHg" (mean gradient). • Additional ultrasound machine interface text and settings visible on the right. # Technical Details : • No scale bar or magnification specified. • Modality: 2D echocardiography (top), pulsed-wave Doppler (bottom). • Colour palette: grayscale for anatomical image, pink/red for Doppler tracing, yellow for annotation. • On-image UI elements: measurement values, machine settings, patient data (partially visible). # Spatial Relationships : • Top panel focuses on the mitral valve orifice in cross-section. • Bottom panel displays time-velocity Doppler tracing, with measurements annotated. # Analysis : • The mitral valve area (MVA) is reduced (1.6 cm²), consistent with mitral stenosis. • Pressure half-time (PHT) is 128 ms and mean gradient (MG) is 6 mmHg, supporting the diagnosis and quantification of mitral stenosis severity. • The figure visually demonstrates both anatomical narrowing and haemodynamic consequences.
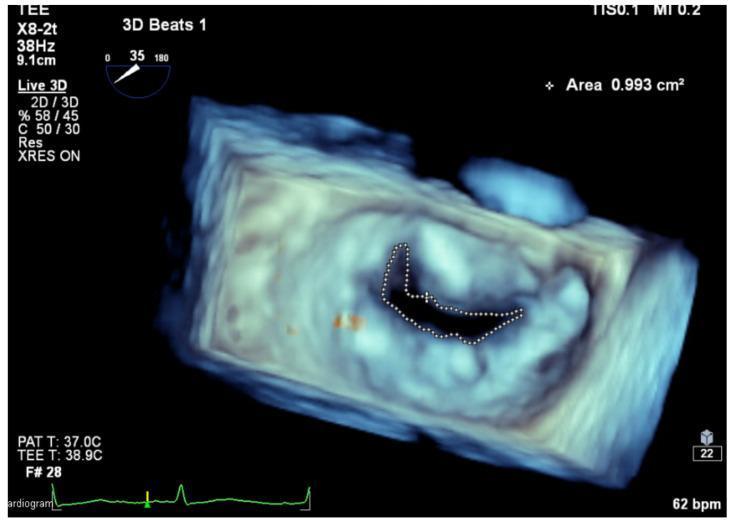
This diagnostic image demonstrates the quantification of the Mitral Valve Area (MVA) using three-dimensional transesophageal echocardiography (3D TEE) planimetry. The central 3D volumetric rendering displays a cropped 'en face' view of the mitral valve apparatus. An irregularly shaped, dark central orifice representing the mitral opening is manually traced with a dotted white line for planimetric measurement. The clinical significance of this procedure is to assess the severity of mitral stenosis, particularly in cases of degenerative calcification where 2D imaging may be less accurate. The top right of the display indicates a calculated MVA of 0.993 cm². Technical parameters on the left show the use of an X8-2t transducer, a frequency of 38Hz, and a depth of 9.1cm in 'Live 3D' mode. An electrocardiogram (ECG) trace at the bottom indicates the measurement timing within the cardiac cycle at a heart rate of 62 bpm. This image is a key educational example of advanced cardiac imaging used for structural heart disease assessment and intervention planning.
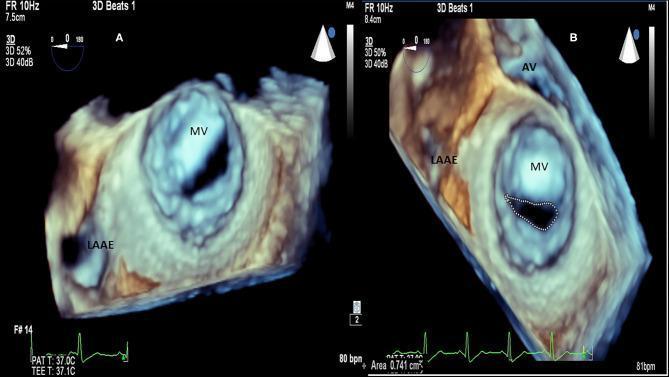
This 3D transesophageal echocardiography (TEE) image provides a surgical or 'en-face' view of the mitral valve (MV) in a patient with Rheumatic Heart Disease (RHD). Panel A demonstrates the classic 'fishmouth' or 'buttonhole' appearance of the mitral valve orifice, a hallmark of severe mitral stenosis. The visual shows significant thickening of the valvular leaflets and commissural fusion, which restricts normal diastolic opening. Adjacent to the mitral valve, the left atrial appendage (LAAE) is clearly visible. Panel B illustrates the clinical application of 3D planimetry to quantify the severity of the stenosis. A dotted line traces the restricted mitral valve area (MVA), with a measured value of 0.741 cm², indicating severe mitral stenosis (typically defined as <1.0 cm²). The aortic valve (AV) is also visualized in Panel B, providing anatomical context for the spatial relationship between the valves. This diagnostic image is used in cardiology to assess valvular morphology and plan interventions such as balloon valvuloplasty or valve replacement.
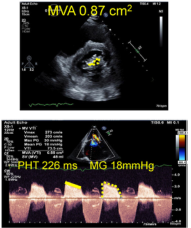
Summary : This figure presents two echocardiographic images assessing mitral valve stenosis, including planimetry and Doppler measurements, with key values for mitral valve area (MVA), pressure half-time (PHT), and mean gradient (MG) annotated. photo: # Top Panel : Mitral Valve Planimetry • Black-and-white echocardiographic image showing a cross-sectional view of the mitral valve. • Yellow annotation: "MVA 0.87 cm²" indicating the mitral valve area measured by planimetry. • The mitral valve orifice is outlined with yellow dashed lines. • Standard ultrasound interface elements (depth scale, probe orientation, grayscale bar) visible. • Green ECG trace at the bottom of the image. # Bottom Panel : Doppler Assessment • Spectral Doppler tracing of mitral inflow velocities. • Yellow annotations: "PHT 226 ms" (pressure half-time) and "MG 18mmHg" (mean gradient). • Doppler envelope outlined with yellow dashed lines and arrows. • Standard ultrasound interface elements (velocity scale, colour bar, measurement table) visible. • Multiple cardiac cycles shown, with velocity peaks and troughs. # Technical Details : • Adult echocardiography modality. • Measurements: MVA (cm²), PHT (ms), MG (mmHg). • Image orientation and probe position indicated by icons. • No scale bar, but standard echocardiographic depth and velocity scales present. # Analysis : • The mitral valve area (0.87 cm²) is below the normal threshold, indicating significant mitral stenosis. • Pressure half-time (226 ms) and mean gradient (18 mmHg) are elevated, supporting the diagnosis of hemodynamically significant mitral stenosis. • Both planimetry and Doppler methods are used to quantify severity, with consistent findings across modalities.
Grading of Mitral Stenosis
Overview
1. Echocardiographic Severity Grading (Traditional: Mild / Moderate / Severe)
| Parameter | Mild | Moderate | Severe |
|---|---|---|---|
| Mean gradient (mmHg) | < 5 | 5-10 | > 10 |
| Pressure half-time (ms) | ≤ 100 | 100-220 | > 220 |
| Mitral valve area (cm²) | > 1.5 | 1.0-1.5 | < 1.0 |
| Pulmonary artery systolic pressure (mmHg) | < 30 | 30-50 | > 50 |
- Barash, Cullen, and Stoelting's Clinical Anesthesia, 9e, Table 27-12
2. ACC/AHA Staging (2020 Guidelines) - A, B, C, D Classification
| Stage | Definition | Valve Anatomy | Valve Haemodynamics | Haemodynamic Consequences | Symptoms |
|---|---|---|---|---|---|
| A | At risk of MS | Mild valve doming during diastole | Normal transmitral flow velocity | None | None |
| B | Progressive MS | Rheumatic changes with commissural fusion; diastolic doming | Increased transmitral velocities; MVA > 1.5 cm² | Mild-moderate LA enlargement; normal pulmonary pressure at rest | None |
| C | Asymptomatic severe MS | Rheumatic changes with commissural fusion; planimetered MVA ≤ 1.5 cm² | MVA ≤ 1.5 cm²; pressure half-time < 150 ms | Severe LA enlargement; elevated PASP > 50 mmHg | None |
| D | Symptomatic severe MS | Rheumatic changes; planimetered MVA ≤ 1.5 cm² | MVA ≤ 1.5 cm²; PHT ≥ 150 ms | Severe LA enlargement; elevated PASP > 50 mmHg | Decreased exercise tolerance; exertional dyspnea |
Note: The mean pressure gradient is not included as a staging criterion because of its variability with heart rate and flow, but severe MS is usually associated with a mean gradient > 5-10 mmHg.
- Textbook of Clinical Echocardiography (Otto et al.), Table 11.6 - citing the 2020 ACC/AHA VHD Guideline
3. Methods of Measuring MVA
a) 2D/3D Planimetry (Gold Standard)
- Direct short-axis imaging of the mitral orifice in diastole
- 3D imaging is preferred to ensure the smallest orifice at the leaflet tips is measured
- Not affected by compliance changes of LA or LV
b) Pressure Half-Time (PHT) Method
- MVA = 220 / PHT
- PHT is the time (ms) for the peak transmitral pressure gradient to fall by half
- PHT > 220 ms → MVA < 1.0 cm² (severe)
- Pitfalls: Unreliable after balloon commissurotomy, significant AR, abnormal LV/LA compliance, tachycardia
c) Continuity Equation
- Less commonly used for MS; useful when other methods are unreliable
d) PISA (Proximal Isovelocity Surface Area)
- Can be used but technically challenging for MS
e) Gorlin Formula (Invasive - Cardiac Catheterization)
- MVA = Cardiac output / (44.3 × HR × Diastolic filling period × √Mean gradient)
- Rarely required today; reserved for cases where echocardiography is inconclusive or if coronary angiography is planned pre-operatively
- Goldman-Cecil Medicine, p. 852
4. Wilkins Echocardiographic Score (for PBMV Suitability)
| Feature | Score 1 | Score 2 | Score 3 | Score 4 |
|---|---|---|---|---|
| Leaflet mobility | Highly mobile, only tip restriction | Reduced in mid/base | Valve moves forward mainly at base | Minimal/no forward movement |
| Leaflet thickening | Near normal (4-5 mm) | Thickened margins (5-8 mm) | Thickening extends to mid-leaflet (5-8 mm) | Marked thickening throughout (>8-10 mm) |
| Calcification | Single area of brightness | Scattered areas of brightness | Brightness extends to mid-leaflet | Extensive throughout leaflets |
| Subvalvular thickening | Minimal thickening below leaflets | Thickening up to 1/3 of chordal length | Thickening to distal 1/3 of chords | Extensive thickening/shortening of all chordae |
- Score ≤ 8: Good candidate for PBMV (expected good result)
- Score 9-11: Intermediate; individualised decision
- Score ≥ 12: High risk; unfavourable morphology for PBMV; surgery preferred
5. Clinical Correlation
6. Indications for Intervention (Simplified)
| Scenario | Indication |
|---|---|
| Symptomatic MS (Stage D) with MVA ≤ 1.5 cm² and favourable valve morphology | PBMV (Class I) |
| Symptomatic MS with MVA ≤ 1.5 cm² and unfavourable morphology (high Wilkins score) | Mitral valve surgery |
| Asymptomatic severe MS (Stage C) with PASP > 50 mmHg | Consider PBMV if anatomy favourable |
| MS with new-onset AF | Anticoagulation; rate control |
- Normal MVA: 4-6 cm²
- Symptoms begin: MVA < 2 cm²
- Severe MS threshold: MVA < 1.5 cm² (ACC/AHA) or < 1.0 cm² (some classifications)
- Critical MS: MVA < 1.0 cm²
- Mean gradient severe: > 10 mmHg
- PHT severe: > 220 ms
- PASP severe: > 50 mmHg