
Ear vestibular apparatus Degeneration wallerian Muscle contraction Neuromuscular junction Action potential Cellular transport
vestibular apparatus semicircular canals utricle saccule anatomy diagram
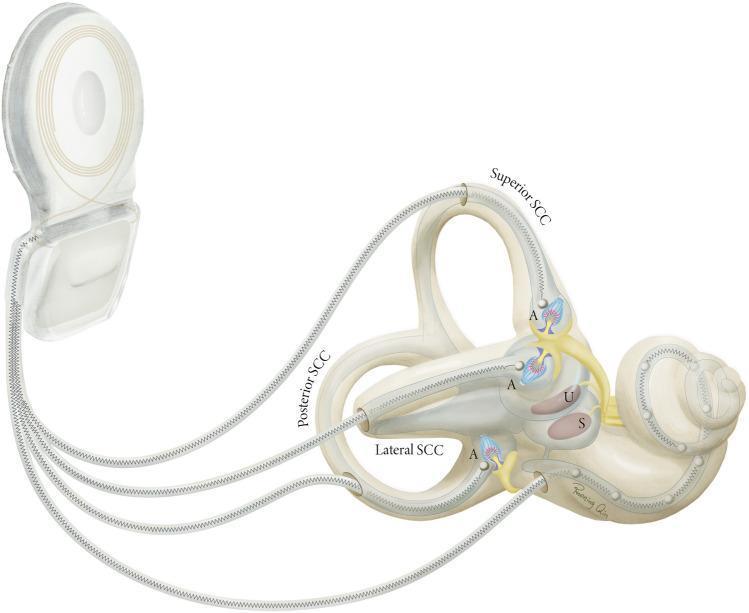
A medical anatomical diagram illustrating a vestibulocochlear implant system integrated with the human inner ear labyrinth. The visual highlights the relationship between the external processor/internal receiver unit and the terminal electrode arrays. The inner ear structures are clearly labeled, showing the three semicircular canals (Superior, Posterior, and Lateral SCC) in their orthogonal orientation, alongside the utricle (U) and saccule (S) within the vestibule. Each semicircular canal is depicted with an electrode lead entering through a bony fenestration to reach the ampulla (A), where it targets the terminal afferent nerve fibers of the crista ampullaris. A separate cochlear lead is shown entering the base of the cochlea. This illustration demonstrates the surgical placement and anatomical targets of vestibular implants designed to restore balance by electrically stimulating the vestibular system's sensory organs.
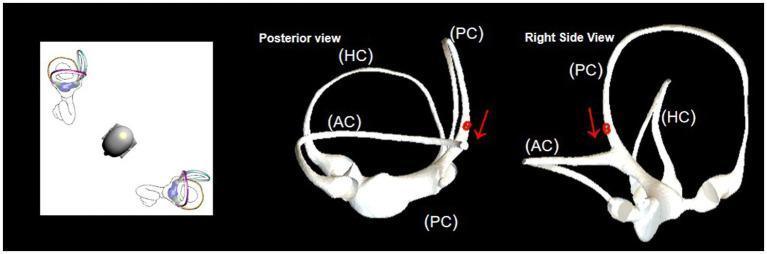
This medical illustration presents three-dimensional virtual simulation models of the human vestibular system, specifically focusing on the semicircular canals. The image is divided into three panels: a general orientation diagram and two detailed anatomical views labeled 'Posterior view' and 'Right Side View'. The diagrams depict the three semicircular canals: the Anterior Canal (AC), Horizontal Canal (HC), and Posterior Canal (PC), which are orthogonal to each other for sensing angular acceleration. In both the posterior and right side perspectives, red arrows and small red spheres (representing otoliths) are positioned within the posterior canal. These indicators illustrate the pathophysiological mechanism of Benign Paroxysmal Positional Vertigo (BPPV), specifically demonstrating canalithiasis where otoliths move toward the common crus or utricle during a repositioning maneuver, such as the Epley maneuver. The models highlight the spatial orientation of the canals and the common duct connection, serving as an educational tool for analyzing nystagmus data and optimizing canalith repositioning procedures.
neuromuscular junction acetylcholine motor endplate diagram
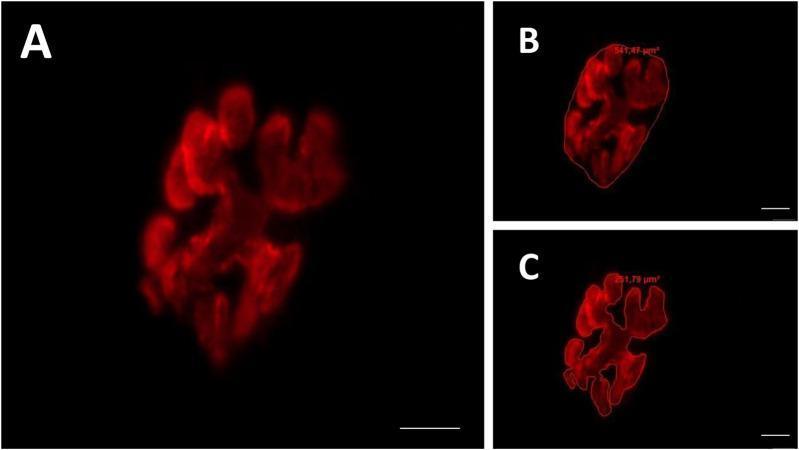
This composite diagnostic image features three panels (A, B, C) showcasing fluorescence microscopy of a mammalian motor endplate at 800x magnification. The primary staining utilizes rhodamine-conjugated alpha-bungarotoxin to visualize the distribution of acetylcholine receptors (AChR) in the postsynaptic compartment. Panel A shows the raw fluorescence signal, revealing a characteristic irregular, clustered morphology of the receptor groups with interspersed dark, non-stained areas. Panel B demonstrates the 'total area' and 'total perimeter' measurement technique, where a red border encompasses the entire synaptic territory, including both receptor clusters and internal gaps (measuring 541.47 µm²). Panel C illustrates the 'stained area' measurement, where the perimeter strictly traces only the fluorescently labeled regions (measuring 251.78 µm²). These images serve as a methodological example for quantifying synaptic plasticity, endplate dispersion, and neuromuscular junction health in neurobiology and clinical physiology research.
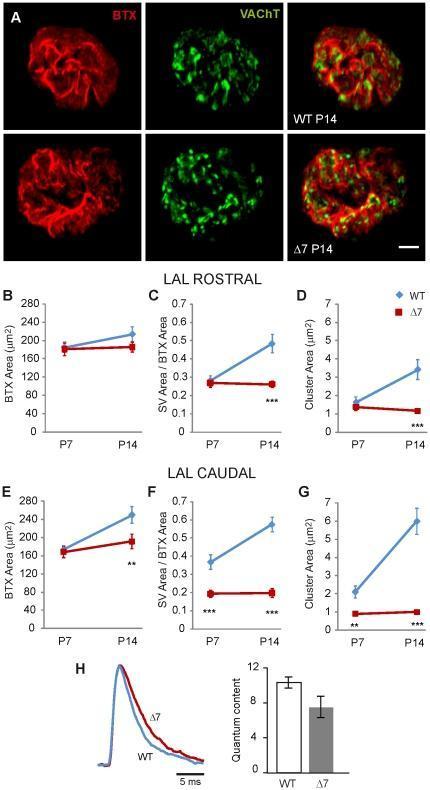
This composite educational graphic details neuromuscular junction (NMJ) alterations in Spinal Muscular Atrophy (SMA) using a SMNΔ7 mouse model. Section A presents immunofluorescence images of motor terminals at postnatal day 14 (P14) in wild-type (WT) and SMNΔ7 mice. Postsynaptic acetylcholine receptors are labeled with Bungarotoxin (BTX-Rho, red) and presynaptic synaptic vesicles (SVs) with Vesicular Acetylcholine Transporter (VAChT, green). The images reveal that while postsynaptic morphology appears similarly mature and reticulated in both groups, the SVs in SMNΔ7 terminals exhibit abnormal clustering and reduced occupancy compared to the dispersed distribution in WT. Sections B–G provide quantitative line graphs comparing the levator auris longus (LAL) muscle's rostral and caudal divisions. These plots track mean postsynaptic area, SV area normalized to BTX area, and cluster area from P7 to P14. The data show significant developmental stagnation and reduction in SV parameters in the SMNΔ7 group, particularly in the caudal division. Section H includes representative endplate potential (EPP) traces and a bar graph of quantum content, illustrating functional synaptic transmission deficits in the mutant terminals.
Six Core Physiology Topics - Comprehensive Review
1. Ear Vestibular Apparatus
- Cochlea (hearing, not equilibrium)
- Three semicircular canals (anterior, posterior, lateral)
- Utricle and saccule (static equilibrium and linear acceleration)
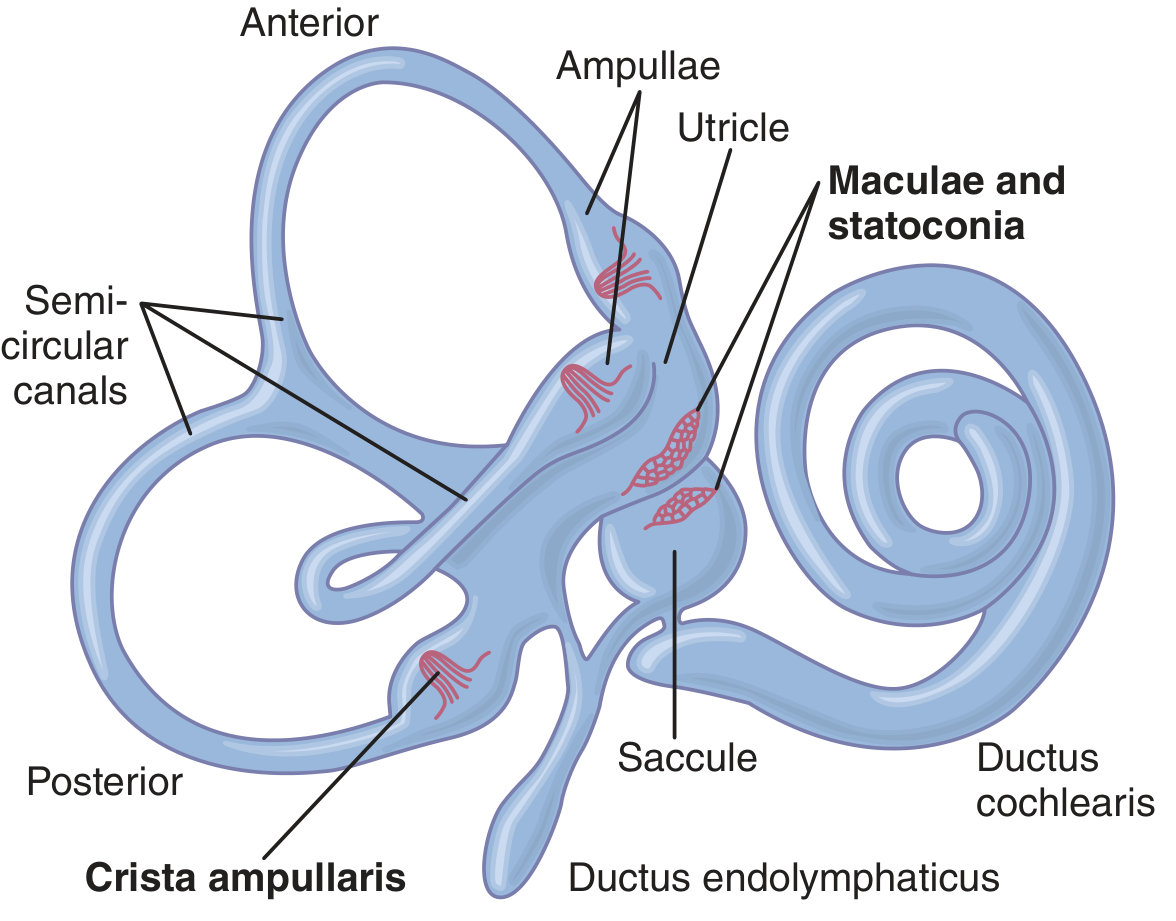
Maculae (Utricle & Saccule)
- Utricle macula: lies in the horizontal plane → detects head orientation when upright
- Saccule macula: lies in a vertical plane → detects orientation when lying down
Semicircular Canals (Angular Acceleration)
2. Wallerian Degeneration
Distal Segment Changes
- Earliest event: disruption of retrograde and anterograde axonal flow
- Rapid inflow of Ca²⁺ and Na⁺ through disrupted axonal plasma membrane activates apoptosis-like cascades
- Leukocyte recruitment + cytokine-mediated signaling → synthesis of neurotrophins, chemokines, proteolytic enzymes, interleukins
- By day 3: Schwann cells retract from the node of Ranvier
- Activated Schwann cells + macrophages digest myelin
- Complete axonal degeneration within ~1 week
Proximal Segment Changes (Chromatolysis)
- Axon breakdown extends proximally to the first node of Ranvier
- Cell body undergoes chromatolysis:
- Dispersal of rough endoplasmic reticulum (Nissl substance)
- Eccentric displacement of the cell nucleus
- Upregulation of transcription factors → shift from axon maintenance to protein synthesis
Nerve Regeneration
- Remyelination (grade I/focal demyelination) - recovery in weeks/months, but new myelin is thinner with multiple internodes
- Collateral sprouting (grades II-V) - intact axons sprout from nodes of Ranvier or terminals to reinnervate denervated muscle fibers (begins 4 days post-injury; clinical recovery 3-6 months)
- Proximal-to-distal regeneration - new axons grow from the proximal stump guided by Schwann cells (Bands of Büngner), which upregulate c-Jun
3. Muscle Contraction
The Sliding Filament Mechanism
- Ca²⁺ release from sarcoplasmic reticulum (triggered by action potential)
- Ca²⁺ binds troponin C → conformational change in tropomyosin → exposes actin binding sites
- Myosin head (loaded with ADP + Pᵢ) binds actin → cross-bridge formation
- Power stroke: release of ADP + Pᵢ → myosin head pivots → actin filament slides
- ATP binds myosin → cross-bridge detaches → ATP hydrolysis → myosin head re-cocks
Energy Sources for Muscle Contraction
| Source | Speed | Notes |
|---|---|---|
| Creatine phosphate | Fastest | Creatine kinase converts ADP → ATP; depleted in ~10 sec |
| Glycolysis (blood glucose/glycogen) | Fast | Ca²⁺ activates glycogen phosphorylase; anaerobic possible |
| Oxidative phosphorylation | Slow but sustained | Primary aerobic source; requires O₂ |
| Adenylyl kinase | Last resort | 2 ADP → ATP + AMP when other sources exhausted |
- Red muscle fibers contain myoglobin for O₂ storage
- Ca²⁺ also activates phosphorylase b kinase → mobilizes glycogen at contraction onset
4. Neuromuscular Junction
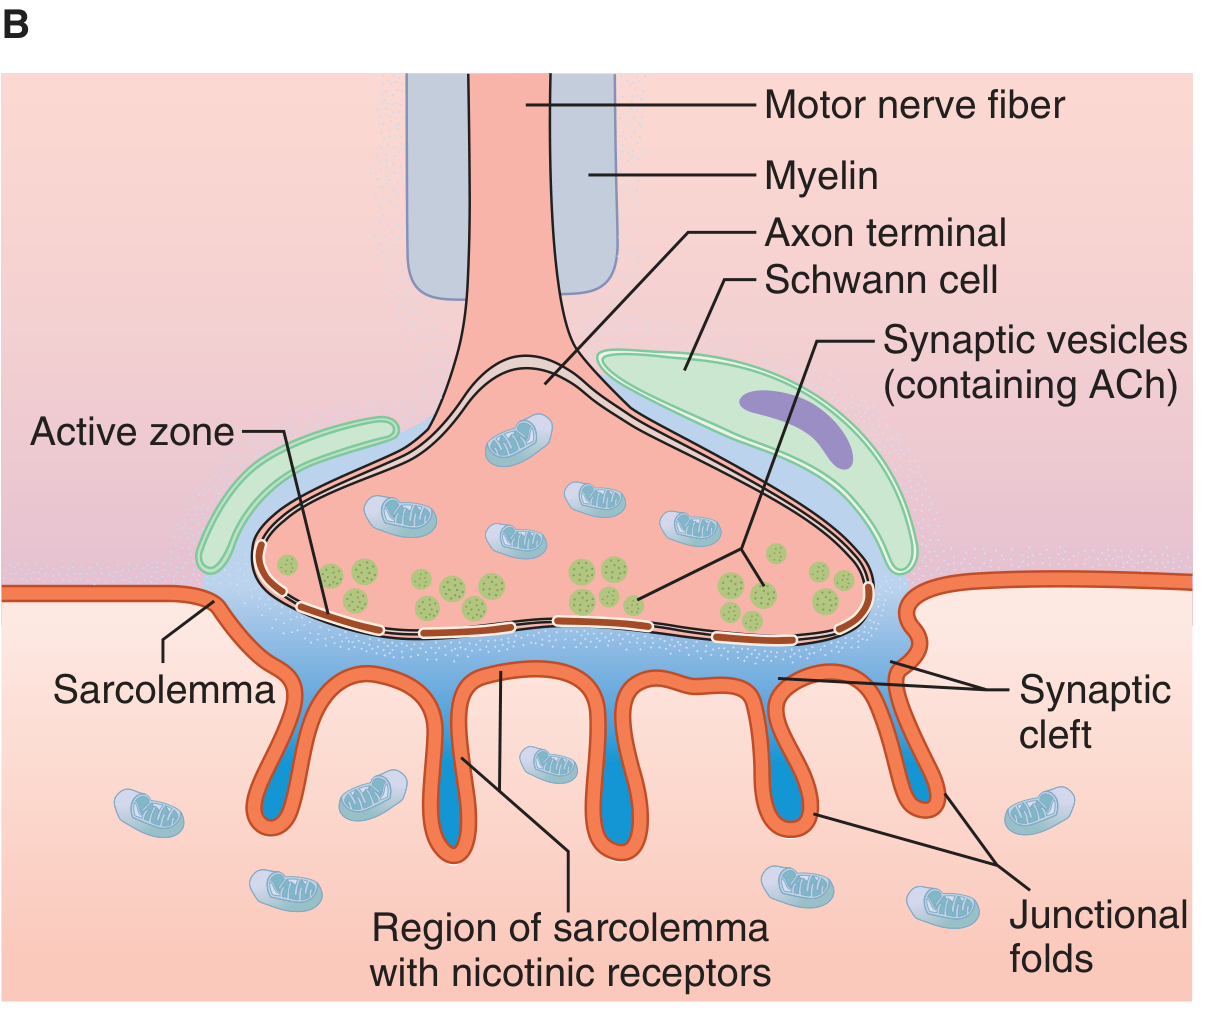
Anatomy
- Motor axon loses myelin sheath → divides into terminal boutons
- Boutons contain synaptic vesicles loaded with acetylcholine (ACh)
- Boutons fit into junctional folds of the motor endplate (thickened sarcolemma)
- Nicotinic Mₘ receptors concentrate at the tops of junctional folds
- Synaptic cleft separates nerve terminal from endplate
Sequence of Transmission
- Action potential arrives at motor nerve terminal
- Ca²⁺ influx through voltage-gated Ca²⁺ channels (active zone)
- Ca²⁺ triggers exocytosis of ACh-containing vesicles
- ACh diffuses across synaptic cleft → binds nicotinic N_M receptors
- Receptor channel opens → increased Na⁺ + K⁺ conductance → endplate potential (EPP) (depolarization)
- EPP spreads → depolarizes adjacent muscle membrane to threshold → muscle action potential
- Acetylcholinesterase in the cleft rapidly hydrolyzes ACh → terminates signal
5. Action Potential
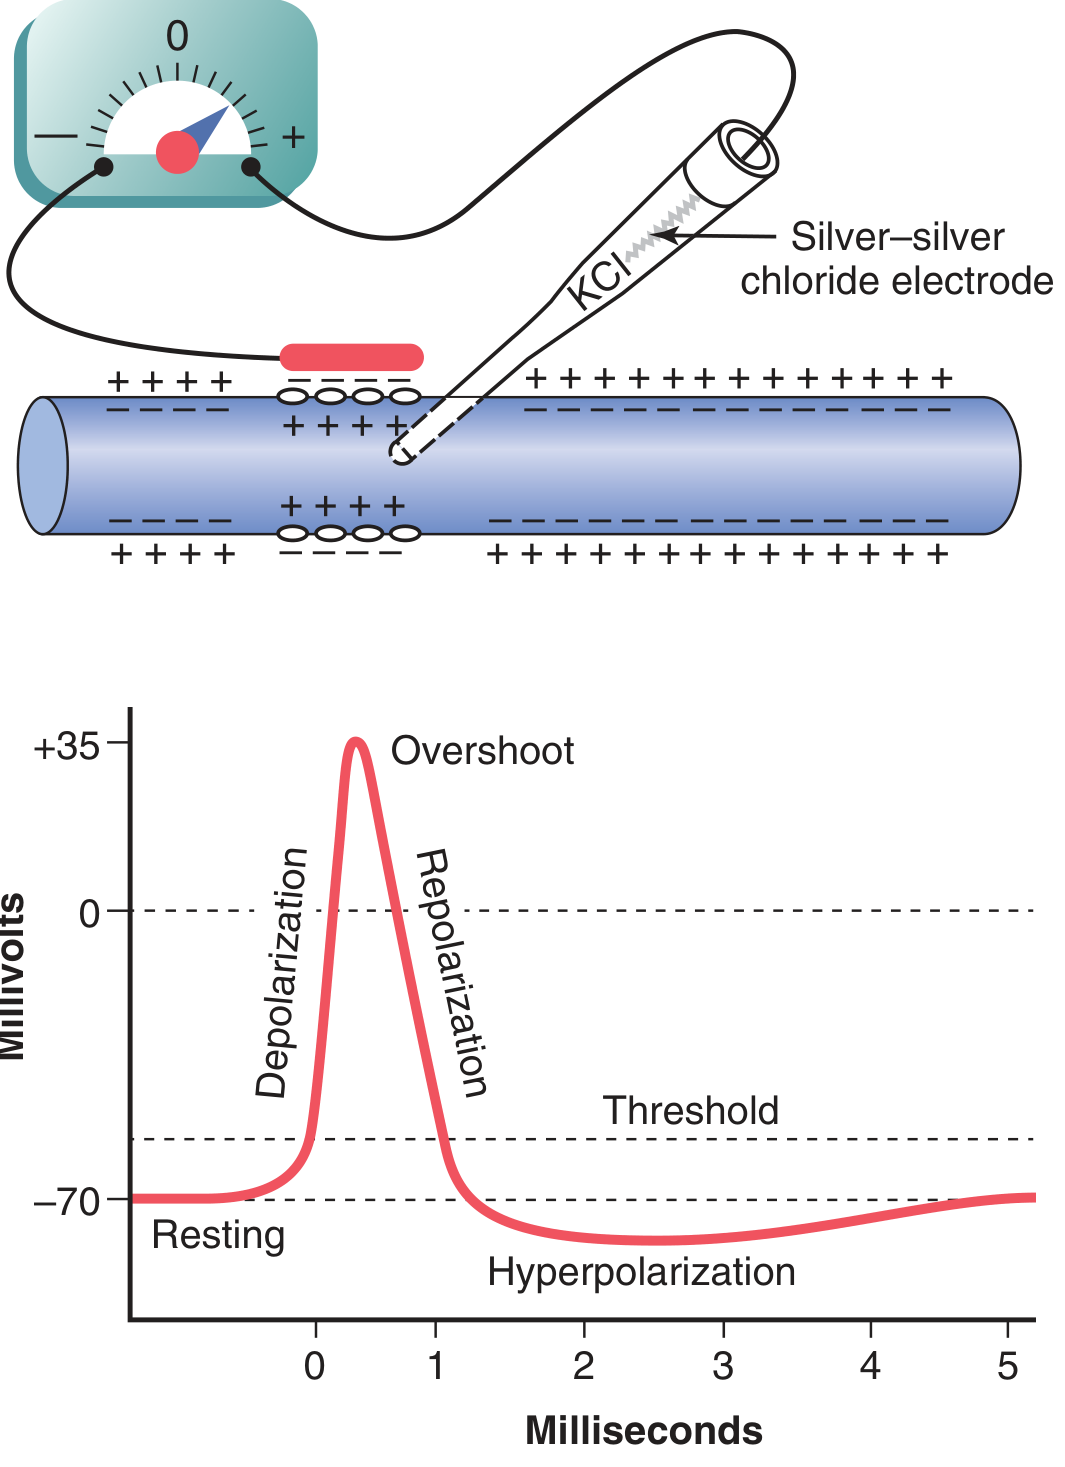
Stages of the Action Potential
| Stage | Voltage | Ion Movement | Channel State |
|---|---|---|---|
| Resting | -70 mV | Maintained by Na⁺/K⁺ ATPase | K⁺ leak channels open |
| Depolarization | -70 → +35 mV | Na⁺ floods in | Voltage-gated Na⁺ channels open |
| Repolarization | +35 → -70 mV | K⁺ flows out | Na⁺ channels inactivate; K⁺ channels open |
| Hyperpolarization (undershoot) | Below -70 mV | Excess K⁺ efflux | K⁺ channels slow to close |
Key Concepts
- Threshold: ~-55 mV (all-or-none law - once threshold is reached, the full AP fires)
- Na⁺ channel states: (1) closed/resting → (2) open/active → (3) inactivated (refractory)
- Absolute refractory period: Na⁺ channels inactivated; no AP possible
- Relative refractory period: Na⁺ channels recovering; AP possible only with stronger stimulus
- Conduction velocity: increases with fiber diameter and myelination (saltatory conduction at nodes of Ranvier)
6. Cellular Transport
Types of Cellular Transport
Passive Transport (no energy)
- Simple diffusion: lipid-soluble substances (O₂, CO₂, fatty acids) move down concentration gradient through the lipid bilayer
- Facilitated diffusion: uses carrier proteins or channel proteins; still down gradient; examples - glucose (GLUT transporters), water (aquaporins)
Active Transport (energy required)
- Primary active transport: directly uses ATP; e.g., Na⁺/K⁺-ATPase pumps 3 Na⁺ out and 2 K⁺ in per ATP → creates the resting membrane potential
- Secondary active transport (cotransport): uses the electrochemical gradient established by primary transport
- Symport: both substances move same direction (e.g., Na⁺/glucose in intestine)
- Antiport: substances move in opposite directions (e.g., Na⁺/H⁺ exchanger)
Active Transport Through Cellular Sheets
- Step 1: Active transport through one side of the cell (basolateral Na⁺/K⁺ ATPase pumps Na⁺ out)
- Step 2: Diffusion through the opposite (luminal) side
- Creates osmotic gradient → water follows
Axonal (Cellular) Transport in Neurons
| Type | Direction | Speed | Mechanism | Cargo |
|---|---|---|---|---|
| Fast orthograde | Cell body → terminal | ~400 mm/day | Kinesin along microtubules | Membrane vesicles, organelles |
| Slow orthograde | Cell body → terminal | 0.5-10 mm/day | Kinesin | Cytoskeletal proteins |
| Retrograde | Terminal → cell body | ~200 mm/day | Dynein along microtubules | Used vesicles, NGF, viruses |
- Orthograde transport (also called anterograde) maintains the functional and anatomical integrity of the axon
- Retrograde transport carries signals back to the cell body (e.g., nerve growth factor, herpes virus, rabies virus exploit this pathway)
- Disruption of axonal transport is a key mechanism in Wallerian degeneration
- Guyton and Hall Textbook of Medical Physiology - Vestibular apparatus, action potential, cellular transport
- Bradley and Daroff's Neurology in Clinical Practice - Wallerian degeneration
- Harper's Illustrated Biochemistry, 32nd Ed - Muscle contraction energetics
- Ganong's Review of Medical Physiology, 26th Ed - Neuromuscular junction, axonal transport