
/generatehandwrittenimages Discuss genesis of resting membrane potential and effects of hypokalemia and hyperkalemia on it. - for md physiology 10 marks theory question. You can make many images and not just one for completing the answer
Handwritten medical notes style diagram for MD physiology exam showing "Genesis of Resting Membrane Potential". Include: title at top in underlined handwriting. Section 1: Ion concentrations table showing K+ inside 140 mEq/L outside 4 mEq/L; Na+ inside 14 mEq/L outside 142 mEq/L; Cl- inside 4 mEq/L outside 104 mEq/L. Section 2: Nernst equation written out: E = 61 log [Co]/[Ci] with K+ equilibrium = -94 mV, Na+ equilibrium = +61 mV. Section 3: Goldman equation written out. Section 4: Three contributors listed with arrows: 1) K+ diffusion potential (-94 mV) - major contributor, 2) Na+ diffusion potential (partially offsets), 3) Na-K ATPase pump (-4 mV electrogenic). Final RMP = -70 to -90 mV. Blue ink on white lined paper, neat handwriting with boxes around key values, arrows showing ion movements across a simple cell membrane sketch.
Handwritten medical notes page for MD physiology exam titled "Effects of Hypokalemia on Resting Membrane Potential". Blue ink on ruled white paper, neat student handwriting. Content: Hypokalemia = serum K+ less than 3.5 mEq/L. Nernst equation arrow: K+ inside/outside ratio INCREASES when plasma K+ falls. Effect on SKELETAL MUSCLE: RMP becomes more negative (hyperpolarization) e.g. from -90 mV to -100 mV. Mechanism arrow diagram: LOW extracellular K+ → increased K+ inside/outside ratio → more K+ diffuses out → interior more negative → HYPERPOLARIZATION → cell HARDER to excite → muscle weakness and paralysis. Effect on CARDIAC (Purkinje fibers): Paradoxical DEPOLARIZATION via K2P1 (TWIK-1) channels - these channels switch from K+ selective to Na+ transport when K+ is low, causing Na+ influx and depolarization. ECG changes box: flat T waves, ST depression, U waves, prolonged QT, risk of torsades de pointes. Draw a simple voltage scale diagram showing -90mV baseline shifting to -100mV for skeletal muscle. Add a warning star: PARADOX in cardiac cells.
Handwritten medical notes page for MD physiology exam titled "Effects of Hyperkalemia on Resting Membrane Potential". Blue-black ink on ruled white paper, neat handwriting. Content: Hyperkalemia = serum K+ greater than 5.5 mEq/L. Nernst equation: K+ inside/outside ratio DECREASES when plasma K+ rises. Effect: RMP becomes LESS negative (depolarization) e.g. from -90 mV to -70 mV. Two-phase effect diagram: Phase 1 - Partial depolarization → cell approaches threshold → EASIER to excite → increased excitability (tingling, muscle twitching). Phase 2 - Sustained depolarization → Na+ channels become INACTIVATED (remain in inactivated state) → cell CANNOT fire action potentials → muscle weakness, flaccid paralysis. ECG changes progression box drawn with arrow: 1) Peaked tall T waves (early), 2) Widened QRS, 3) Flattened P waves, 4) Sine wave pattern, 5) Ventricular fibrillation / asystole (late). Simple voltage diagram showing RMP shifting from -90 mV toward threshold at -70 mV. Note: Hyperkalemia depresses ectopic pacemakers and slows conduction. Border the ECG changes box.
Handwritten medical diagram on white paper showing "Chord Conductance Equation and Goldman Equation for Resting Membrane Potential". Blue ink, neat handwriting, exam notes style. Show: Title underlined. Chord conductance equation: Em = (gK/gT)EK + (gNa/gT)ENa + (gCl/gT)ECl. Below it: Goldman-Hodgkin-Katz equation written out: Em = 61 log [(PK[K+]out + PNa[Na+]out + PCl[Cl-]in) / (PK[K+]in + PNa[Na+]in + PCl[Cl-]out)]. Then a table: Ion | Permeability ratio at REST: K+ = 1.0 (reference), Na+ = 0.04, Cl- = 0.45. Below: "At rest: PK >> PNa therefore RMP is close to EK = -94 mV". Final RMP = -70 to -90 mV. Summary box: "RMP determined mainly by: 1) K+ concentration gradient (major) 2) K+ leak channels (high permeability) 3) Na-K ATPase pump (minor, -4 mV direct electrogenic effect but major indirect by maintaining gradient)". Draw a small pie chart showing relative contributions.
Handwritten medical exam summary table on white ruled paper titled "Comparison: Hypokalemia vs Hyperkalemia Effects on Membrane Potential". Blue pen, neat handwriting. Draw a two-column comparison table with the following rows: Parameter | Hypokalemia (K+ less than 3.5) | Hyperkalemia (K+ greater than 5.5). Rows: Serum K+ | Low | High. K+ inside/outside ratio | Increases | Decreases. RMP | Hyperpolarized (more negative) | Depolarized (less negative). Excitability (skeletal) | Decreased - hard to fire | Increased then decreased. Cardiac effect | Paradoxical depolarization (TWIK-1 channels) | Depolarization → Na channel inactivation. ECG | Flat T, U wave, long QT, torsades | Peaked T, wide QRS, sine wave, VF/asystole. Clinical | Muscle weakness, paralysis, cramps | Muscle weakness, flaccid paralysis, arrhythmia. Treatment | K+ supplementation | Calcium gluconate, insulin+glucose, kayexalate. Box at bottom: Mnemonic - HYPO K = Hyperpolarizes (skeletal), HYPER K = Depolarizes. Add borders and neat formatting.
RESTING MEMBRANE POTENTIAL (RMP) - Genesis & Effects of Potassium Disorders
PART 1: GENESIS OF RESTING MEMBRANE POTENTIAL
DIAGRAM 1: Genesis Overview
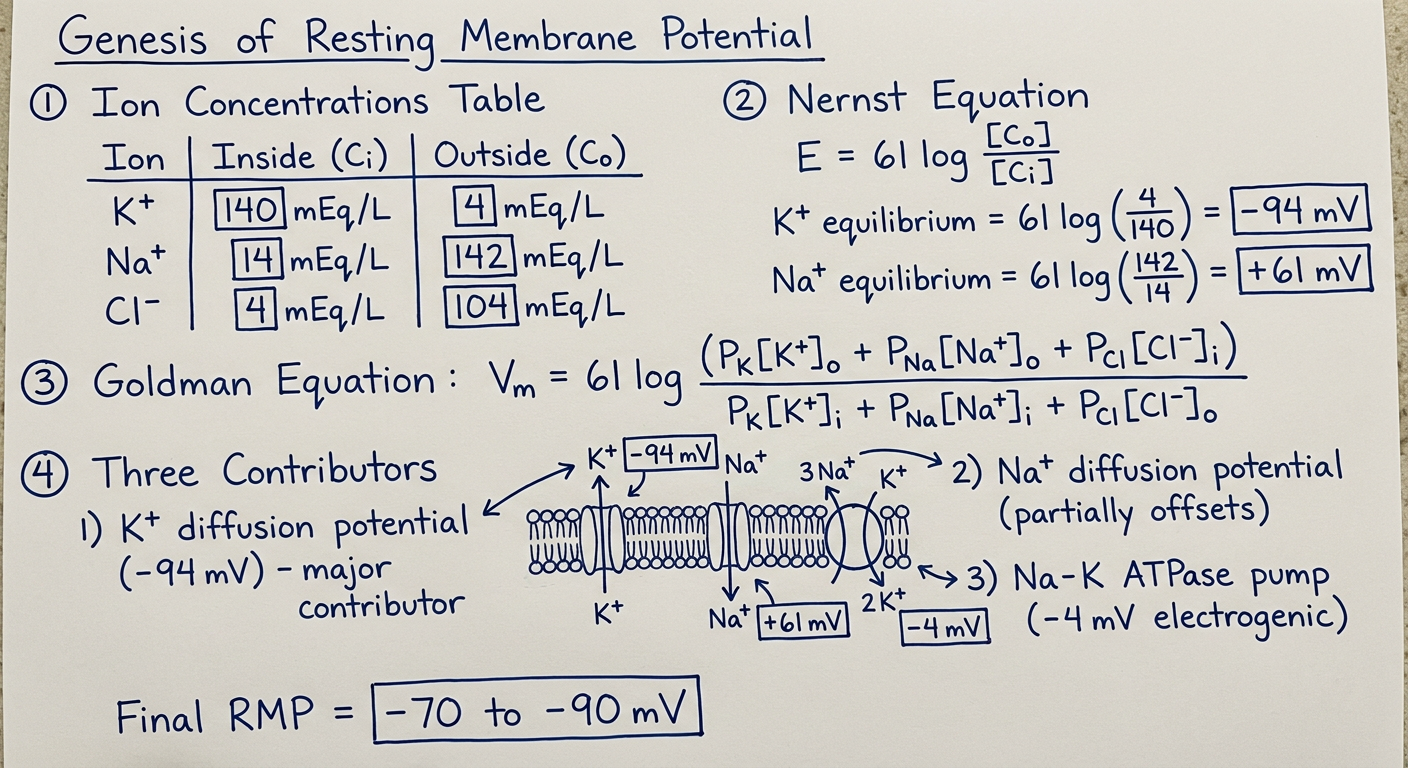
A. Prerequisites - Ion Concentration Gradients
| Ion | Intracellular | Extracellular |
|---|---|---|
| K+ | 140 mEq/L | 4 mEq/L |
| Na+ | 14 mEq/L | 142 mEq/L |
| Cl- | 4 mEq/L | 104 mEq/L |
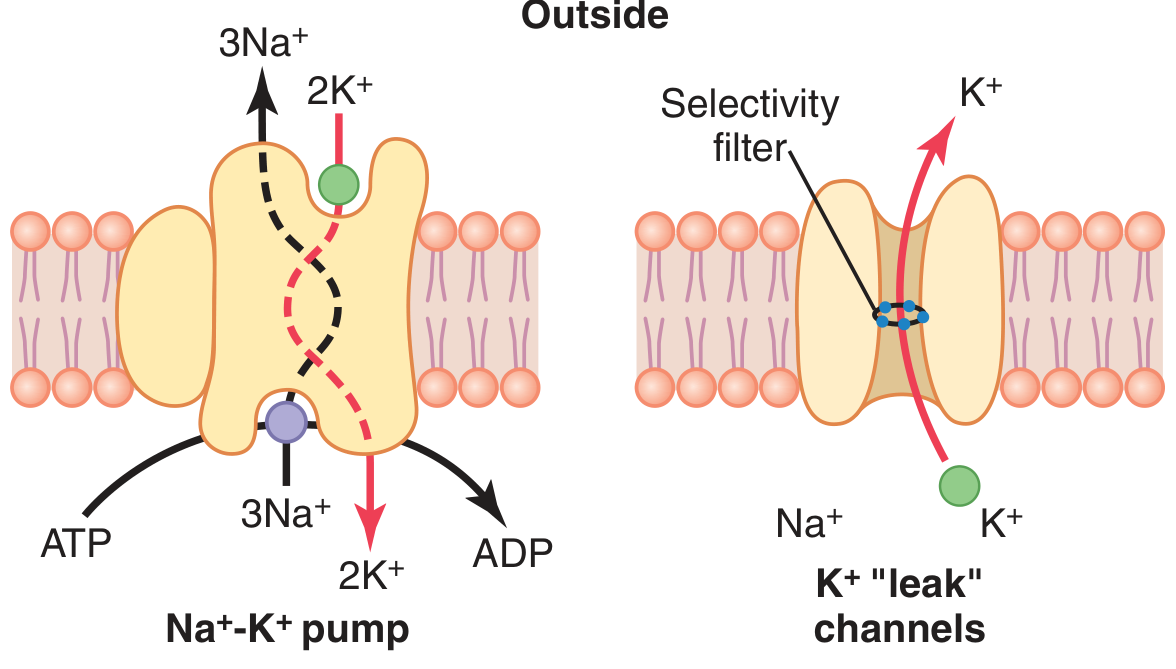
B. Three Contributors to RMP
- K+ has high resting permeability through K+ "leak" channels (K2P channels)
- K+ diffuses outward down its concentration gradient
- Leaves interior negative → drives RMP toward E_K+
- Nernst potential for K+ = -94 mV
- Small resting Na+ permeability (PNa ~1/100th of PK)
- Na+ diffuses inward, partially offsetting K+ effect
- Nernst potential for Na+ = +61 mV
- Net result with Goldman equation: -86 mV
- 3 Na+ pumped out : 2 K+ pumped in = net loss of +ve charge inside
- Direct contribution: ~-4 mV additional
- Indirect (critical): maintains the K+ concentration gradient that drives the diffusion potential
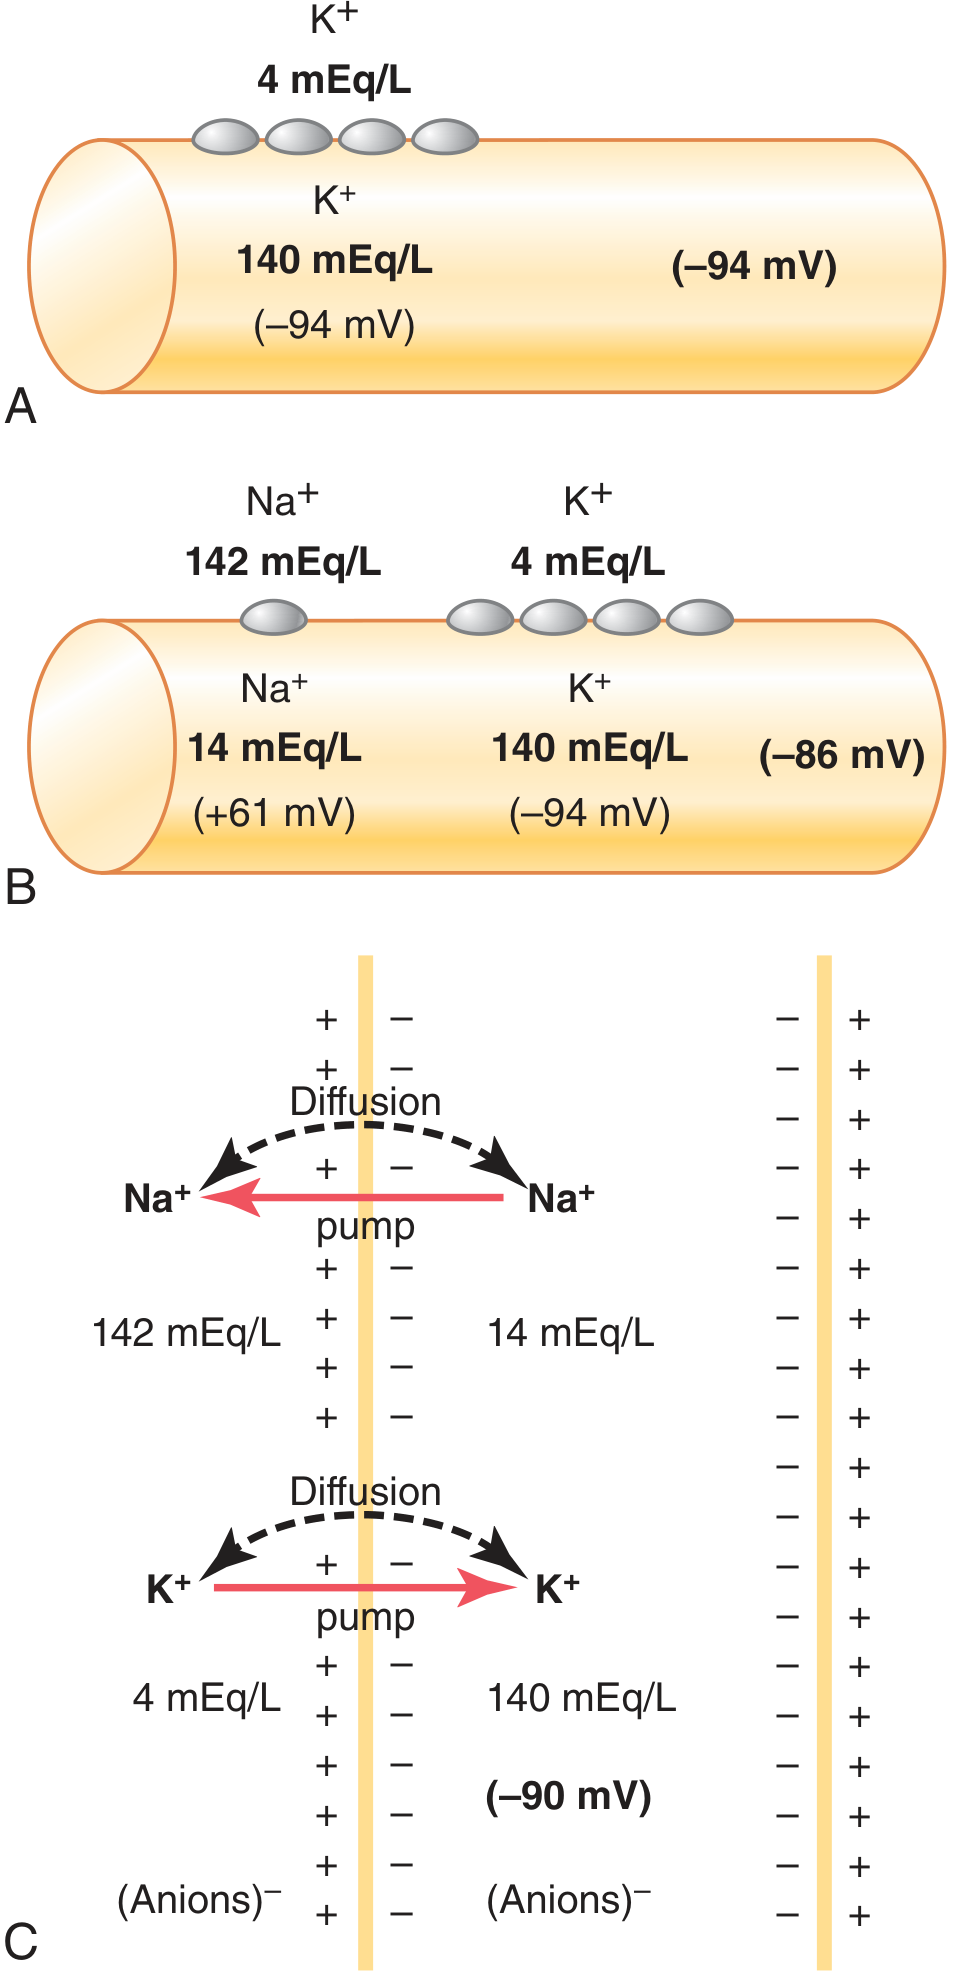
C. Equations
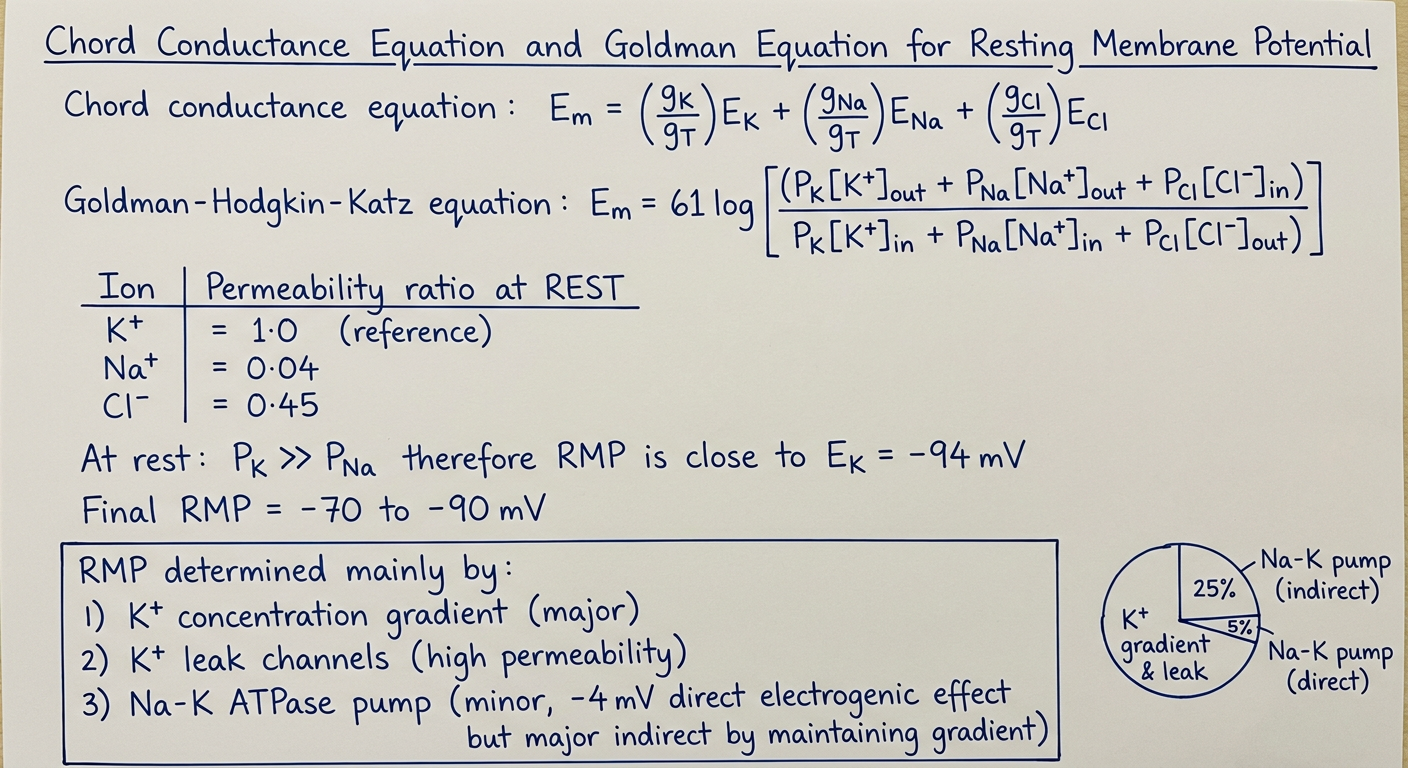
E_m = (g_K/g_T)·E_K + (g_Na/g_T)·E_Na + (g_Cl/g_T)·E_Cl
E_m = 61·log [(P_K[K+]out + P_Na[Na+]out + P_Cl[Cl-]in) / (P_K[K+]in + P_Na[Na+]in + P_Cl[Cl-]out)]
PART 2: EFFECTS OF HYPOKALEMIA ON RMP
Mechanism:
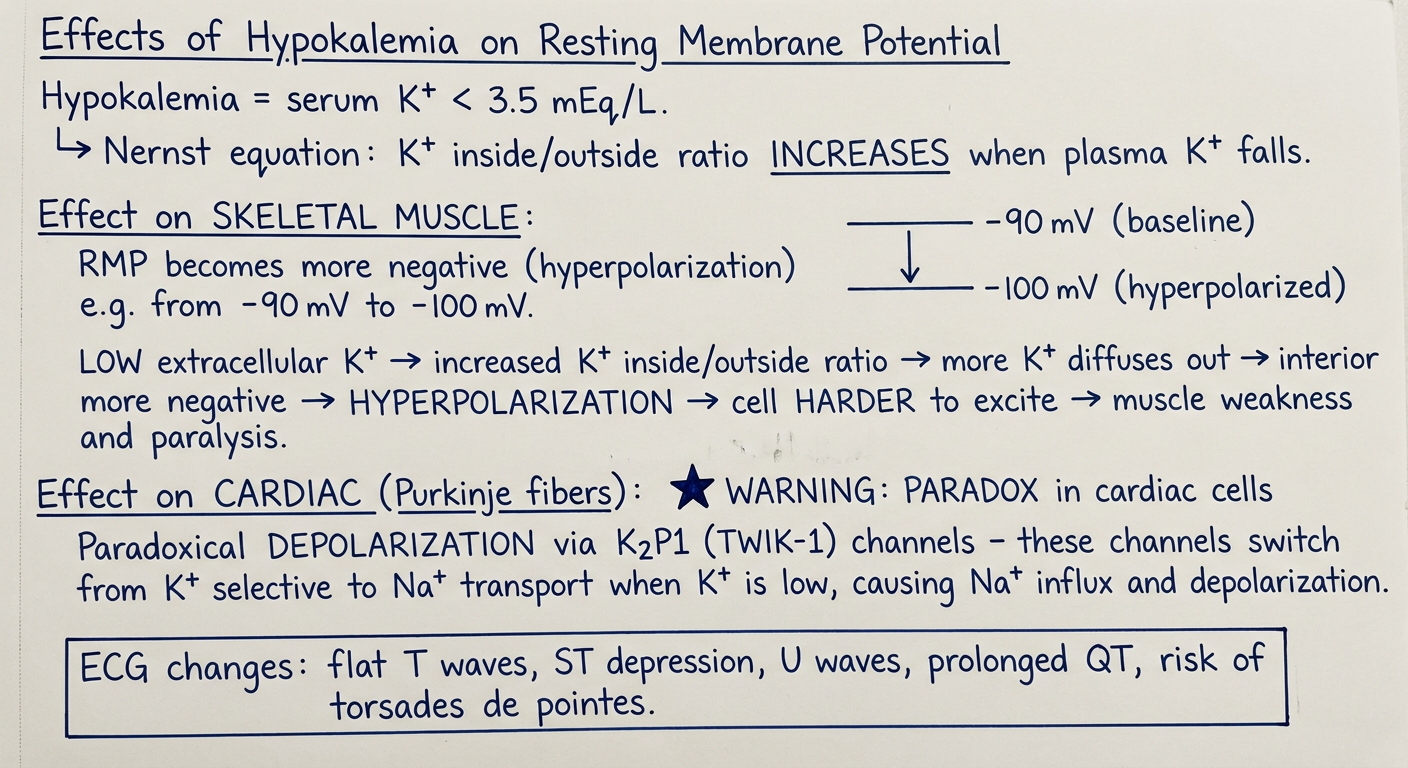
- Low extracellular K+ → [K+]in / [K+]out ratio increases
- By the Nernst equation, E_K becomes more negative
- More K+ diffuses outward → interior becomes more negative
Effect on Skeletal Muscle - HYPERPOLARIZATION:
- RMP shifts from -90 mV toward -100 mV (more negative)
- Cell is further from threshold → harder to excite
- Clinical result: muscle weakness → paralysis (including diaphragm in severe cases)
Effect on Cardiac Cells - PARADOXICAL DEPOLARIZATION:
- Human cardiac Purkinje fibers express K2P1 (TWIK-1) channels
- Hypokalemia causes TWIK-1 to switch from K+-selective transport to Na+ influx
- This causes paradoxical depolarization in cardiac conducting tissue
- Rodent cardiac cells (lacking TWIK-1) respond with predicted hyperpolarization - confirming the TWIK-1 mechanism
Additional Cardiac Mechanism:
- Hypokalemia downregulates Na+/K+-ATPase activity
- Intracellular Na+ rises → impedes Na+-Ca2+ exchanger → intracellular Ca2+ overload
- Activates calmodulin kinase II → late Na+ and Ca2+ currents → early afterdepolarizations
- Accelerates internalization of HERG K+ channels (IKr) → reduced repolarization reserve
ECG Changes in Hypokalemia:
- Broad flat T waves, ST depression
- Prominent U waves
- Prolonged QT interval
- Risk of torsades de pointes and polymorphic VT (when K+ < 2.7 mEq/L)
PART 3: EFFECTS OF HYPERKALEMIA ON RMP
Mechanism:
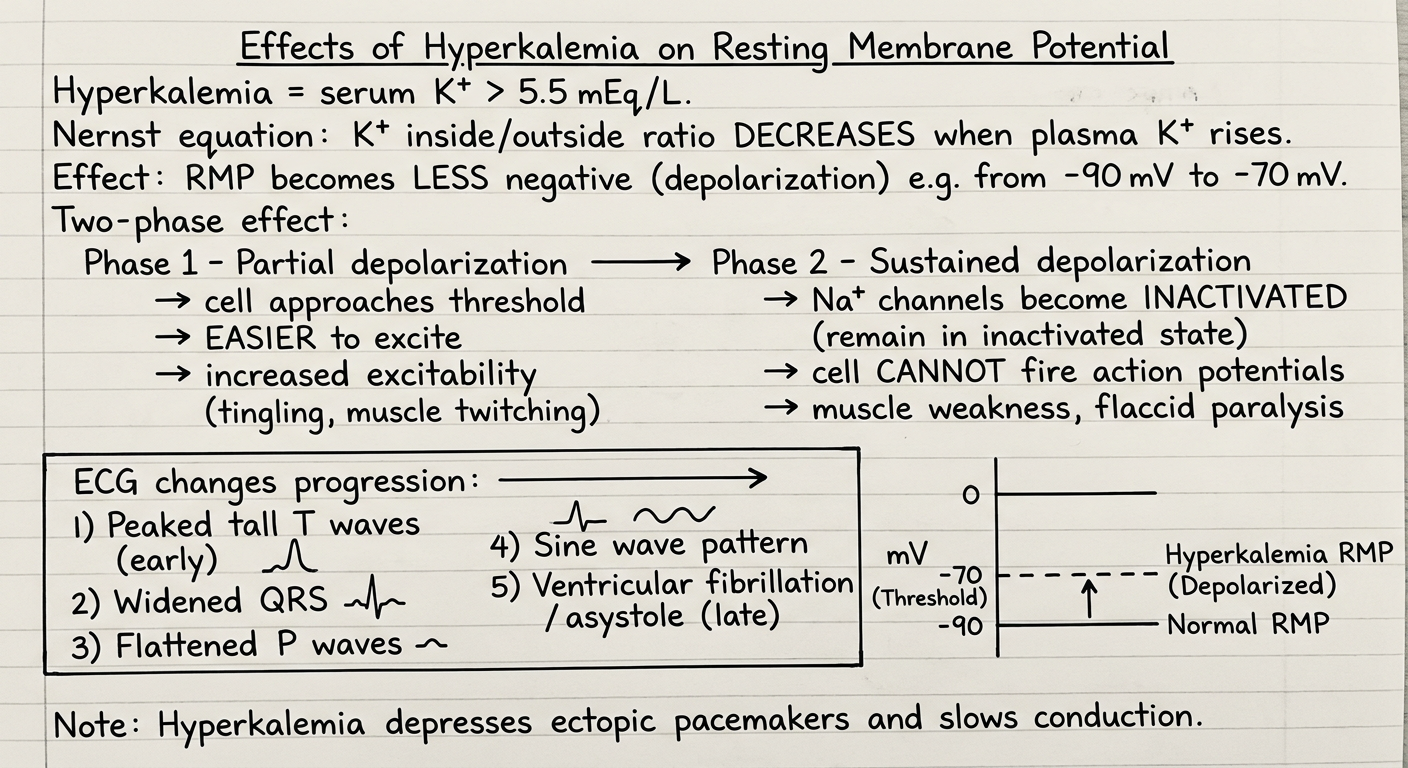
- High extracellular K+ → [K+]in / [K+]out ratio decreases
- E_K becomes less negative (Nernst equation)
- Less K+ diffuses outward → less interior negativity
Effect - DEPOLARIZATION (two phases):
- RMP shifts from -90 mV toward -70 mV (closer to threshold ~-55 mV)
- Cell is easier to fire → hyperexcitability
- Clinical: muscle fasciculations, paresthesias, tingling
- Prolonged depolarization → voltage-gated Na+ channels get inactivated (h gates closed)
- Channels remain in inactivated, non-conducting state
- Cell cannot fire action potentials despite being closer to threshold
- Clinical: flaccid muscle weakness → paralysis
Cardiac Effects:
- Depolarizes cardiac myocytes → reduces RMP from -90 mV toward less negative values
- Hyperkalemia depresses ectopic pacemakers (suppresses SA node only in severe cases)
- Slows conduction through the AV node and His-Purkinje system
- Both insufficient AND excess K+ are arrhythmogenic
ECG Changes in Hyperkalemia (progressive with rising K+):
- Peaked, tall, narrow T waves (early, K+ 5.5-6.5)
- Prolonged PR interval, widened QRS (K+ 6.5-8.0)
- Flattened/absent P waves
- Sine wave pattern (merging of QRS and T)
- Ventricular fibrillation / asystole (K+ > 8-9 mEq/L)
PART 4: COMPARISON TABLE
SUMMARY POINTS FOR 10-MARK ANSWER
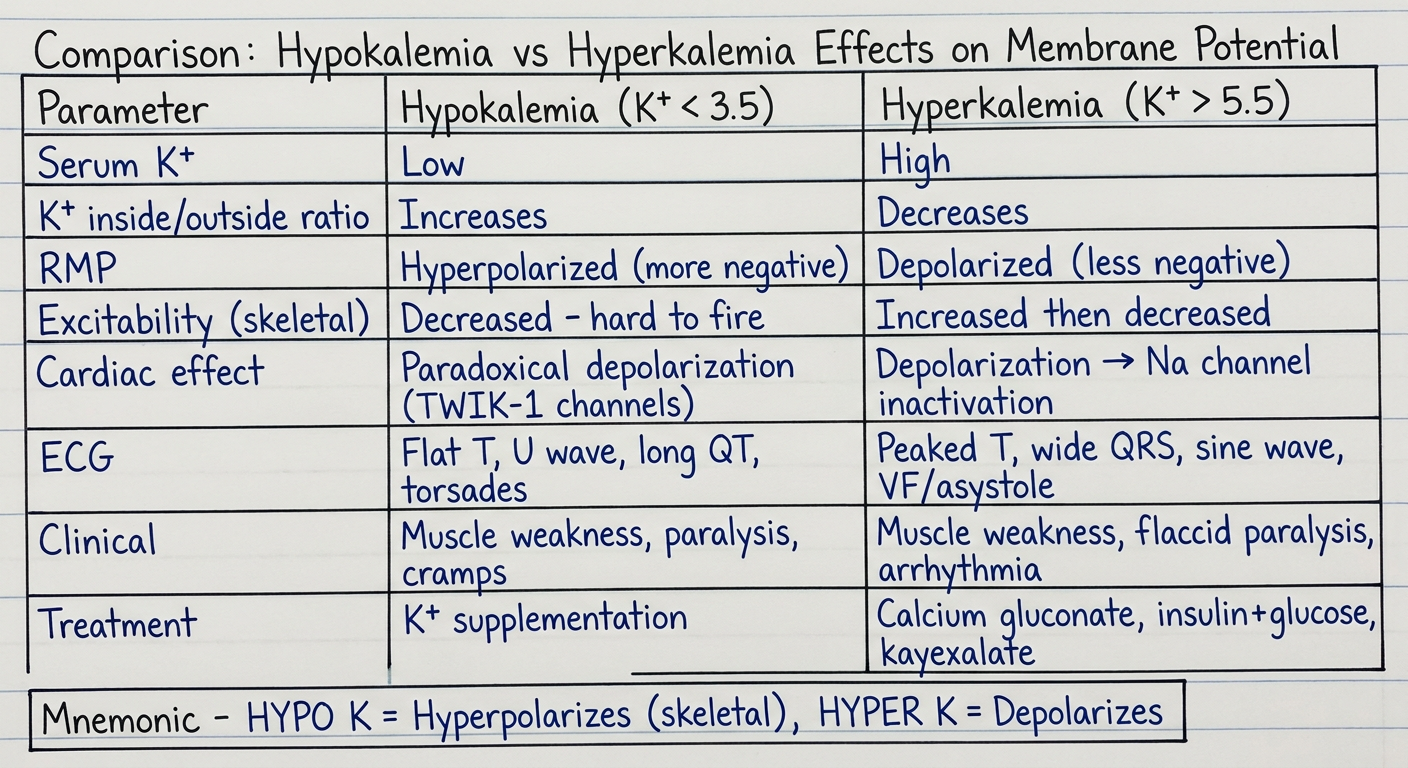
| Hypokalemia | Hyperkalemia | |
|---|---|---|
| K+ outside | ↓ | ↑ |
| [K+]in/[K+]out ratio | ↑ | ↓ |
| RMP | Hyperpolarized (more -ve) | Depolarized (less -ve) |
| Skeletal excitability | ↓ (weakness/paralysis) | ↑ then ↓ (fasciculations then paralysis) |
| Cardiac | Paradoxical depolarization (TWIK-1) | Depolarization → Na+ channel inactivation |
| ECG | Flat T, U waves, long QT, TdP | Peaked T → wide QRS → sine wave → VF |