
Ovarian cycle
ovarian cycle follicular development ovulation corpus luteum diagram
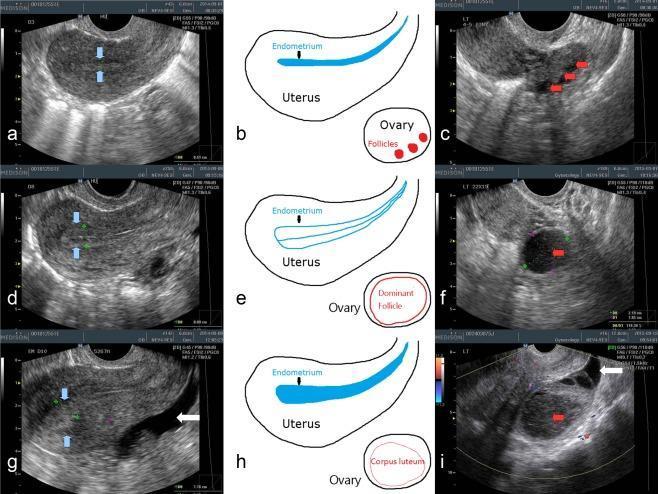
This composite figure illustrates transvaginal ultrasonography (TVUS) findings of the uterus and ovaries throughout the menstrual cycle, organized into three phases: early follicular (a-c), late follicular (d-f), and post-ovulatory luteal (g-i). In the early follicular phase, the endometrium is thin and homogenous (blue arrows), with multiple small antral follicles (red arrows) visible in the ovary. The late follicular phase displays a thickened endometrium with a characteristic 'triple-line' pattern (d) and a large, hypoechoic dominant follicle approximately 2 cm in diameter (f). The luteal phase shows a 'luteinized' endometrium with increased echogenicity (g) and the transformation of the dominant follicle into a corpus luteum (i), characterized by an inhomogenous internal structure and filament-like contents. Anechoic free fluid in the pelvis, indicative of recent ovulation, is highlighted by white arrows in the late follicular and luteal phase images. Schematic diagrams (b, e, h) provide anatomical context for the sonographic changes in endometrial morphology and ovarian follicle development.
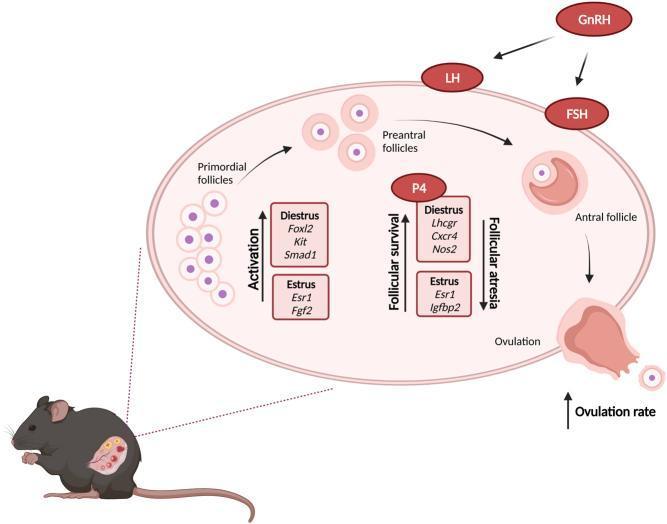
This pathophysiology diagram illustrates the sequential stages of ovarian follicular development and the regulatory factors influencing the ovulation rate, using a murine model for context. The process initiates with primordial follicles, which undergo 'Activation' to become preantral follicles. These then mature into antral follicles, eventually culminating in ovulation. The Hypothalamic-Pituitary-Gonadal (HPG) axis is shown influencing the cycle through GnRH, which regulates LH and FSH, along with Progesterone (P4) involvement. Key regulatory pathways highlighted include 'Follicular survival,' which leads toward ovulation, and an opposing pathway for 'Follicular atresia.' The diagram maps specific molecular markers to the Diestrus and Estrus stages of the cycle. During Diestrus, follicular activation and survival are associated with Foxl2, Kit, Smad1, Lhcgr, Cxcr4, and Nos2. During Estrus, these processes involve Esr1, Fgf2, and Igfbp2. The educational focus is on the complex interplay between endocrine signaling and local gene expression that determines follicular fate and overall ovulation rate.
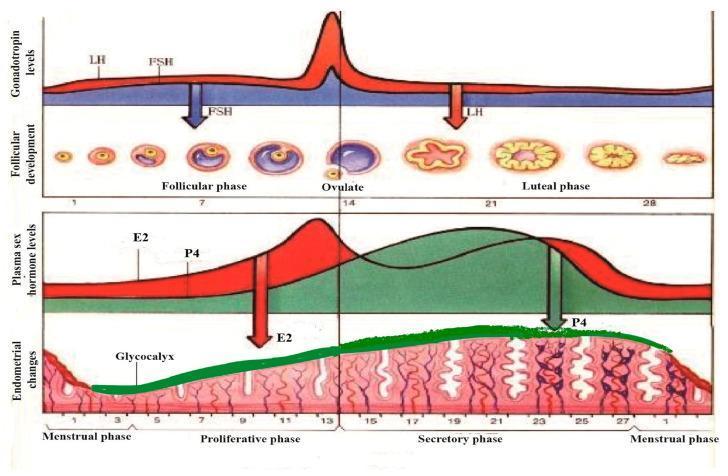
A multi-panel pathophysiology diagram illustrating the synchronous physiological changes during a standard 28-day human menstrual cycle. The top panel graphs gonadotropin levels, showing a sharp surge in Luteinizing Hormone (LH) and a moderate rise in Follicle-Stimulating Hormone (FSH) at day 14, correlating with the follicular phase, ovulation, and luteal phase stages. The corresponding follicular development shows the maturation of a primary follicle into a Graafian follicle, ovulation, and the formation of the corpus luteum and corpus albicans. The middle panel tracks plasma sex hormone levels, highlighting the mid-cycle peak of Estradiol (E2) and the post-ovulatory rise of Progesterone (P4). The bottom panel depicts endometrial morphology, transitioning from the menstrual phase to the proliferative and secretory phases. A green-shaded layer highlights the glycocalyx development, which thickens and becomes most prominent during the secretory phase under the influence of P4, before thinning during menstruation. The diagram demonstrates the hormonal regulation of the ovary and uterine lining for medical educational purposes.
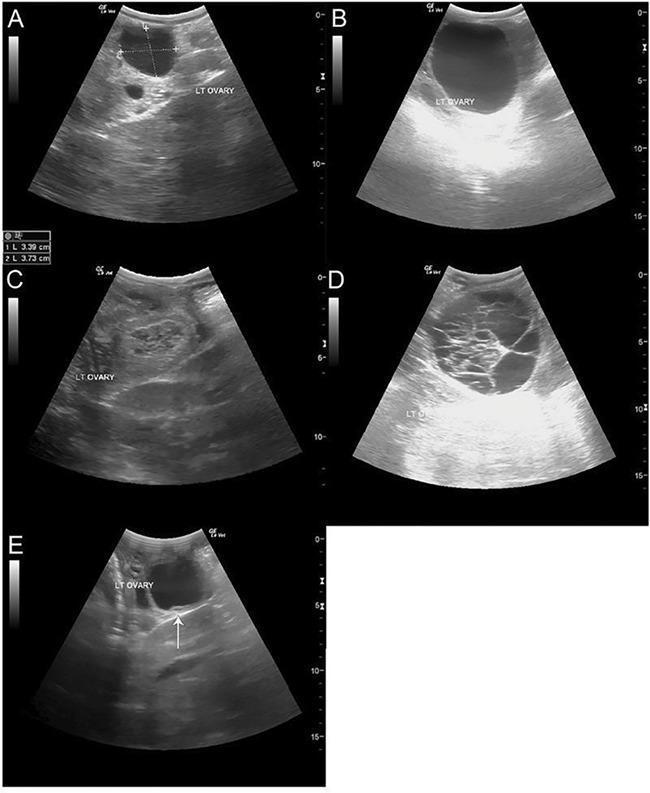
A series of five transabdominal ultrasound images (A-E) illustrating various stages and pathologies of ovarian follicular development. (A) Shows a dominant, pre-ovulatory follicle on the left ovary, measuring approximately 3.39 x 3.73 cm, displaying a characteristic hypoechoic, fluid-filled center. (B) Displays a significantly enlarged dominant follicle (approximately 60 mm) that regressed without ovulating. (C) Depicts a corpus luteum (CL) characterized by a heterogeneous, more echogenic, and solid-appearing internal texture compared to fluid-filled follicles. (D) Illustrates a large hemorrhagic anovulatory follicle (HAF) with a complex internal architecture containing multiple hyperechoic fibrous or echogenic bands and septations. (E) Shows an unstimulated atretic follicle; a white arrow highlights a distinctive ultrasound sign of atresia where the granulosa cell layer has separated or lifted from the follicle wall. These images provide diagnostic criteria for monitoring ovulation induction, distinguishing between functional luteal tissue and anovulatory structures.
The Ovarian Cycle
Overview of the Cycle: Two Phases
| Phase | Days (approx.) | Dominant hormone | Key event |
|---|---|---|---|
| Follicular phase | 1-13 | Estrogen (estradiol) | Follicle growth and maturation |
| Ovulation | Day 14 | LH surge | Oocyte released |
| Luteal phase | 15-28 | Progesterone + estrogen | Corpus luteum activity |
Hormonal Control: The Hypothalamic-Pituitary-Ovarian Axis
- GnRH (pulsatile) from the hypothalamus
- FSH and LH (glycoproteins, MW ~30,000) from the anterior pituitary
Phase 1: Follicular Phase (Days 1-13)
Follicle Recruitment
Follicle Development: The "Two-Cell, Two-Gonadotropin" Model
- Theca interna cells (LH-stimulated): synthesize androgens (androstenedione, testosterone)
- Granulosa cells (FSH-stimulated): express aromatase, converting androgens to estrone and 17β-estradiol
- Theca cells lack aromatase, so androgens must diffuse into granulosa cells to be converted. FSH stimulates aromatase activity.
Dominant Follicle Selection
- Stimulates endometrial proliferation (proliferative phase)
- Thins cervical mucus (sperm passage)
- Positively feeds back on anterior pituitary to trigger the LH surge
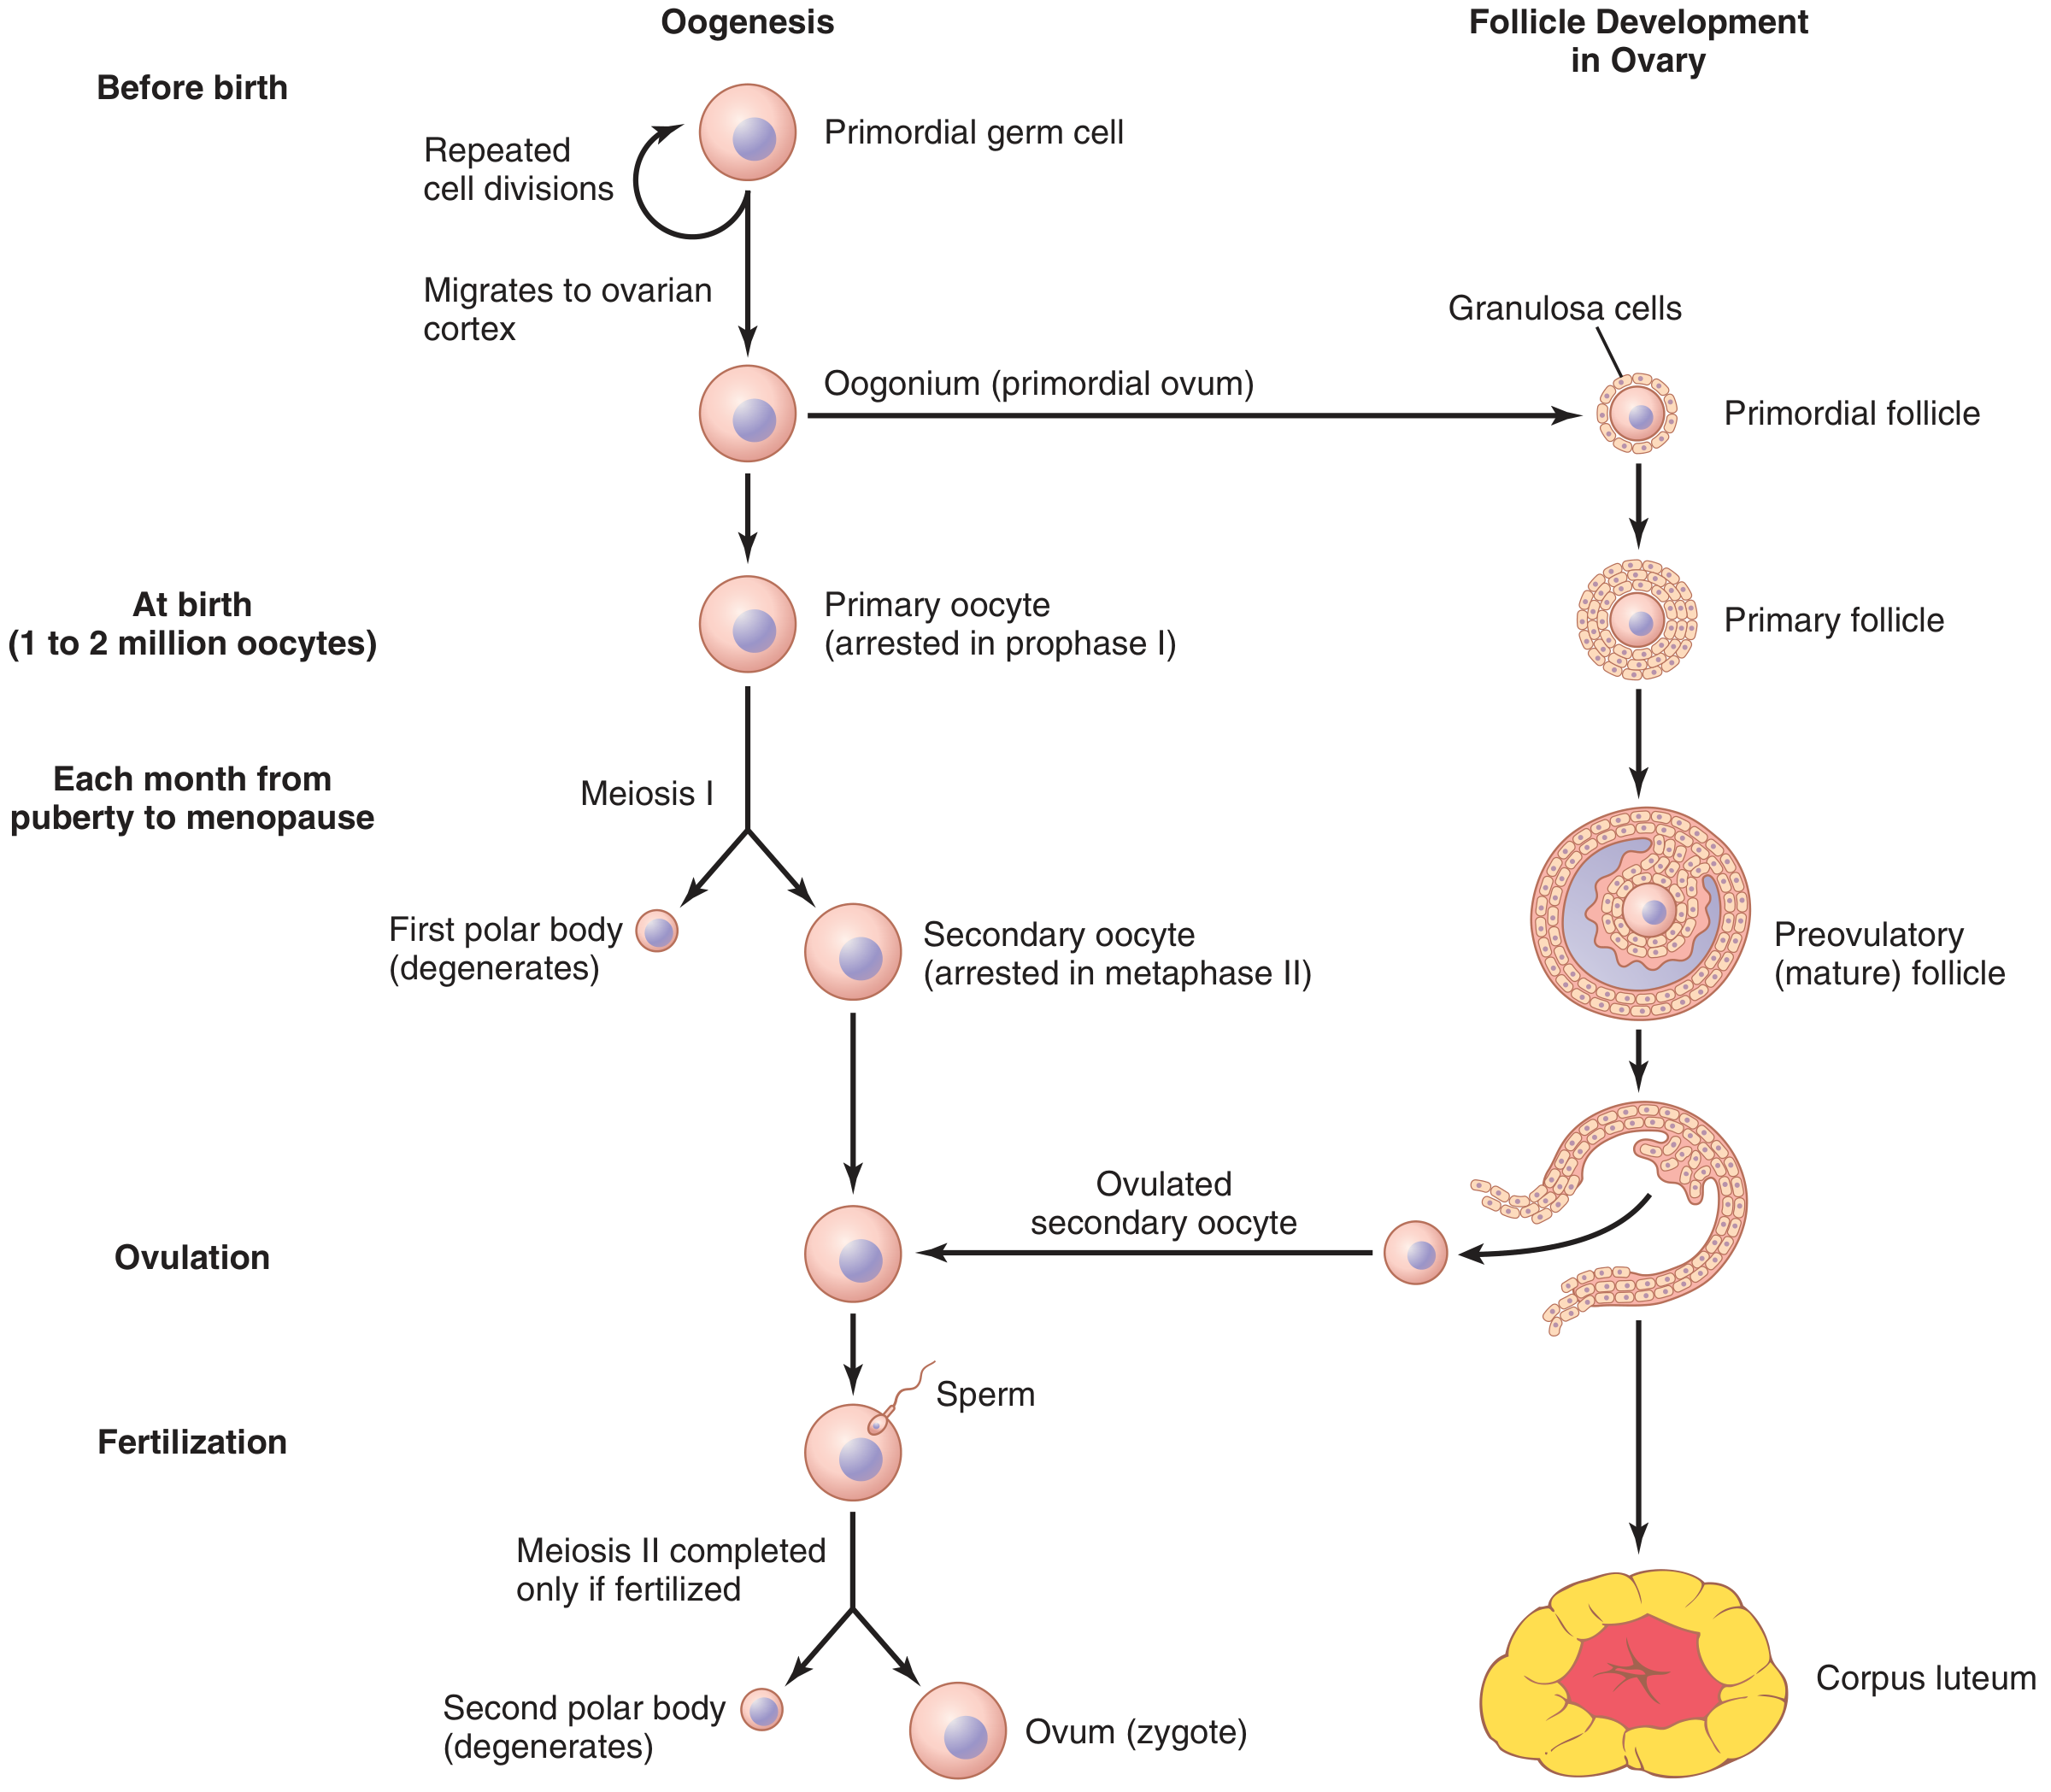
Ovulation (Day ~14)
- The primary oocyte to complete Meiosis I → secondary oocyte + first polar body
- Meiosis II is initiated, but arrested at metaphase II (~3 hours before ovulation)
- Luteinization of follicular stromal cells begins (progesterone production starts)
- Increased collagenase activity digests collagen surrounding the follicle
- Prostaglandin levels rise, causing muscular contractions in the ovarian wall
- An avascular spot (stigma) forms at the apex of the bulging follicle
- The follicle ruptures - the oocyte with surrounding cumulus oophorus cells floats free
- Cumulus cells rearrange to form the corona radiata around the zona pellucida
Phase 2: Luteal Phase (Days 15-28)
Corpus Luteum Formation
- Granulosa cells + theca interna cells proliferate and become vascularized (VEGF is essential for developing the blood supply)
- Cells accumulate yellowish lipid and lutein pigment, differentiating into lutein cells
- This structure = the corpus luteum, which secretes both progesterone (dominant) and estrogen
Actions of Corpus Luteum Hormones
- Progesterone: converts endometrium to secretory/progestational phase, preparing for implantation; also promotes breast lobular-alveolar development
- Estrogen + progesterone: together maintain the secretory endometrium
- Inhibin (also secreted): suppresses FSH from the anterior pituitary
Fate of the Corpus Luteum
- If no fertilization: Corpus luteum begins to degenerate ~Day 24 (4 days before next menses). By Day 26-28, involution is complete. The structure is replaced by fibrotic scar tissue = corpus albicans
- If pregnancy occurs: The trophoblast secretes hCG (human chorionic gonadotropin), which has LH-like activity and rescues the corpus luteum - it persists and continues secreting progesterone to maintain the pregnancy until the placenta takes over (~weeks 8-10)
Start of New Cycle
Summary Table
| Event | Day | Trigger |
|---|---|---|
| FSH/LH begin to rise | 1 | Fall in P4/E2/inhibin from previous corpus luteum |
| Follicle recruitment (15-20) | 1-5 | FSH |
| Dominant follicle selected | ~6 | Local estrogen environment |
| Estradiol peaks | ~12-13 | Growing Graafian follicle |
| LH surge | ~13-14 | Estradiol positive feedback |
| Ovulation | ~14 | LH surge |
| Corpus luteum forms | 14-15 | LH (luteinization) |
| Progesterone peaks | ~21 | Corpus luteum activity |
| Corpus luteum degenerates | ~24-26 | No hCG stimulus |
| Menstruation | 28/1 | Withdrawal of P4 + E2 |
Clinically Relevant Points
| Point | Detail |
|---|---|
| Anovulation | Low GnRH/FSH/LH - treated with clomiphene or gonadotropins (risk: multiple ovulation) |
| Fertile window | 5 days before + day of ovulation (sperm survive ~5 days) |
| Basal temperature | Rises ~0.5°C after ovulation (progesterone thermogenic effect) |
| Premature ovarian insufficiency | Loss of follicle pool before age 40 |
| Polycystic ovary syndrome (PCOS) | LH:FSH imbalance, excess androgens, anovulation, multiple arrested antral follicles |
| Luteal phase defect | Inadequate progesterone from corpus luteum - implantation failure |
- Guyton and Hall Textbook of Medical Physiology, Chapters 82-83 (Ovarian Cycle, Gonadotropins, Ovarian Hormones)
- Ganong's Review of Medical Physiology, 26th Ed., Chapter 22 (Ovarian Cycle, Estrogen/Progesterone)
- Langman's Medical Embryology, Chapter 3 (Ovarian Cycle, Ovulation, Corpus Luteum)
Menstrual cycle
menstrual cycle endometrial changes proliferative secretory menstruation phases diagram
A multi-panel pathophysiology diagram illustrating the synchronous physiological changes during a standard 28-day human menstrual cycle. The top panel graphs gonadotropin levels, showing a sharp surge in Luteinizing Hormone (LH) and a moderate rise in Follicle-Stimulating Hormone (FSH) at day 14, correlating with the follicular phase, ovulation, and luteal phase stages. The corresponding follicular development shows the maturation of a primary follicle into a Graafian follicle, ovulation, and the formation of the corpus luteum and corpus albicans. The middle panel tracks plasma sex hormone levels, highlighting the mid-cycle peak of Estradiol (E2) and the post-ovulatory rise of Progesterone (P4). The bottom panel depicts endometrial morphology, transitioning from the menstrual phase to the proliferative and secretory phases. A green-shaded layer highlights the glycocalyx development, which thickens and becomes most prominent during the secretory phase under the influence of P4, before thinning during menstruation. The diagram demonstrates the hormonal regulation of the ovary and uterine lining for medical educational purposes.
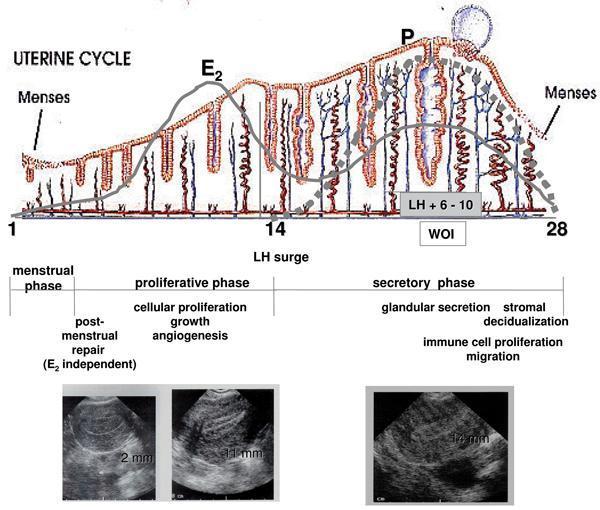
This composite educational graphic illustrates the morphological and hormonal changes of the human endometrium across a standard 28-day uterine cycle. The top section features a pathophysiology diagram showing fluctuations in estradiol (E2) and progesterone (P). E2 peaks during the proliferative phase, correlating with endometrial growth, while P dominates the secretory phase, driving glandular coiling and the 'window of implantation' (WOI). Below the hormone curves, a cross-sectional illustration depicts the histological evolution of endometrial glands and spiral arteries. It transitions from a thin, shedding layer in the menstrual phase to elongated glands during the proliferative phase, and finally to highly coiled, secretory glands with increased angiogenesis in the secretory phase. The bottom section displays three diagnostic ultrasound images of the uterus, providing clinical correlation of endometrial thickness: 2 mm (early proliferative), 11 mm (late proliferative), and 14 mm (mid-secretory). Key physiological processes such as post-menstrual repair, cellular proliferation, angiogenesis, and stromal decidualization are annotated to link hormonal signaling with macroscopic and microscopic changes.
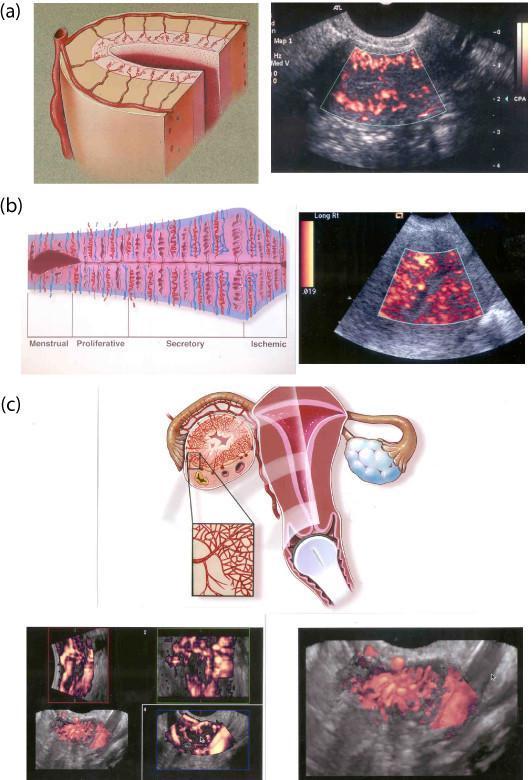
This composite educational resource compares 2D and 3D transvaginal color Doppler sonography (TV-CDS) for evaluating pelvic vascularity. (a) A cross-sectional anatomical diagram and 2D TV-CDS image highlight the uterine vascular hierarchy during the follicular phase, depicting arcuate, radial, and spiral vessels. (b) A timeline diagram illustrates endometrial vascular changes across the menstrual cycle phases: Menstrual, Proliferative, Secretory, and Ischemic. This is paired with a 2D TV-CDS showing the characteristic increase in spiral vessel density during the luteal phase. (c) The bottom section focuses on the corpus luteum, featuring a diagram of the female reproductive system with a magnified view of ovarian vascularization. Below this, multiplanar 3D TV-CDS images (longitudinal, axial, and coronal planes) and a high-definition 3D reconstruction demonstrate the pathognomonic vascular 'wreath'—a dense circumferential ring of blood vessels surrounding the functioning corpus luteum. This content illustrates key gynecological sonography concepts, including the cyclical nature of endometrial perfusion and the advanced spatial assessment afforded by 3D Doppler imaging for ovarian structures.
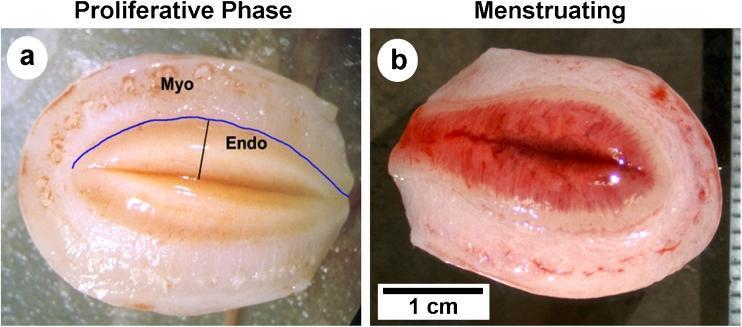
A side-by-side comparison of two macroscopic cross-sections of a rhesus macaque uterus, demonstrating physiological changes during the menstrual cycle. Image (a) represents the proliferative phase (day 14), showing a thickened endometrium (Endo) with a pale tan-to-pink hue. A clear blue line highlights the smooth, well-defined endometrial-myometrial border, with the underlying myometrium (Myo) clearly visible. Image (b) represents the second day of the menstrual phase, where the endometrium appears significantly thinner due to tissue sloughing and breakdown. In this phase, the upper third of the endometrium (functionalis zone) is visibly engorged with blood, exhibiting a deep red, hemorrhagic appearance, while the basalis layer remains intact. The endometrial-myometrial junction in the menstruating specimen is less distinct compared to the proliferative phase. A 1 cm scale bar is provided for reference. This comparison illustrates the cyclic changes in endometrial thickness, vascularity, and tissue integrity characteristic of menstruating primates.
The Menstrual Cycle
- Ovarian cycle: Follicular phase → Ovulation → Luteal phase
- Uterine (endometrial) cycle: Menstrual phase → Proliferative phase → Secretory phase → (Premenstrual phase)
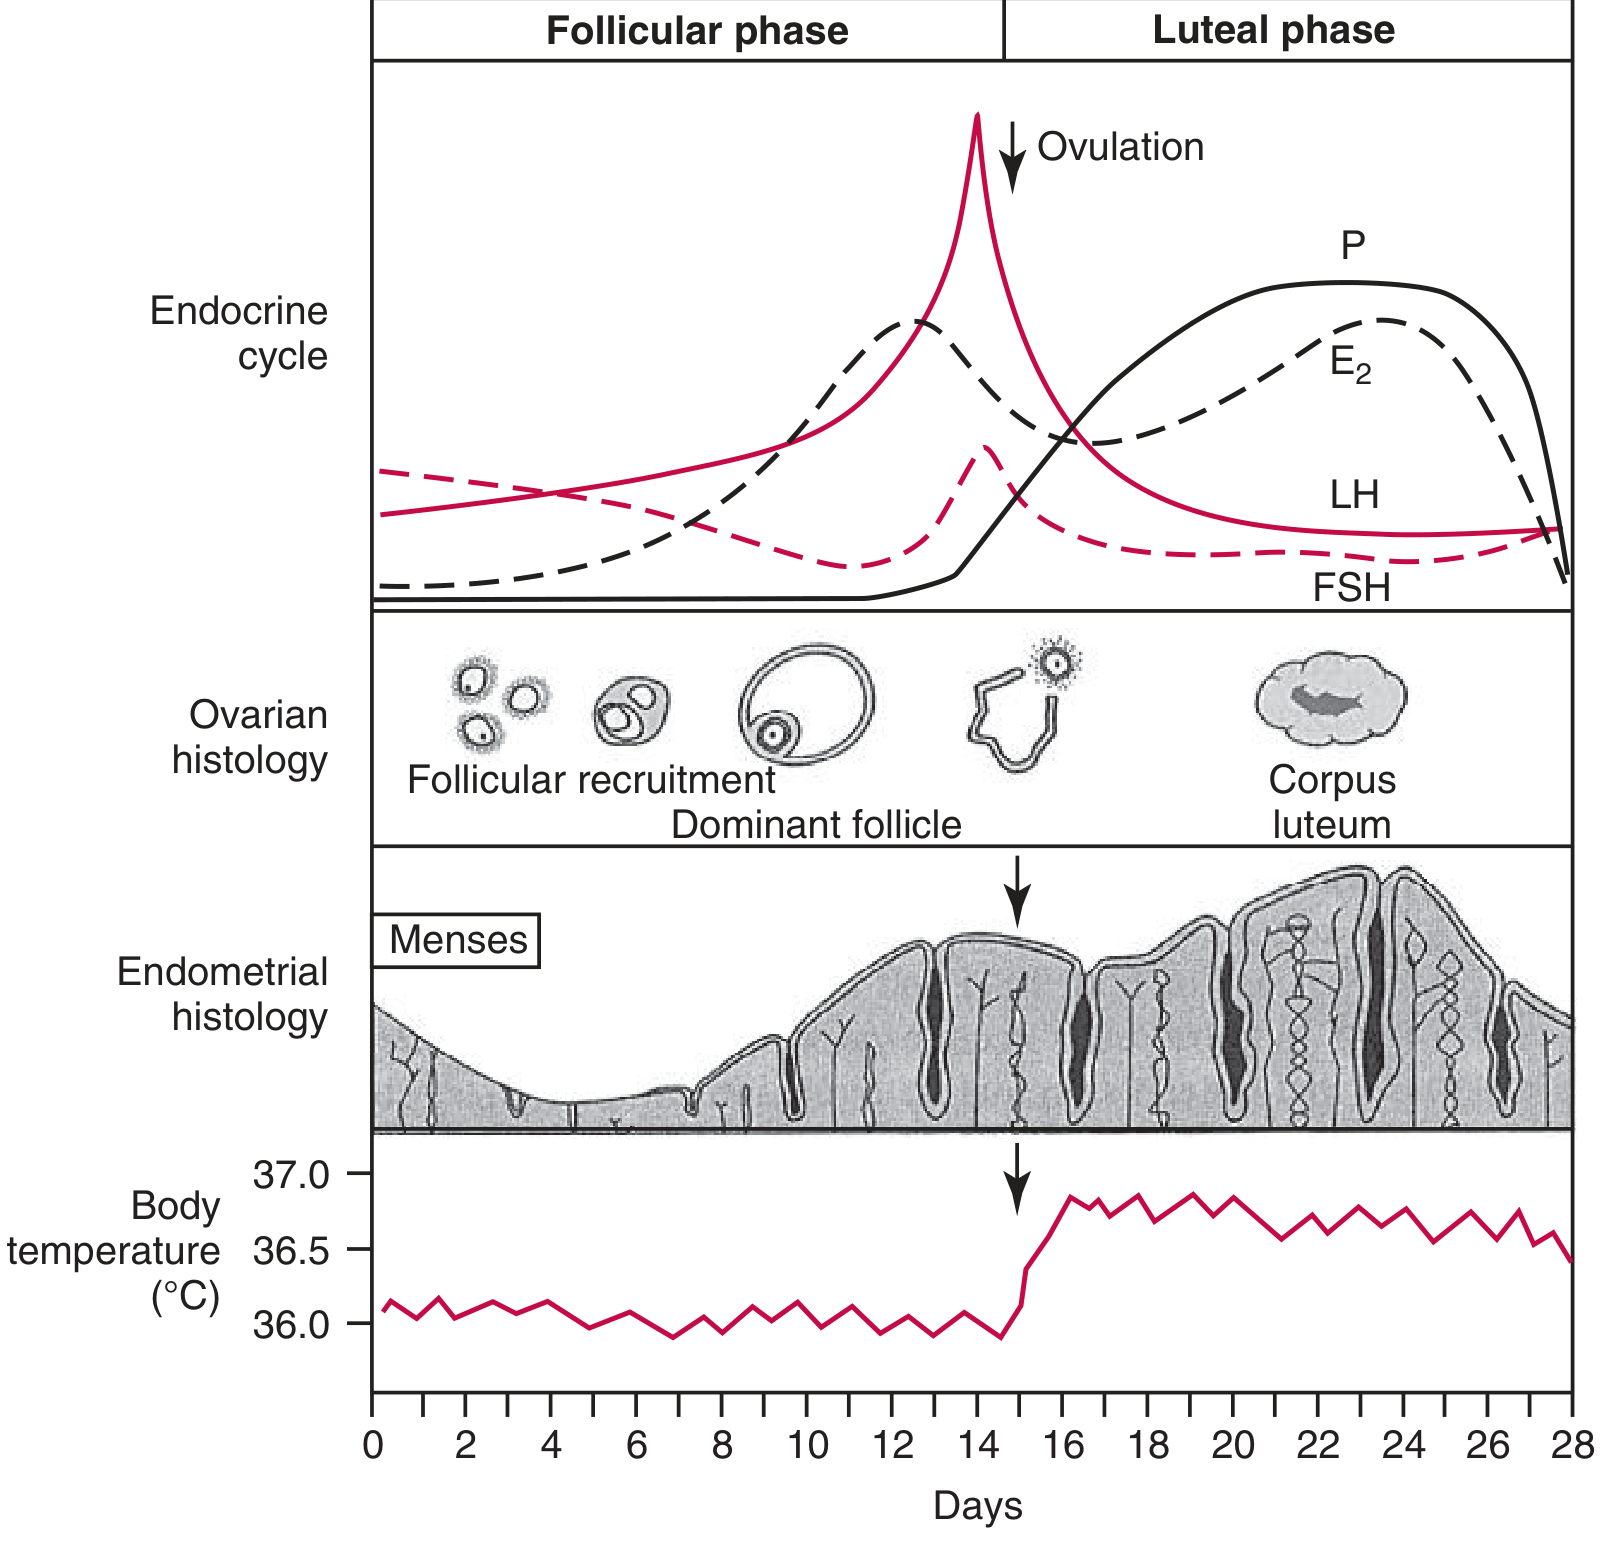
The Hormonal Framework
- Tonic negative feedback center (basal medial hypothalamus): activated by low E₂ and by progesterone + E₂ in the luteal phase
- Cyclic positive feedback center (anterior hypothalamus): triggered by the high pre-ovulatory E₂ surge, producing the LH surge
Phase 1: Menstrual Phase (Days 1-5)
- Progesterone withdrawal causes spiral artery vasoconstriction → ischemia of the endometrial functional layer
- Intermittent constriction and relaxation interrupts blood flow
- Local prostaglandin release amplifies vasoconstriction
- Hypoxic cells release cytokines → immigration of leukocytes → release of collagenase and matrix metalloproteinases (MMPs) → degrade basement membranes and ECM
- The functional layer (stratum functionalis) of the endometrium detaches and sloughs with blood from open venule ends = menstrual flow
- The basal layer (stratum basalis) is spared - it is supplied by straight (not spiral) arteries and is not progesterone-dependent; it serves as the regenerative reserve
- Duration: 2-6 days (average 4-5 days)
- Blood loss: 20-60 mL (average 30 mL)
- Discharge: degenerating endometrium + blood + prostaglandins
Phase 2: Proliferative Phase (Days 6-13) - "Follicular phase" of the uterus
- Epithelial cells from the broken gland bases proliferate, migrate, and re-cover the denuded surface
- Endometrial glands: short, straight tubules, narrow lumens, mitotically active
- Stroma: regenerates with mitotic activity in fibroblasts
- Spiral arteries lengthen; extensive microvasculature begins forming near the surface
- By end of phase: endometrium is 2-3 mm thick, glands elongated
- Becomes copious, watery, elastic (spinnbarkheit)
- On a glass slide: shows ferning pattern (arborization)
- Physical channels form allowing sperm penetration - maximally fertile
- FSH rises briefly at start (from corpus luteum demise of previous cycle), then falls as E₂ and inhibin B suppress it
- E₂ rises steadily; pre-ovulatory peak: 250-500 pg/mL
- LH is initially suppressed by negative feedback from E₂, then switches to positive feedback as E₂ peaks → LH surge
Ovulation (~Day 14)
- Completion of Meiosis I in the oocyte → secondary oocyte
- Follicle rupture and oocyte release
- Luteinization of granulosa/theca cells begins
Phase 3: Secretory Phase (Days 15-28) - "Luteal phase" of the uterus
- Proliferation of endometrium slows; overall thickness may decrease slightly then build
- Glands: become tortuous, coiled, wide-lumened; epithelial cells accumulate glycogen in subnuclear vacuoles (earliest histological sign, day 16-17), then secrete glycogen into lumen
- Stroma: becomes edematous; stromal cells begin decidualization (enlargement, accumulation of glycogen and lipid)
- Spiral arteries: elongate further and become tightly coiled
- Superficial microvasculature: develops thin-walled, blood-filled lacunae
- At peak (mid-secretory): endometrium reaches maximum thickness of 5-6 mm
- The "window of implantation" (WOI) is approximately LH+6 to LH+10 days - when endometrial receptivity is optimal
- Becomes thick, viscous, non-elastic
- Does not fern on a glass slide
- Impenetrable to sperm (the "fertile window" has closed)
- Rises ~0.5°C after ovulation due to the thermogenic effect of progesterone
- Remains elevated throughout the luteal phase
- Used retrospectively to confirm ovulation (the "rhythm method")
- Progesterone peaks ~8 days after ovulation (~Day 22); levels >3 ng/mL confirm ovulation
- E₂ dips briefly post-ovulation then rises again from corpus luteum → reaches ~125 pg/mL
- Inhibin A secreted by corpus luteum
- High P + E₂ → negative feedback → suppresses FSH and LH
Phase 4: Premenstrual Phase (Days 26-28)
- Spiral arteries constrict intermittently → focal hypoxia
- Glands begin to swell then dissolve
- Stroma compacts peripherally; becomes spongy near the basalis
- Apoptosis, blood stasis, and proteolytic matrix breakdown set the stage for menstruation
- Fall in Inhibin A and E₂ removes negative feedback → FSH begins to rise → new cohort of follicles is recruited for the next cycle
Complete Hormonal Timeline
| Day | FSH | LH | E₂ | Progesterone | Endometrium |
|---|---|---|---|---|---|
| 1-5 | Rising | Low | Low/falling | Low/falling | Menstruation |
| 5-13 | Falling | Low then rising | Rising | Low | Proliferative |
| 12-13 | Small surge | LH surge | Peak (~350 pg/mL) | Begins rising | Late proliferative |
| 14 | - | Post-surge | Falling | Low | Ovulation |
| 15-21 | Suppressed | Low | Mid-luteal rise | Rising | Early secretory |
| 21-23 | Suppressed | Low | ~125 pg/mL | Peak ~8-12 ng/mL | Mid-secretory (WOI) |
| 24-28 | Rising again | Low | Falling | Falling | Premenstrual → menses |
Endometrial Layers and Their Fate
| Layer | Arterial supply | Hormone-dependent | Fate in menstruation |
|---|---|---|---|
| Stratum functionalis (2/3 outer) | Spiral arteries | Yes (progesterone-sensitive) | Shed with each cycle |
| Stratum basalis (inner 1/3) | Straight (basal) arteries | No | Retained; regenerates the functional layer |
Changes Beyond the Uterus
| Target | Estrogen effects | Progesterone effects |
|---|---|---|
| Cervix | Thin, watery, fern-like mucus; open os | Thick, hostile mucus; closed |
| Vagina | Epithelial proliferation; superficial cells predominate | Intermediate cells predominate; drier |
| Breasts | Ductal growth; lobular development | Secretory activity in ducts; tenderness |
| Temperature | No significant effect | BBT rise of ~0.5°C |
| Myometrium | Increased contractility | Inhibits contractions (preserves potential implantation) |
Clinical Correlates
| Condition | Mechanism |
|---|---|
| Dysmenorrhea | Excess prostaglandins (PGF₂α, PGE₂) during menstruation → myometrial spasm |
| Amenorrhea | Primary (no menarche) or secondary (cessation); causes span hypothalamic-pituitary-ovarian axis |
| Oligomenorrhea | Cycles >35 days; often anovulatory |
| Anovulatory cycles | No LH surge → no corpus luteum → no progesterone → unopposed estrogen → endometrial hyperplasia risk |
| Endometriosis | Viable endometrial cells reflux through tubes → implant in pelvis; under cyclic hormonal control |
| Premenstrual syndrome (PMS/PMDD) | Sensitivity to normal luteal hormonal fluctuations |
| Luteal phase defect | Inadequate P secretion → poor secretory transformation → implantation failure |
| Abnormal uterine bleeding (AUB) | Classified by PALM-COEIN (structural vs. non-structural causes) |
- Berek & Novak's Gynecology - Chapter 7 (Menstrual Cycle Physiology, Hormonal Variations, Normal Menstrual Cycle)
- Tietz Textbook of Laboratory Medicine, 7th Ed. - Chapter 58 (Normal Menstrual Cycle, Hormonal Dynamics)
- Costanzo Physiology, 7th Ed. - Chapter on Reproductive Physiology (Proliferative and Secretory Phases)
- Junqueira's Basic Histology, 17th Ed. - Chapter 22 (Endometrial Histology Across the Menstrual Cycle)
-physiological changes in pregnancy -parturition or Ferguson reflex • physiology of lactation • benefits of breast feeding to mother and child • estrogen ( MOA, functions, applied aspect) • testosterone (MOA, findings and applied aspect) • infertility ( causes in men women, investigations, diagnostic procedures, and treatment )
pregnancy physiological changes cardiovascular respiratory uterus adaptation
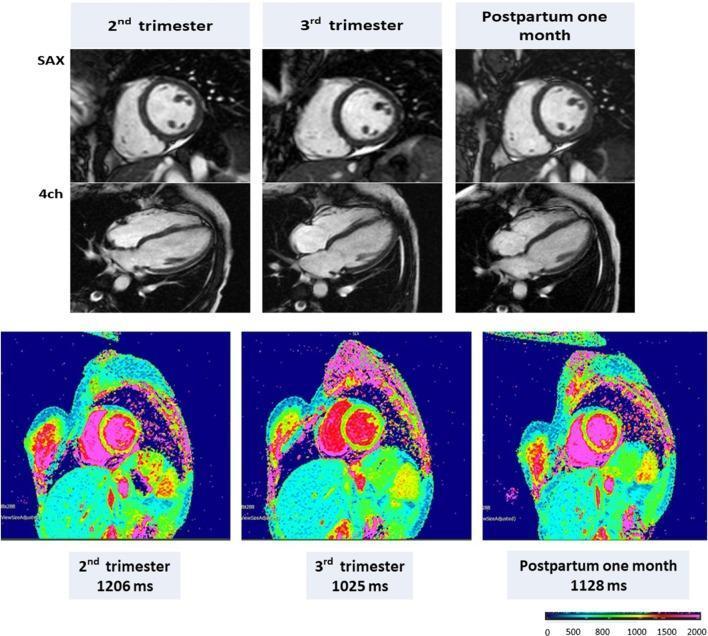
This cardiovascular magnetic resonance (CMR) comparison illustrates left ventricular (LV) remodeling and tissue characterization in a representative pregnant woman across three stages: 2nd trimester, 3rd trimester, and 1 month postpartum. The top rows feature structural cine images in short-axis (SAX) and four-chamber (4ch) views, demonstrating longitudinal changes in end-diastolic volume, ejection fraction, and LV mass. The bottom row presents native T1 mapping using the MOLLI (Modified Look-Locker Inversion recovery) sequence at 1.5 Tesla. These color-coded parametric maps represent myocardial T1 values, with a provided scale ranging from 0 to 2000 ms. Quantitatively, the native T1 values fluctuate from 1,206 ms in the 2nd trimester, decreasing to 1,025 ms in the 3rd trimester, and recovering to 1,128 ms postpartum. Visually, this is reflected in the shift from higher T1 areas (pink/yellow) to lower T1 regions (green/blue) and back. This visual comparison is educationally significant for understanding physiological cardiac adaptation during pregnancy and the role of non-contrast CMR in assessing myocardial tissue properties and peripartum cardiomyopathy (PPCM).
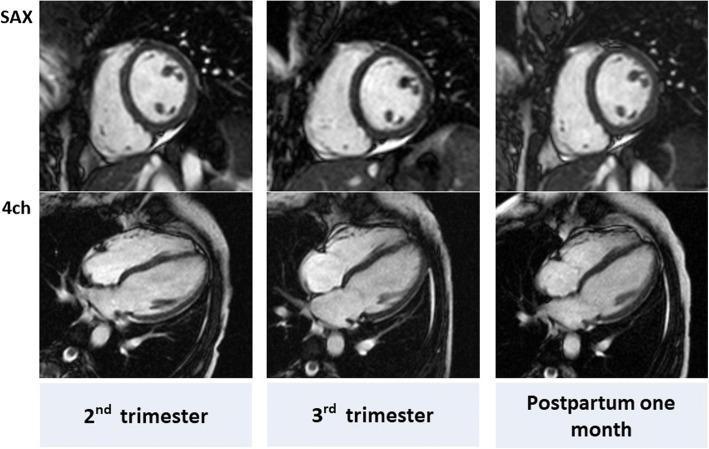
This diagnostic image displays a series of Cine Cardiovascular Magnetic Resonance (CMR) scans from a representative pregnant woman, organized to compare cardiac structure across three time points: 2nd trimester, 3rd trimester, and one month postpartum. The top row presents the short-axis (SAX) view at the mid-ventricular level, while the bottom row shows the horizontal long-axis (4-chamber) view. The images illustrate physiological cardiac remodeling during pregnancy. Key observations include a visible increase in left ventricular (LV) mass and end-diastolic volume during the 3rd trimester compared to the postpartum baseline. In the SAX view, the LV myocardium appears slightly thicker in the 3rd trimester, while the 4-chamber view demonstrates the maintenance of normal ventricular geometry and relationship between the LV and right ventricle (RV). These images serve as educational materials for understanding the reversible eccentric hypertrophy and volume expansion that characterize healthy maternal cardiovascular adaptation to pregnancy.
lactation breast milk let-down reflex prolactin oxytocin diagram
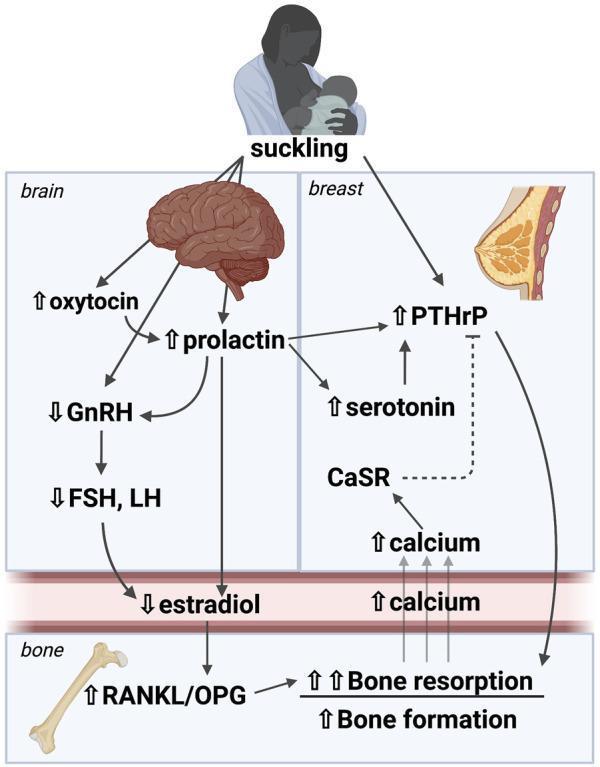
A pathophysiology diagram illustrating the brain-breast-bone axis and its regulation of mineral metabolism during lactation. The diagram begins with the 'suckling' stimulus, which triggers neural pathways to the brain and mammary gland. In the 'brain' section, suckling leads to increased levels of oxytocin and prolactin. Elevated prolactin inhibits Gonadotropic Releasing Hormone (GnRH), subsequently decreasing Follicle Stimulating Hormone (FSH) and Luteinizing Hormone (LH), which leads to reduced estradiol levels in the bloodstream. In the 'breast' section, suckling and prolactin increase Parathyroid Hormone-related Protein (PTHrP) and serotonin levels. The Calcium Sensing Receptor (CaSR) is shown providing negative feedback on PTHrP when mammary calcium levels are high. In the 'bone' section, the combined effect of low estradiol and high PTHrP increases the RANKL/OPG ratio, leading to stimulated bone resorption and bone formation (osteoclastic and osteocytic activity). This process liberates calcium into the circulation to be utilized by the mammary gland for milk production. The diagram effectively maps the hormonal cascade coordinating maternal skeletal turnover with neonatal nutritional demands.
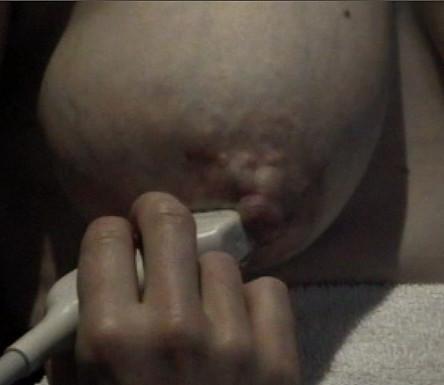
This clinical photograph displays a right lactating breast during the milk ejection reflex, alongside the application of a diagnostic ultrasound probe. The areola demonstrates significant physiological swelling and increased tension, resulting in a full, convex appearance. This visual change is indicative of the expansion of superficial milk ducts as oxytocin-induced myoepithelial contraction forces milk from the alveoli into the ductal system. A linear ultrasound transducer is positioned in direct contact with the inferior portion of the areola, stabilized by a hand to monitor ductal dilation and milk flow in real-time. The skin surface shows slight lobulation or prominence corresponding to the underlying distended ducts. This image illustrates the physical manifestations of the milk ejection reflex and the non-invasive clinical method of using ultrasound to study lactation physiology and breastfeeding dynamics.
infertility male female causes semen analysis IVF treatment
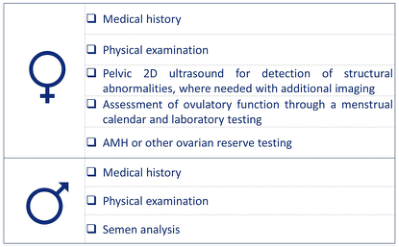
Summary : This figure presents the recommended initial clinical assessment steps for infertility in females and males, listing specific diagnostic procedures for each sex. flowchart: # Female Assessment : • Medical history • Physical examination • Pelvic 2D ultrasound for detection of structural abnormalities, with additional imaging if needed • Assessment of ovulatory function via menstrual calendar and laboratory testing • AMH (Anti-Müllerian Hormone) or other ovarian reserve testing # Male Assessment : • Medical history • Physical examination • Semen analysis # Symbols : • Female symbol (♀) for female assessment section • Male symbol (♂) for male assessment section Analysis : • The figure clearly separates the infertility assessment protocols for females and males, with more detailed and varied diagnostic steps for females, including imaging and hormonal testing, while the male assessment focuses on semen analysis after history and examination. This highlights the complexity and multi-factorial nature of female infertility evaluation compared to male.
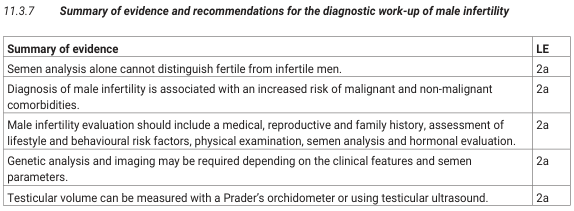
11.3.7 Summary of evidence and recommendations for the diagnostic work-up of male infertility <table><thead><tr><th>Summary of evidence</th><th>LE</th></tr></thead><tbody><tr><td>Semen analysis alone cannot distinguish fertile from infertile men.</td><td>2a</td></tr><tr><td>Diagnosis of male infertility is associated with an increased risk of malignant and non-malignant comorbidities.</td><td>2a</td></tr><tr><td>Male infertility evaluation should include a medical, reproductive and family history, assessment of lifestyle and behavioural risk factors, physical examination, semen analysis and hormonal evaluation.</td><td>2a</td></tr><tr><td>Genetic analysis and imaging may be required depending on the clinical features and semen parameters.</td><td>2a</td></tr><tr><td>Testicular volume can be measured with a Prader's orchidometer or using testicular ultrasound.</td><td>2a</td></tr></tbody></table>
estrogen receptor mechanism of action nuclear signaling
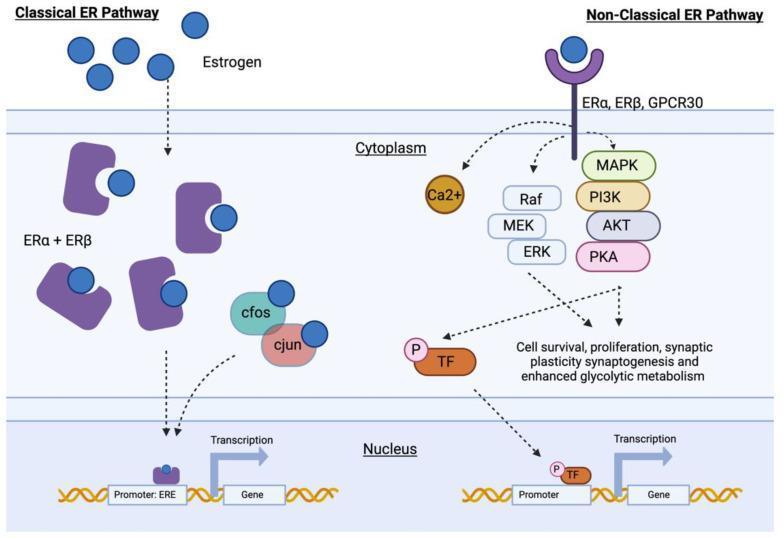
This pathophysiology diagram illustrates the dual mechanisms of estrogenic action: the classical and non-classical estrogen receptor (ER) pathways. The diagram is divided into extracellular space, cytoplasm, and nucleus. On the left, the 'Classical ER Pathway' depicts estrogen molecules entering the cell and binding to intracellular ERα and ERβ receptors. This ligand-receptor complex, alongside transcription factors c-fos and c-jun, translocates into the nucleus to bind with the Estrogen Response Element (ERE) in the gene promoter region, directly initiating transcription. On the right, the 'Non-Classical ER Pathway' shows estrogen binding to membrane-bound receptors (ERα, ERβ, or GPCR30). This interaction triggers rapid non-genomic signaling through calcium (Ca2+) mobilization and protein kinase cascades, specifically the Raf/MEK/ERK and MAPK/PI3K/AKT/PKA pathways. These cascades lead to the phosphorylation of transcription factors (TF) and secondary modulation of gene expression, facilitating outcomes such as cell survival, synaptogenesis, and enhanced metabolism. This diagram serves as a high-level educational resource for endocrinology and cellular biology, highlighting genomic versus rapid non-genomic signaling.
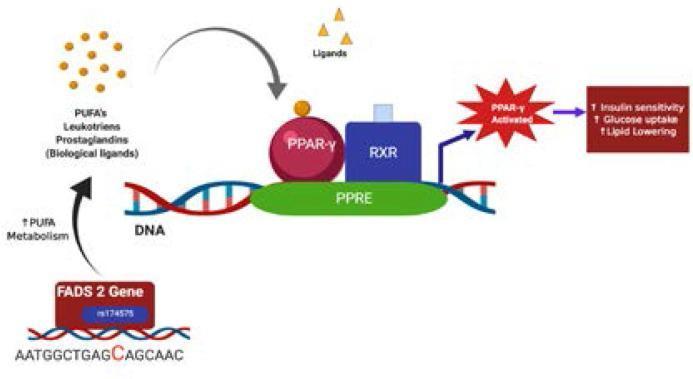
This pathophysiology diagram illustrates the suggestive molecular mechanism of action for the FADS2 gene variant rs174575 (CC homozygote) in relation to metabolic health. The diagram shows a DNA strand containing the FADS2 gene, which promotes increased Polyunsaturated Fatty Acid (PUFA) metabolism. This metabolic process yields biological ligands including PUFAs, leukotrienes, and prostaglandins. These biological ligands, along with other exogenous ligands, bind to and activate the Peroxisome Proliferator-Activated Receptor-gamma (PPAR-γ). The activated PPAR-γ forms a heterodimer with the Retinoid X Receptor (RXR), which then binds to the Peroxisome Proliferator Response Element (PPRE) on the DNA. This nuclear signaling pathway leads to specific physiological outcomes: increased insulin sensitivity, enhanced glucose uptake, and lipid lowering. The visual uses standard biochemical notation to represent the transcriptional regulation involved in lipid and glucose homeostasis, emphasizing the protective role of the wild-type FADS2 genotype against insulin resistance.
1. Physiological Changes in Pregnancy
Cardiovascular Changes
| Parameter | Change | Magnitude |
|---|---|---|
| Blood volume | Increases | +35% |
| Plasma volume | Increases (dilutional "anaemia of pregnancy") | +55% |
| Cardiac output | Increases | +40% |
| Stroke volume | Increases | +30% |
| Heart rate | Increases | +20% |
| Systolic BP | Slightly decreases | -5% |
| Diastolic BP | Decreases (peripheral vasodilation) | -15% |
| Peripheral resistance | Decreases | -15% |
| Pulmonary vascular resistance | Decreases | -30% |
- The disproportionate rise in plasma volume (55%) over red cell mass causes a fall in haematocrit - physiological anaemia of pregnancy
- CO rises further during uterine contractions in labor
- Supine hypotension syndrome: the gravid uterus compresses the inferior vena cava when lying supine → decreased venous return → hypotension (relieved by left lateral decubitus)
Respiratory Changes
| Parameter | Change |
|---|---|
| O₂ consumption | +20-50% |
| Minute ventilation | +50% |
| Tidal volume | +40% |
| Respiratory rate | +15% |
| FRC (functional residual capacity) | -20% (elevated diaphragm) |
| PaO₂ | +10% |
| PaCO₂ | -15% (compensated respiratory alkalosis) |
| HCO₃⁻ | -15% (renal compensation) |
| Airway resistance | -35% (progesterone relaxes bronchial smooth muscle) |
- Dyspnoea of pregnancy is common (normal) due to elevated progesterone stimulating the respiratory centre
- Reduced FRC means decreased oxygen reserve - rapid desaturation with apnoea
Renal Changes
- GFR increases by +50% (due to increased renal plasma flow)
- Creatinine and urea levels fall (lower-than-normal = "normal in pregnancy")
- Glycosuria may occur even with normal blood glucose (GFR exceeds tubular reabsorption capacity)
- Hydronephrosis of pregnancy: progesterone relaxes ureteric smooth muscle + uterine compression
Haematological Changes
- Haemoglobin falls ~20% (dilutional)
- Platelets fall slightly (~10%)
- Clotting factors rise +30-250% (hypercoagulable state - protects against haemorrhage at delivery but raises DVT/PE risk)
- WBC rises (leukocytosis, up to 15,000/μL)
Neurological Changes
- MAC (minimum alveolar concentration) for all inhalational anaesthetics decreases by up to 40% at term (progesterone is sedating; β-endorphin surge in labor also contributes)
- Enhanced sensitivity to local anaesthetics
Gastrointestinal Changes
- Progesterone relaxes lower oesophageal sphincter → GERD and heartburn
- Gastric emptying delayed → increased aspiration risk in anaesthesia
- Constipation (progesterone slows peristalsis; iron supplementation)
- Liver: alkaline phosphatase rises (placental origin), albumin falls
Endocrine/Metabolic Changes
- Insulin resistance increases in later pregnancy (hPL - human placental lactogen is the major culprit) → gestational diabetes risk
- Thyroid: TBG increases → total T3/T4 rise but free levels normal; hCG has weak TSH-like activity (first trimester)
- Relaxin (from corpus luteum and placenta): relaxes pelvic ligaments, softens cervix
Uterine Changes
- Uterus grows from ~50g to ~1 kg by term
- Progesterone maintains uterine quiescence (inhibits contractions, reduces gap junctions)
- Braxton Hicks contractions (irregular, painless) begin ~1 month before term
2. Parturition and the Ferguson Reflex
Mechanism of Parturition
The Fetal Contribution ("The fetus picks the time to be born")
- The fetal hypothalamic-pituitary-adrenal axis activates near term
- Fetal adrenal cortex secretes large amounts of cortisol
- Fetal hypothalamus also increases CRH secretion, supplemented by increased placental CRH
- This raises fetal ACTH → more cortisol → hastens maturation of the fetal lung (surfactant production)
The Estrogen/Progesterone Shift
- Fetal cortisol increases the estrogen:progesterone ratio in the mother
- Estrogen increases uterine excitability, increases gap junctions between myometrial cells, stimulates prostaglandin production, and up-regulates oxytocin receptors
- Progesterone previously maintained quiescence by inhibiting oxytocin action and reducing gap junctions - its relative fall removes this brake
Role of Prostaglandins (PGE₂ and PGF₂α)
- Increases intracellular Ca²⁺ in uterine smooth muscle → increases contractility
- Promotes gap junction formation between myometrial cells → coordinated, synchronous contractions
- Causes cervical ripening: softening, effacement (thinning), and early dilation
Role of Oxytocin
- Oxytocin receptors in the myometrium increase >100-fold during pregnancy, peaking at early labor (estrogen up-regulates receptors)
- Maternal blood oxytocin levels paradoxically do not rise significantly near term
- The marked receptor up-regulation enables the uterus to respond to normal plasma oxytocin concentrations
- Locally produced oxytocin (uterine mRNA increases at term) also participates
- Oxytocin acts by: (1) directly contracting uterine smooth muscle cells and (2) stimulating prostaglandin formation in the decidua, which enhances contractions
The Ferguson Reflex (Positive Feedback Loop)
Uterine contractions → Cervical dilation and vaginal distension → Afferent neural signals to hypothalamus/posterior pituitary → Increased oxytocin secretion → More uterine contractions → More cervical dilation → More oxytocin...
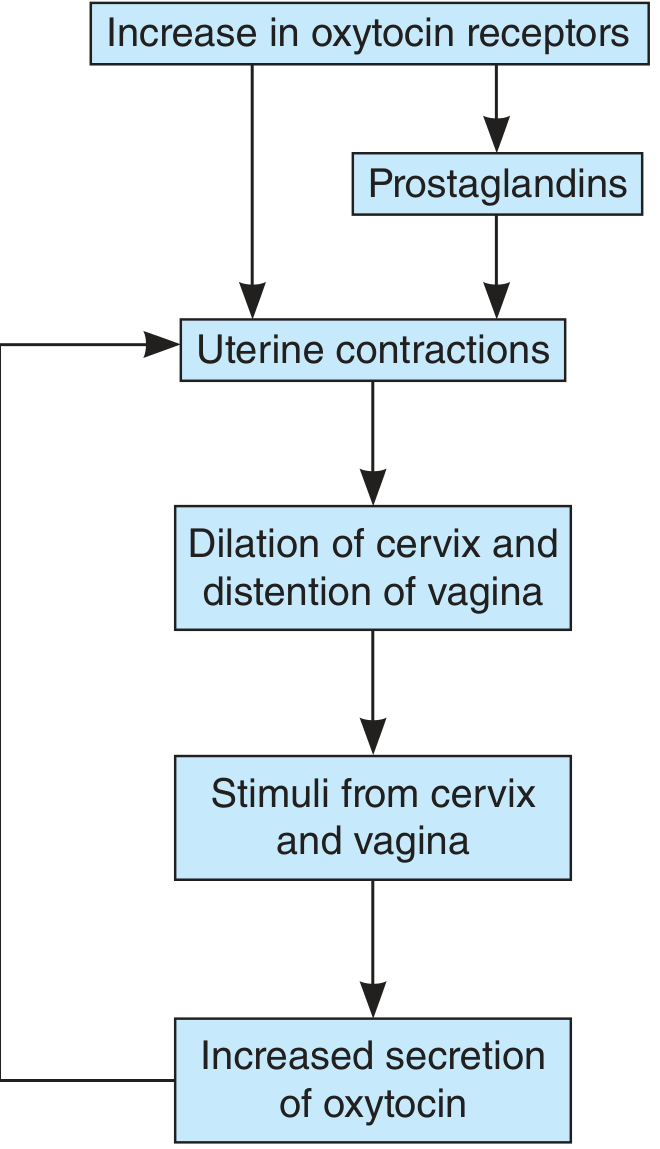
Three Stages of Labor
- First stage: Contractions from fundus sweeping downward move the fetal head toward the cervix; progressive cervical effacement and dilation (0→10 cm)
- Second stage: Fetus forced through the cervix and delivered vaginally (voluntary "bearing down" also helps)
- Third stage: Placenta separates and is delivered; powerful uterine contractions constrict uterine blood vessels → limits postpartum haemorrhage
3. Physiology of Lactation
Breast Development During Pregnancy
- Estrogens stimulate proliferation of the ductile system and stromal tissues
- Progesterone develops the lobulo-alveolar system
- Prolactin levels rise steadily throughout pregnancy (stimulated by estrogen)
- Despite high prolactin levels, lactation does NOT occur during pregnancy because estrogen and progesterone block prolactin's action on the breast ("lactation inhibition")
Initiation of Lactation Post-Delivery
- At delivery, estrogen and progesterone levels fall precipitously → their inhibitory block on the breast is removed
- Prolactin levels remain high (especially if breastfeeding)
- Lactation can now proceed
- The first secretion is colostrum - protein-rich, high in immunoglobulins (IgA), low in fat and lactose; important for passive immunity
| Component | Colostrum | Mature Human Milk | Cow's Milk |
|---|---|---|---|
| Protein | 2.7g (high) | 1.2g | 3.3g |
| Lactose | 5.3g | 6.8g | 5.0g |
| Fat | 2.9g | 3.8g | 3.7g |
| Casein:whey | - | 1:2 | 3:1 |
| IgA | Very high | Present | Very low |
Maintenance of Lactation: The Suckling Reflex
- Suckling stimulates nipple mechanoreceptors → afferent neural signals to hypothalamus → inhibits dopamine (prolactin-inhibiting factor) release → anterior pituitary releases prolactin
- Prolactin acts on alveolar epithelial cells (lactocytes) to stimulate milk synthesis (casein, lactalbumin, lactose, lipids)
- Suckling + nipple stimulation → hypothalamus → posterior pituitary releases oxytocin
- Oxytocin causes contraction of myoepithelial cells surrounding alveoli → milk ejected into ducts → delivered through nipple
- Conditioned reflex: even the sound of a baby crying can trigger oxytocin release and milk let-down
Lactation-Induced Amenorrhoea
- High prolactin inhibits GnRH secretion from the hypothalamus
- This suppresses FSH and LH → anovulation and amenorrhoea during lactation
- Acts as natural (but not 100% reliable) contraception
4. Benefits of Breastfeeding
Benefits to the Child
| Benefit | Mechanism |
|---|---|
| Passive immunity | sIgA, lactoferrin, lysozyme, macrophages in milk protect against gut/respiratory infections |
| Optimal nutrition | Correct protein:fat:carbohydrate ratio, DHA for brain development |
| Reduced SIDS risk | Protective mechanism unclear but well-documented |
| Reduced allergy/asthma | Early immune modulation |
| Reduced obesity/type 2 DM risk | Leptin in milk; metabolic programming |
| Reduced necrotising enterocolitis | Especially in premature infants |
| Better cognitive development | DHA, arachidonic acid for neural myelination |
| Dental benefits | Jaw development with suckling |
Benefits to the Mother
| Benefit | Mechanism |
|---|---|
| Uterine involution | Oxytocin released with suckling contracts the uterus back to pre-pregnancy size; reduces postpartum haemorrhage |
| Lactational amenorrhoea | Natural contraception/child spacing |
| Reduced breast cancer risk | Long-term, cumulative; related to suppression of ovulation and direct mammary effects |
| Reduced ovarian cancer risk | Hormonal suppression |
| Reduced type 2 DM risk | Enhanced glucose metabolism during lactation |
| Bone: net neutral/positive | Although calcium is mobilised during lactation, bone density recovers fully after weaning |
| Weight loss | ~500 kcal/day expended in milk production |
| Psychological bonding | Oxytocin promotes maternal-infant attachment |
5. Estrogen - MOA, Functions, and Applied Aspects
Synthesis
- Source: granulosa cells of ovarian follicles (primary), corpus luteum, placenta, adrenal cortex (minor), adipose tissue (peripheral aromatization)
- Substrate: cholesterol → androgens (from theca cells) → aromatized to estrogens by granulosa cells
- Three major estrogens (in order of potency): 17β-estradiol (E₂) > estrone (E₁) > estriol (E₃)
- β-Estradiol is 12× more potent than estrone and 80× more potent than estriol
- Transport: bound to plasma albumin and sex hormone-binding globulin (SHBG)
- Metabolism: liver conjugates to glucuronides and sulfates → excreted in urine and bile; liver converts E₂/E₁ → estriol (inactive)
Mechanism of Action (MOA)
- Estrogen (lipid-soluble) diffuses across cell membrane
- Binds intracellular ERα and ERβ receptors (nuclear receptor superfamily)
- Estrogen-ER complex dimerizes, translocates to nucleus
- Binds to Estrogen Response Elements (EREs) in the promoter regions of target genes (with co-activators c-fos, c-jun)
- Activates gene transcription → new mRNA → protein synthesis
- Effects take hours to days (slow, sustained)
- Estrogen binds to membrane-bound receptors (ERα, ERβ, or GPCR30/GPR30)
- Rapid intracellular signalling cascades: Ca²⁺ mobilization, Raf/MEK/ERK, MAPK, PI3K/AKT/PKA
- Phosphorylation of transcription factors (indirect gene effects)
- Effects occur in seconds to minutes (rapid, non-genomic)
- Mediates cell survival, proliferation, synaptic plasticity, enhanced glycolytic metabolism
Functions of Estrogen
- Uterus: proliferation of endometrium; increased size 2-3× at puberty
- Vagina: cuboidal → stratified epithelium (more resistant to infection)
- Fallopian tubes: proliferation of glandular epithelium; increases ciliary number and beat frequency (propels ovum toward uterus)
- Cervix: thin, watery, fern-patterned mucus; sperm penetration facilitated
- Stromal growth, ductal proliferation, fat deposition
- External shape of mature breast
- (Progesterone + Prolactin complete lobulo-alveolar development and milk production)
- Inhibits osteoclastic activity (stimulates osteoprotegerin/OPG)
- Promotes bone growth at puberty
- Causes epiphyseal fusion (earlier than in males → females stop growing earlier)
- Protects against osteoporosis during reproductive years
- Slightly increases protein deposition (much less than testosterone)
- Increases body fat in breasts, buttocks, thighs (female fat distribution)
- Increases whole-body metabolic rate (~1/3 that of testosterone)
- Na⁺ and water retention (aldosterone-like effect; contributes to oedema in pregnancy)
- Increases vascular tone - vasodilatory (increases skin warmth, flushing)
- CVS: increases HDL, decreases LDL (cardioprotective in pre-menopausal women)
- Stimulates prolactin secretion from anterior pituitary
Applied Aspects
| Condition | Relevance |
|---|---|
| Menopause / estrogen deficiency | Osteoporosis, vaginal atrophy, hot flashes, cardiovascular risk increase, dyspareunia |
| Hormone replacement therapy (HRT) | Prevents osteoporosis and menopausal symptoms; must weigh risk of DVT, breast cancer, endometrial cancer |
| Breast cancer (~35%) | Estrogen-dependent tumors; treatment: oophorectomy, tamoxifen (ERα/β antagonist), aromatase inhibitors (letrozole, anastrozole) |
| Endometrial cancer | Unopposed estrogen (anovulation, HRT without progestogen) → hyperplasia → carcinoma |
| Gynecomastia | Increased E:androgen ratio from liver disease, drugs, tumors, obesity |
| Oral contraceptives | Exogenous estrogen (+ progesterone) suppresses FSH/LH via negative feedback → prevents ovulation; also thickens cervical mucus |
| Liver disease | Impaired estrogen degradation → hyperestrinism → gynecomastia, spider naevi, palmar erythema |
| PCOS | Relative estrogen excess from chronic anovulation; increased endometrial risk |
| Selective ERMs (SERMs) | Tamoxifen: agonist on bone/uterus, antagonist on breast; Raloxifene: agonist on bone, antagonist on breast and uterus |
6. Testosterone - MOA, Findings, and Applied Aspects
Synthesis
- Leydig cells of testes are the primary source (~95% in males)
- Precursor: cholesterol (from LDL uptake or de novo synthesis)
- Rate-limiting step: P-450scc (20,22-desmolase) converts cholesterol → pregnenolone (requires StAR protein for mitochondrial transport)
- Pathway: Cholesterol → Pregnenolone → 17α-OH-pregnenolone → DHEA → Androstenediol → Testosterone (preferred delta-5 pathway in Leydig cells)
- LH stimulates Leydig cell testosterone production via cAMP/PKA
- Normal male plasma level: ~400-700 ng/dL; relatively constant from ages 25-70 years
- Transport: bound to SHBG (44%), albumin (54%), free (2%)
Mechanism of Action
- Testosterone enters target cell
- In some tissues (prostate, skin, seminal vesicles, epididymis): 5α-reductase converts testosterone → DHT (dihydrotestosterone) - DHT has ~30-50× higher biological activity than testosterone
- DHT binds androgen receptor (AR) with ~100× higher affinity than testosterone
- Testosterone or DHT-AR complex translocates to nucleus
- Binds to androgen response elements (AREs) in promoter regions
- Gene transcription → protein synthesis → specific cell functions (growth, development)
- Whether a tissue responds to testosterone or DHT depends on whether it expresses 5α-reductase
- Some tissues (brain, adipose) express aromatase → convert testosterone → estradiol (effects via ER, not AR)
- Some effects may be non-genomic (via adenylyl cyclase/PKA system)
Functions of Testosterone (Findings)
- Virilization of the male external genitalia (via DHT)
- Development of Wolffian ducts (vas deferens, seminal vesicles, epididymis)
- Descent of testes
- Enlargement of testes, penis, prostate, seminal vesicles
- Development of secondary sex characteristics: pubic/axillary/facial/body hair, male-pattern baldness (DHT)
- Sebaceous gland stimulation (acne)
- Deepening of voice (laryngeal growth)
- Pubertal growth spurt (testosterone is converted to E₂ which causes epiphyseal fusion - later than in females)
- Libido and sexual behaviour
- Spermatogenesis: works with FSH on Sertoli cells; high intratesticular concentration required
- Protein anabolism: marked muscle mass increase (much greater than estrogen)
- Erythropoiesis: increases RBC production via EPO stimulation → higher Hb in males
- Bone density: increases mineral density; closes epiphyses (weaker effect than E₂)
- Inhibin (from Sertoli cells) and testosterone feed back negatively to suppress FSH and LH
Applied Aspects
| Condition | Mechanism/Relevance |
|---|---|
| Hypogonadism | Primary (testicular failure → high LH/FSH) or secondary (pituitary/hypothalamic → low LH/FSH); treated with testosterone replacement |
| Benign prostatic hyperplasia (BPH) | DHT-driven; treated with 5α-reductase inhibitors (finasteride, dutasteride) |
| Prostate cancer | Androgen-dependent; treated with androgen deprivation therapy (GnRH agonists → desensitization; flutamide - pure AR antagonist that blocks nuclear binding) |
| 5α-reductase deficiency | Autosomal recessive; 46,XY individuals born with female/ambiguous external genitalia but masculinize at puberty (testosterone itself virilizes internal structures) |
| Androgen insensitivity syndrome (AIS) | AR mutation; 46,XY with female phenotype; no AR response despite high testosterone |
| Anabolic steroid abuse | Suppresses GnRH/LH/FSH → testicular atrophy, azoospermia, gynaecomastia (aromatization), hepatotoxicity, polycythaemia, dyslipidaemia |
| Ageing male | Testosterone declines gradually after age 40-50 ("andropause"); symptoms include decreased libido, fatigue, reduced muscle mass, osteoporosis |
| Testosterone aging paradox | Plasma levels constant 25-70y, then slow decline; production rate and clearance rate both change |
7. Infertility
Causes in Males
- Hypogonadotropic hypogonadism (low GnRH, LH, FSH) - Kallmann syndrome, pituitary tumours, hyperprolactinaemia
- Exogenous androgen/anabolic steroid use (suppresses LH/FSH)
- Varicocele (most common correctable cause - ~35% of infertile men)
- Cryptorchidism (undescended testes - impairs spermatogenesis due to higher temperature)
- Klinefelter syndrome (47,XXY) - hypergonadotropic hypogonadism
- Orchitis (mumps, TB)
- Chemotherapy/radiation
- Genetic: Y-chromosome microdeletions (AZF regions), CFTR mutations
- Obstructive azoospermia: vasectomy, congenital bilateral absence of vas deferens (CBAVD - associated with CFTR mutation), infection-related block
- Ejaculatory dysfunction: retrograde ejaculation (diabetes, prostate surgery)
- Sperm function disorders: antibodies, poor motility, morphology defects
Causes in Females
- PCOS (most common - anovulation from LH/FSH imbalance, hyperandrogenism)
- Hyperprolactinaemia (inhibits GnRH → anovulation)
- Hypothalamic amenorrhoea (excess exercise, low body weight, stress)
- Premature ovarian insufficiency/failure
- Thyroid disorders (hypothyroidism → elevated TRH → elevated prolactin)
- Tubal occlusion from PID (Chlamydia, gonorrhoea most common)
- Endometriosis (adhesions, impaired tubal motility, folliculogenesis)
- Previous ectopic pregnancy/surgical damage
- Fibroids (submucous - distort cavity)
- Asherman's syndrome (intrauterine adhesions post-curettage)
- Congenital uterine anomalies (septate uterus)
- Polyps
- Antisperm antibodies
- Defective cervical mucus
- Cervical stenosis
Investigations
Male Investigations
| Parameter | Lower Reference Limit |
|---|---|
| Volume | ≥1.4 mL |
| Total sperm count | ≥39 million/ejaculate |
| Concentration | ≥16 million/mL |
| Total motility | ≥42% |
| Progressive motility | ≥30% |
| Normal morphology (Kruger strict) | ≥4% |
| Vitality | ≥54% |
- Hormonal profile: FSH, LH, testosterone, prolactin, thyroid function
- Karyotype (if azoospermia/severe oligospermia)
- Y-chromosome microdeletion analysis
- Testicular ultrasound (varicocele, volume assessment with Prader orchidometer)
- CFTR gene analysis (if CBAVD)
- Testicular biopsy: obstructive vs. non-obstructive azoospermia
Female Investigations
- Menstrual calendar (regular cycles suggest ovulation)
- Mid-luteal serum progesterone (Day 21): >3-5 ng/mL suggests ovulation
- LH urine kits (detect LH surge)
- Anti-Müllerian hormone (AMH): reflects ovarian reserve (antral follicle count)
- FSH, LH (Day 2-3), estradiol: elevated FSH = reduced ovarian reserve
- Prolactin, TSH, androgens (if PCOS suspected)
- Pelvic 2D transvaginal ultrasound (TVS): antral follicle count, uterine anomalies, fibroids, ovarian cysts
- Hysterosalpingography (HSG): tubal patency, uterine cavity shape (gold standard for outpatient tubal assessment)
- Hysterosonography/Saline infusion sonography (SIS): uterine cavity evaluation
- Laparoscopy + chromopertubation (gold standard for tubal and peritoneal factor - direct visualization with dye injection through cervix)
- Hysteroscopy: intrauterine pathology (polyps, septa, adhesions)
- MRI pelvis: detailed uterine/ovarian anatomy
Diagnostic Procedures Summary
| Investigation | What it assesses |
|---|---|
| Semen analysis | Sperm count, motility, morphology |
| Mid-luteal P4 | Confirms ovulation |
| AMH | Ovarian reserve |
| Day-3 FSH/LH/E₂ | Pituitary and ovarian reserve |
| HSG | Tubal patency + uterine cavity |
| TVS | Pelvis, follicles, endometrium |
| Laparoscopy | Endometriosis, adhesions, tubal disease |
| Karyotype | Chromosomal causes |
| Testicular biopsy | Obstructive vs. non-obstructive azoospermia |
Treatment
Male Infertility
| Cause | Treatment |
|---|---|
| Hypogonadotropic hypogonadism | GnRH pump or gonadotropin (hCG + FSH) injections |
| Varicocele | Varicocelectomy (surgical or radiological embolization) |
| Obstructive azoospermia | Surgical sperm retrieval (PESA, TESA, TESE) + ICSI |
| Non-obstructive azoospermia | Micro-TESE + ICSI |
| Retrograde ejaculation | Alkalinization of urine + sperm retrieval, or sympathomimetics |
| Hyperprolactinaemia | Dopamine agonists (cabergoline, bromocriptine) |
| Antisperm antibodies | IUI or IVF/ICSI |
Female Infertility
| Cause | Treatment |
|---|---|
| Anovulation (PCOS) | Lifestyle modification (weight loss), clomiphene citrate (SERM - blocks E receptor, increases FSH), letrozole (aromatase inhibitor - now preferred first-line), gonadotropin injections, laparoscopic ovarian drilling |
| Hyperprolactinaemia | Cabergoline/bromocriptine |
| Hypothyroidism | Levothyroxine |
| Premature ovarian failure | Donor oocyte IVF |
| Tubal factor | Laparoscopic salpingostomy/fimbrioplasty; IVF (bypass tubes) |
| Endometriosis | Laparoscopic excision/ablation; IVF for severe cases |
| Uterine fibroids | Myomectomy (submucous) |
| Asherman's syndrome | Hysteroscopic adhesiolysis |
| Cervical factor | IUI (bypasses cervix) |
Assisted Reproductive Technologies (ART)
| Technique | Indication |
|---|---|
| IUI (Intrauterine insemination) | Mild male factor, cervical factor, unexplained |
| IVF (In vitro fertilisation) | Tubal disease, endometriosis, unexplained after failed simpler tx |
| ICSI (Intracytoplasmic sperm injection) | Severe male factor, obstructive/non-obstructive azoospermia |
| GIFT/ZIFT | Rarely used now |
| Donor oocyte IVF | Premature ovarian failure, poor ovarian reserve |
| Surrogacy | Absent uterus, recurrent implantation failure |
| Preimplantation genetic testing (PGT) | Recurrent miscarriage, chromosomal/monogenic disorders |
- Morgan & Mikhail's Clinical Anesthesiology, 7th Ed. - Physiological changes in pregnancy (Table 40-1)
- Costanzo Physiology, 7th Ed. - Parturition, Lactation, Hormonal contraception
- Ganong's Review of Medical Physiology, 26th Ed. - Parturition, Lactation, Gynecomastia, Hormones and Cancer
- Guyton & Hall Textbook of Medical Physiology - Estrogen functions, Progesterone, Ovarian hormones
- Medical Physiology (Boron & Boulpaep) - Testosterone synthesis, Androgen receptor MOA, DHT, 5α-reductase, Intracrine control
- Berek & Novak's Gynecology - Menstrual cycle physiology, Infertility diagnostic framework
Foeto placental maternal unit Explain
fetoplacental unit steroid hormone synthesis estriol DHEA fetus placenta mother diagram
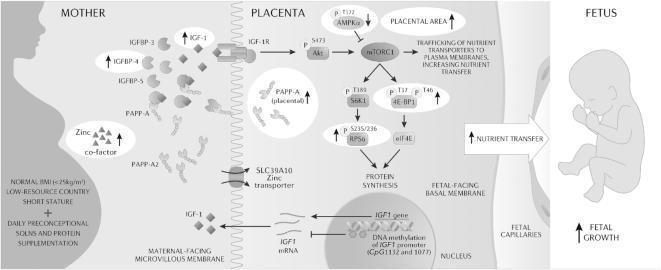
A pathophysiology diagram illustrating the integrative model of IGF-1 and mTOR signaling pathways in the maternal-placental-fetal unit. The visual is divided into three sections: Mother, Placenta, and Fetus. In the maternal circulation, increased levels of IGF-1, IGFBP-4, and Zinc (co-factor) are shown, alongside IGFBP-3, IGFBP-5, PAPP-A, and PAPP-A2. Within the placenta, IGF-1 interacts with the IGF-1 receptor (IGF-1R), triggering a signaling cascade through Akt (p-S473) to mTORC1. This pathway is regulated by AMPK-alpha (inhibited) and leads to the activation of S6K1, rpS6, and 4E-BP1, promoting protein synthesis. Placental PAPP-A is elevated, while nuclear activity shows DNA methylation of the IGF1 promoter affecting mRNA expression. The diagram illustrates that these molecular shifts increase placental area and nutrient transfer across the fetal-facing basal membrane into fetal capillaries. The cumulative effect, driven by preconceptional maternal supplementation (SQLNS), is indicated as enhanced fetal growth. The model specifically targets mechanisms in low-resource settings related to maternal nutritional status and fetal stunting.
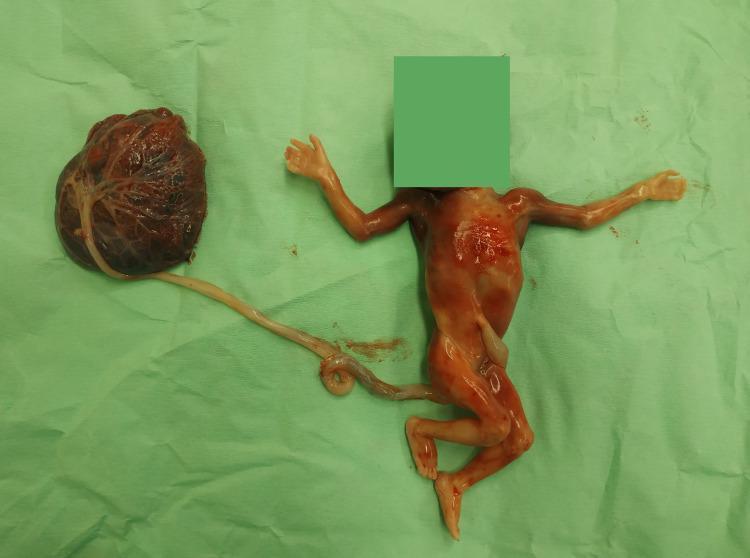
This clinical photograph displays a gross pathological specimen of an intact fetoplacental unit following a first-trimester pregnancy loss or termination at approximately 13-14 weeks of gestation. The specimen is laid out on a green surgical drape. The placenta is a discoid, dark red-to-brown vascular mass with a visible chorionic plate and branching vessels. The umbilical cord is long, pale, and yellowish-white, showing characteristic twisting (coiling) and a marginal or eccentric insertion into the placental disc. The fetus is positioned with limbs extended; the facial area is obscured by a green privacy block. A key diagnostic feature is visible on the fetal left hand, which demonstrates syndactyly (webbing or fusion of digits), serving as a significant morphological marker for fetal anomaly screening. The skin of the fetus appears translucent, consistent with late first-trimester development. This image is relevant for medical students and clinicians studying fetal pathology, embryology, and first-trimester congenital malformations.
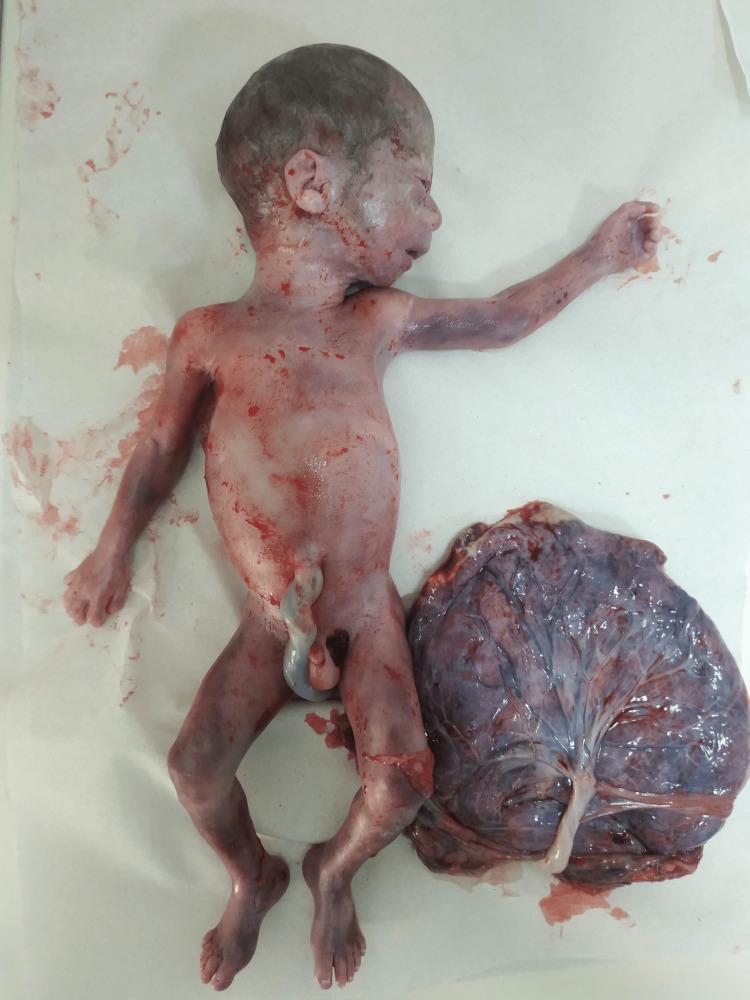
This clinical photograph shows an en bloc gross specimen of a fetoplacental unit following medical termination of pregnancy due to Williams-Beuren syndrome (WBS). The fetus is positioned in a supine/oblique view alongside the placenta. Key facial dysmorphisms characteristic of WBS are visible, including a bulbous nasal tip, a long philtrum, malar hypoplasia, a pointed chin, and prominent earlobes. The skin displays generalized erythema and areas of cyanosis/discoloration consistent with post-mortem changes. The umbilical cord is seen attached to the fetal abdomen and inserting centrally into the placenta. The placenta is dark reddish-purple with a glistening fetal surface (chorionic plate), demonstrating a normal branching vascular pattern (chorionic vessels). This image is educationally significant for medical genetics and obstetrics, illustrating the phenotypic manifestations of the 7q11.23 microdeletion in a second-trimester fetus.
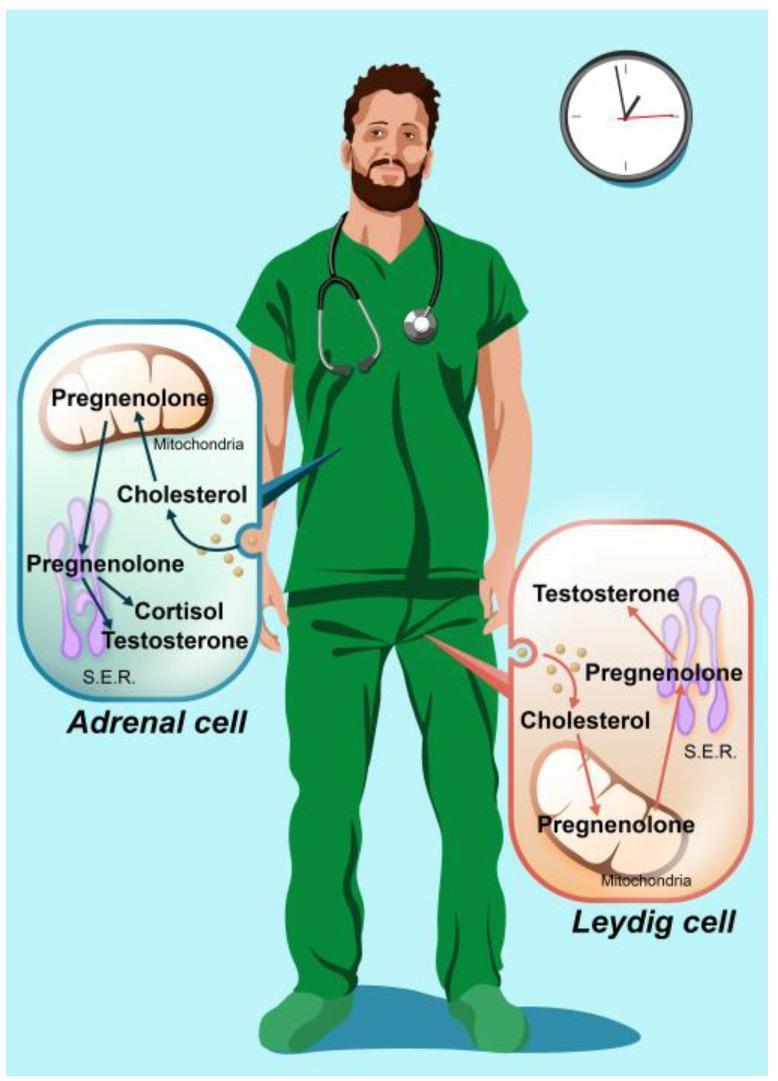
A medical infographic illustrating steroid hormone synthesis in human males, featuring a healthcare worker in green scrubs with call-outs to specific cellular sites. The diagram focuses on two primary cell types: Adrenal cells (top-left) and Leydig cells (bottom-right). Both diagrams show the uptake of cholesterol from the bloodstream into the mitochondria, where it is converted to pregnenolone. In the Adrenal cell, pregnenolone is shown moving to the Smooth Endoplasmic Reticulum (S.E.R.) to be synthesized into cortisol and testosterone. In the Leydig cell, the pathway shows pregnenolone entering the S.E.R. specifically for testosterone production. A clock in the upper right corner suggests a circadian or temporal component to these endocrine processes. This illustration serves as an educational tool for understanding the pathophysiology and biochemical pathways of male steroidogenesis, highlighting the roles of mitochondrial and cytoplasmic organelles in hormone metabolism.
placenta structure syncytiotrophoblast villous gas exchange nutrients fetus
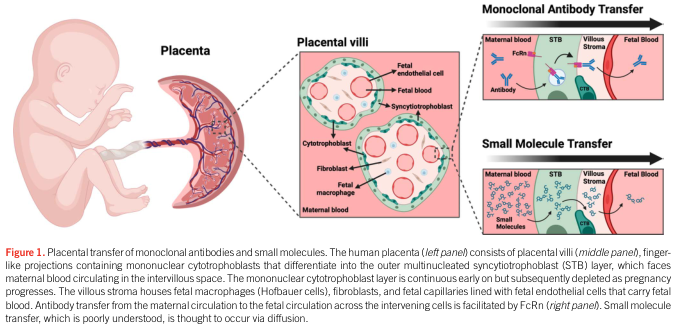
Summary : This figure illustrates the mechanisms of placental transfer for monoclonal antibodies and small molecules from maternal to fetal circulation, highlighting the structural organization of the placenta and placental villi, and the cellular pathways involved in each type of transfer. illustration: # Placenta Structure : • Depicts a fetus connected to the placenta. • The placenta is shown in cross-section, with a focus on the placental villi. # Placental Villi : • Enlarged schematic of a placental villus. • Key cell types labeled: cytotrophoblast, syncytiotrophoblast (STB), fibroblast, fetal macrophage, fetal endothelial cell. • Maternal blood and fetal blood compartments are indicated. • Shows the arrangement of maternal blood in the intervillous space and fetal blood within capillaries. # Monoclonal Antibody Transfer : • Diagram shows maternal blood containing antibodies. • Antibodies cross the syncytiotrophoblast (STB) layer via FcRn (neonatal Fc receptor). • Antibodies move through the villous stroma and fetal endothelial cells to reach fetal blood. • Pathway is directional: maternal blood → STB (via FcRn) → villous stroma → fetal endothelium → fetal blood. # Small Molecule Transfer : • Diagram shows maternal blood containing small molecules. • Small molecules diffuse across the STB, villous stroma, and fetal endothelial cells. • Pathway is less specific, suggesting passive diffusion from maternal to fetal blood. # Analysis : • The figure visually distinguishes the receptor-mediated transfer of antibodies (via FcRn) from the less-specific, likely diffusion-based transfer of small molecules. • Structural barriers (STB, villous stroma, fetal endothelium) are highlighted as key checkpoints for both transfer types. • The illustration emphasizes the complexity and selectivity of placental transfer mechanisms, with antibody transfer being more regulated than small molecule transfer.
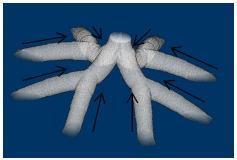
This physiological diagram illustrates the biomechanical contraction patterns of the rami chorii within the human placenta. The visual features a central trunk-like structure representing the main stem villi, from which approximately six to eight secondary cylindrical branches radiate outward. The surface of these structures exhibits a textured, ridged appearance consistent with placental villous morphology. Black arrows are superimposed on the image to indicate directional vectors of mechanical force. Each branch displays one or two arrows oriented along its longitudinal axis, pointing centrally toward the trunk and junctions. This represents the contractile movement of the stem villi, which is critical for regulating fetoplacental blood flow and maintaining intrauterine vascular resistance. The image is designed for advanced medical education in embryology, obstetrics, and placental physiology, demonstrating how dynamic architectural changes in the chorionic villi facilitate maternal-fetal exchange.
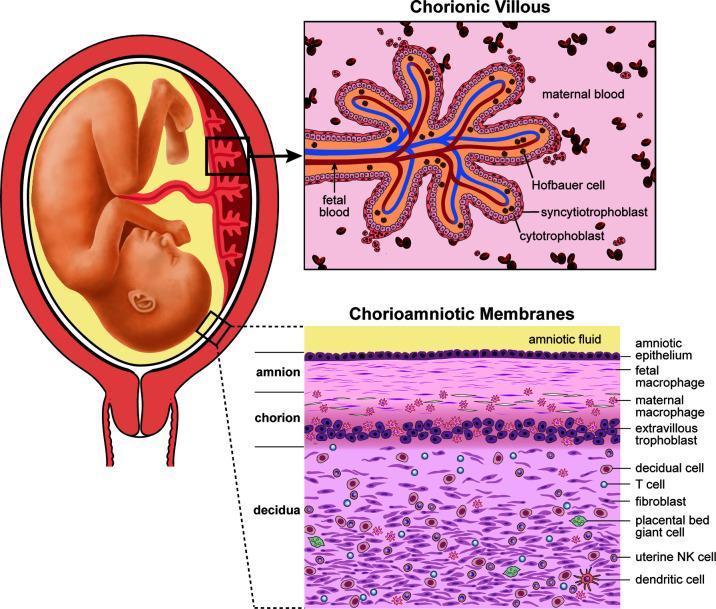
This medical illustration details the human placental anatomy and maternal-fetal interface across three views. On the left, a macro-level diagram shows a fetus in utero with the umbilical cord and placental attachment. Two inset panels provide microscopic structural detail. The upper right panel displays a cross-section of a Chorionic Villous, illustrating the exchange interface where fetal blood vessels are separated from the maternal blood space by three distinct layers: the syncytiotrophoblast, cytotrophoblast, and underlying stroma containing Hofbauer cells (placental macrophages). The lower right panel illustrates the layered Chorioamniotic Membranes. From the amniotic fluid inward, the layers are identified as the amniotic epithelium, the amnion (containing fetal macrophages), the chorion (containing maternal macrophages and extravillous trophoblasts), and the maternal decidua. The decidual layer is shown to be rich in diverse immune and stromal cells, including T cells, fibroblasts, placental bed giant cells, uterine Natural Killer (NK) cells, and dendritic cells. The diagram serves as an educational tool for understanding placental barrier composition and immune cell distribution at the maternal-fetal interface.
The Feto-Placental-Maternal Unit
Why the Concept Exists: Enzymatic Limitations
| Compartment | What it LACKS | What it HAS |
|---|---|---|
| Placenta | 17α-hydroxylase (C17,20-lyase) - cannot convert C21 steroids to C19 androgens (DHEA); lacks 16α-hydroxylase | Aromatase (CYP19), P450scc, 3β-HSD; can convert cholesterol → pregnenolone → progesterone; can aromatize androgens → estrogens |
| Fetal adrenal gland | 3β-HSD (in the "fetal zone"); cannot make cortisol/progesterone well | Massive DHEAS production; 16α-hydroxylase (in liver) |
| Fetal liver | Aromatase | 16α-hydroxylase (converts DHEA → 16α-OH-DHEAS) |
| Mother | n/a - contributes LDL cholesterol and receives/metabolizes hormones | Provides cholesterol substrate; processes estriol; produces cortisol |
The Key Diagram
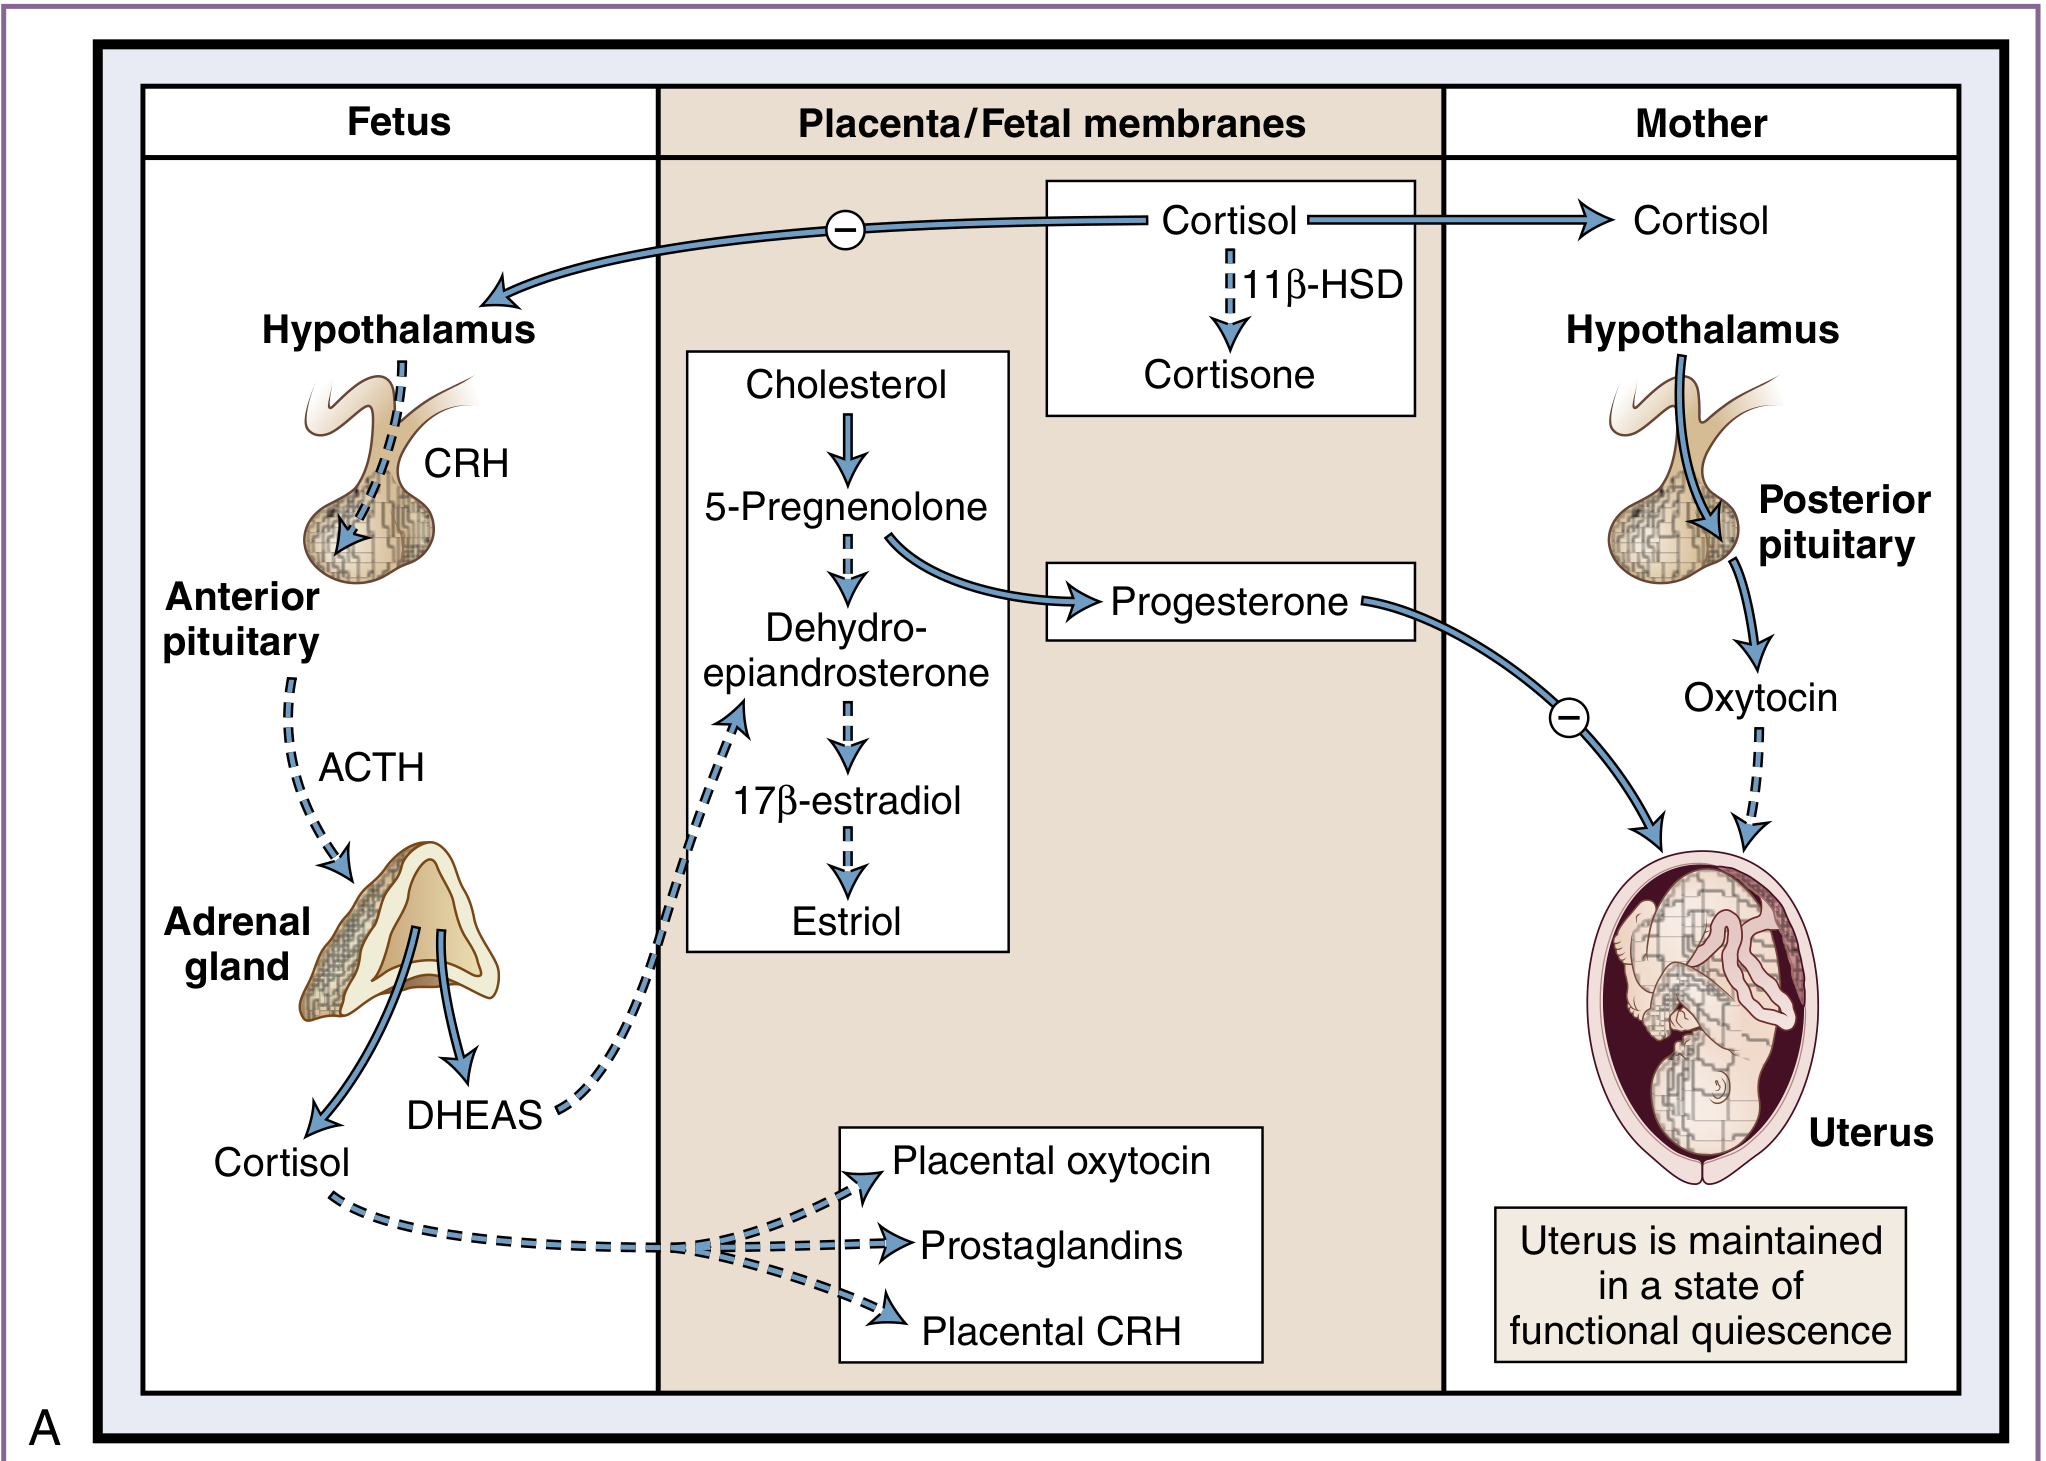
Component 1: Progesterone Synthesis
Pathway
- Maternal LDL cholesterol is taken up by the syncytiotrophoblast
- Placental P450scc (cholesterol side-chain cleavage enzyme) converts cholesterol → pregnenolone
- Placental 3β-HSD converts pregnenolone → progesterone
Fetal Role
- The fetal adrenal fetal zone lacks 3β-HSD, so it cannot use pregnenolone to make progesterone or cortisol directly → it uses progesterone supplied by the placenta as a substrate for cortisol biosynthesis
- Placenta → progesterone → fetal adrenal → cortisol (this is why adrenalectomy of the fetus does not affect placental progesterone)
Importance of Progesterone
- Maintains uterine quiescence (inhibits gap junctions, inhibits CAP gene expression, inhibits prostaglandins)
- Maintains the decidua
- Until weeks 7-9, the corpus luteum (maintained by hCG) is the main source; after this the placenta takes over completely - the luteo-placental shift
- Progesterone receptor antagonist mifepristone (RU-486) causes abortion before week 7 by blocking this support
Component 2: Estrogen Synthesis - The Classic Example of the Unit
Three Estrogens Produced
| Estrogen | Predominates | Potency |
|---|---|---|
| Estradiol (E₂) | All trimesters | Highest (x12 estrone) |
| Estrone (E₁) | Early pregnancy | Intermediate |
| Estriol (E₃) | 2nd and 3rd trimesters (dominant) | Lowest (~1/100 E₂) |
Pathway A: Estradiol and Estrone Synthesis
Fetal adrenal (fetal zone)
    ↓ LH/ACTH stimulus
DHEAS (dehydroepiandrosterone sulfate)
    ↓ Placenta: sulphatase removes sulfate
DHEA
    ↓ Placenta: aromatase (CYP19)
ESTRONE + ESTRADIOL (released into maternal circulation)
- Alternatively, the maternal adrenal provides DHEAS → sulfatase in placenta → DHEA → aromatized to E₁/E₂
Pathway B: Estriol Synthesis - The Three-Compartment Pathway
Fetal adrenal (fetal zone)
    ↓ ACTH (from fetal pituitary)
DHEAS
    ↓ Fetal LIVER: 16α-hydroxylase
16α-OH-DHEAS
    ↓ Placenta: sulphatase
16α-OH-DHEA
    ↓ Placenta: aromatase (CYP19)
ESTRIOL (16-hydroxy-17β-estradiol)
    → Released into maternal and fetal circulation
- Estriol cannot be made from simple hydroxylation of estradiol - it requires the 16-hydroxylation step that only occurs in the fetal liver
- The fetal adrenal gland (fetal zone) produces enormously large amounts of DHEAS - the fetal adrenal is proportionally larger than the adult adrenal at term
- Maternal serum/urine estriol is a marker of feto-placental-maternal unit integrity: if it falls, it signals compromise of the fetus, placenta, or one of the enzymatic pathways
- Estriol is only 1/100 the potency of estradiol but promotes uteroplacental blood flow as potently as other estrogens - this may explain its dramatic rise in the 3rd trimester
Why Estrogen Levels Rise So Dramatically in Pregnancy
| Trimester | Dominant source of estrogens | Notes |
|---|---|---|
| 1st trimester | Corpus luteum (maintained by hCG) | Before placenta matures |
| 2nd-3rd trimester | Placenta + fetal adrenal zone | After luteo-placental shift; DHEAS production increases ~20-fold near term |
Component 3: Human Chorionic Gonadotropin (hCG)
- Secreted by the syncytiotrophoblast (trophoblast cells of the developing placenta)
- Begins 8 days after ovulation (before the next expected period)
- α subunit is identical to FSH, LH, TSH; β subunit is unique (longer than LH β-subunit, contains extra C-terminal peptide)
- Function: acts on LH receptors on corpus luteum cells → prevents regression → corpus luteum continues producing E₂ and progesterone ("rescue of the corpus luteum")
- Levels: rise exponentially in 1st trimester, peak at ~8-12 weeks (~100,000 mIU/mL), then decline as placenta takes over steroid synthesis
- Clinical use: basis of pregnancy test (detectable in urine 9 days after ovulation); serum β-hCG monitors ectopic pregnancy, molar pregnancy, choriocarcinoma
- hCG also has weak TSH-like activity → mild physiological hyperthyroidism in the 1st trimester (morning sickness partly attributed to this)
Component 4: Human Placental Lactogen (hPL) / Human Chorionic Somatomammotropin
- Secreted by syncytiotrophoblast; structure similar to growth hormone and prolactin
- Levels rise throughout pregnancy proportional to placental mass
- Functions:
- Metabolic shift: acts as a growth hormone analogue on maternal tissues → promotes insulin resistance in the mother → diverts glucose to the fetus (the fetus is a "glucose thief")
- Promotes lipolysis in the mother → free fatty acids used by mother for energy while glucose is spared for fetus
- Promotes breast development (with prolactin)
- May stimulate fetal growth (IGF-1 mediated)
- Clinical significance: hPL-driven insulin resistance is the main cause of gestational diabetes mellitus
Component 5: The CRH-Based "Placental Clock" and the Fetal HPA Axis
Fetal hypothalamus → CRH (increases with gestational age)
    ↓
Fetal anterior pituitary → ACTH
    ↓
Fetal adrenal cortex → Cortisol + DHEAS
    ↓                              ↓
Cortisol feeds back to       DHEAS enters placenta
PLACENTA (positive            → aromatised to estrogens
feedback - unlike
hypothalamus)
    ↓
Placenta secretes MORE CRH
(amplifying loop)
    ↓
More cortisol → matures fetal lung surfactant
+ Shifts E:P ratio → promotes prostaglandins → uterine contractions
- Placental CRH production is upregulated (not suppressed) by fetal cortisol - the opposite of hypothalamic feedback - creating a positive amplifying loop
- CRH-binding protein (CRH-BP) keeps most CRH inactive; near term CRH-BP falls → free active CRH rises
- Some authorities propose a "placental clock" set early after implantation by the rate of CRH gene expression, determining gestational length
- The 11β-HSD-2 enzyme in the syncytiotrophoblast converts maternal cortisol → inactive cortisone, protecting the fetus from high maternal cortisol levels. Its impairment in hypoxia/preeclampsia may cause IUGR and fetal programming of adult disease.
Component 6: Placental Structure Enabling the Unit
- Single multinucleate layer in direct contact with maternal blood in the intervillous space
- No MHC class I antigens → does not trigger maternal immune rejection
- Site of: steroid synthesis, hCG/hPL secretion, nutrient/gas exchange, immunoglobulin transfer (FcRn receptor)
| Substance | Mechanism |
|---|---|
| O₂, CO₂, water | Diffusion |
| Glucose | Facilitated diffusion (GLUT transporters) |
| Amino acids | Active transport |
| Fatty acids, fat-soluble vitamins | Diffusion |
| IgG antibodies | Receptor-mediated endocytosis (FcRn - neonatal Fc receptor) → passive immunity to neonate |
| Maternal cortisol | Mostly inactivated by 11β-HSD-2 in syncytiotrophoblast |
| Drugs, alcohol, many viruses (TORCH) | Diffusion (clinical concern) |
Summary: Who Does What
| Hormone/Product | Made by | Requires input from | Function |
|---|---|---|---|
| Progesterone | Placenta | Maternal LDL cholesterol | Uterine quiescence; decidua; fetal adrenal substrate |
| Estradiol (E₂) | Placenta (aromatase) | Fetal adrenal DHEAS | Uterine growth; cervical ripening; breast development |
| Estriol (E₃) | Placenta (aromatase) | Fetal adrenal DHEAS + fetal liver 16α-OH | Uteroplacental blood flow; marker of fetal well-being |
| hCG | Trophoblast | - | Rescues corpus luteum; maintains E₂/P4 in 1st trimester |
| hPL | Trophoblast | - | Maternal insulin resistance; fetal nutrition priority |
| Fetal cortisol | Fetal adrenal | Placental progesterone as substrate | Lung maturation; parturition trigger |
| Placental CRH | Syncytiotrophoblast | Fetal cortisol (positive feedback) | Placental clock; parturition cascade |
Clinical Significance
| Clinical Point | Mechanism |
|---|---|
| Pregnancy test | Detects hCG in urine from day 9 post-ovulation |
| 1st trimester bleeding / threatened miscarriage | Serial β-hCG and progesterone levels monitored |
| Unconjugated estriol (uE₃) in triple/quadruple screen | Low uE₃ suggests placental insufficiency, fetal adrenal suppression, or Down syndrome (T21 - low) |
| Down syndrome screening | ↑hCG, ↓AFP, ↓uE₃ → "triple test" for T21 |
| Gestational diabetes | hPL-driven insulin resistance |
| Molar pregnancy / choriocarcinoma | Extremely high hCG levels from abnormal trophoblast proliferation |
| Antenatal corticosteroids (betamethasone) | Given to mother when preterm birth threatened → crosses placenta → accelerates fetal lung surfactant maturation (mimics fetal cortisol effect) |
| Fetal distress / IUGR | Impaired 11β-HSD-2 → excess maternal cortisol reaches fetus → growth restriction |
| Preterm birth | Premature activation of fetal HPA axis → early DHEAS surge → premature estrogen rise → early onset of parturition cascade |
- Creasy & Resnik's Maternal-Fetal Medicine - Fetal HPA axis, DHEAS pathway, estriol synthesis, placental CRH clock, progesterone role
- Costanzo Physiology, 7th Ed. - hCG, corpus luteum rescue, early pregnancy events, luteo-placental shift
- Medical Physiology (Boron & Boulpaep) - Progesterone synthesis by placenta, estriol pathway
- Tietz Textbook of Laboratory Medicine - hCG kinetics, estriol as marker of fetoplacental integrity