
nerve supply of Lowe rlimb
nerve supply lower limb lumbar sacral plexus diagram
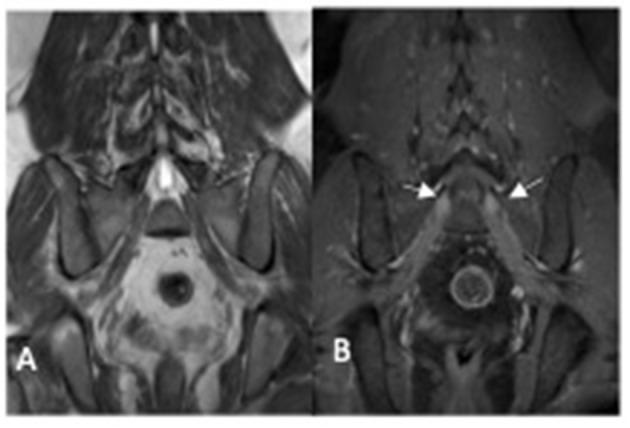
This diagnostic image pair displays coronal T1-weighted MRI scans of the lumbosacral plexus. Image A is a non-contrast study, and Image B is a post-contrast study. The anatomical region focuses on the lower lumbar spine, sacrum, and pelvis. In image A, the exiting sacral nerve roots appear as relatively hypo-intense (darker) structures compared to the surrounding pelvic musculature and fat. In image B, the same nerve roots (indicated by white arrows) demonstrate marked gadolinium enhancement and visible hypertrophy. This combination of nerve root enlargement and post-contrast enhancement is a key radiological finding in chronic inflammatory or hereditary polyneuropathies, such as Charcot-Marie-Tooth disease. The images clearly illustrate the contrast between normal spinal canal structures and pathologic lumbosacral plexus involvement, emphasizing the diagnostic utility of post-contrast T1 sequences in identifying breakdown of the blood-nerve barrier or inflammatory infiltration in neural tissues.
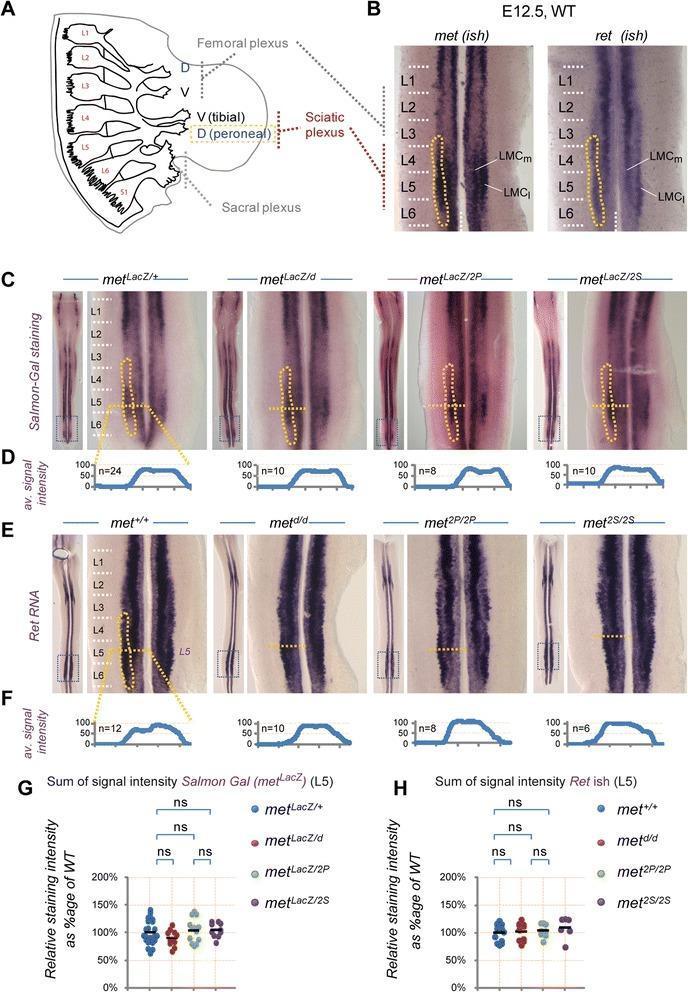
This composite educational graphic illustrates the molecular and anatomical patterning of lumbar motor neurons (MNs) in mouse embryos. Panel A is an anatomical diagram showing a lateral view of the lumbar spinal nerves (L1-L6) and the formation of the femoral, sciatic, and sacral plexuses. It specifically details the tibial (ventral) and peroneal (dorsal) nerve origins from the sciatic plexus. Panels B, C, and E display experimental results from In Situ Hybridization (ISH) and Salmon-Gal staining, visualizing the expression of Met and Ret markers in E12.5 spinal cords across wild-type (WT) and various Met-signaling mutants (metLacZ/d, met2P/2P, met2S/2S). These panels focus on the lateral motor column (LMC) pools, particularly peroneal MNs located between segments L3 and L6. Panels D and F provide quantitative average signal intensity plots for these expression patterns at the L5 level. Panels G and H contain statistical scatter plots comparing the sum of signal intensities between genotypes, demonstrating that despite signaling mutations, total MN populations remain comparable at this developmental stage (E12.5) before the onset of muscle-dependent cell death.
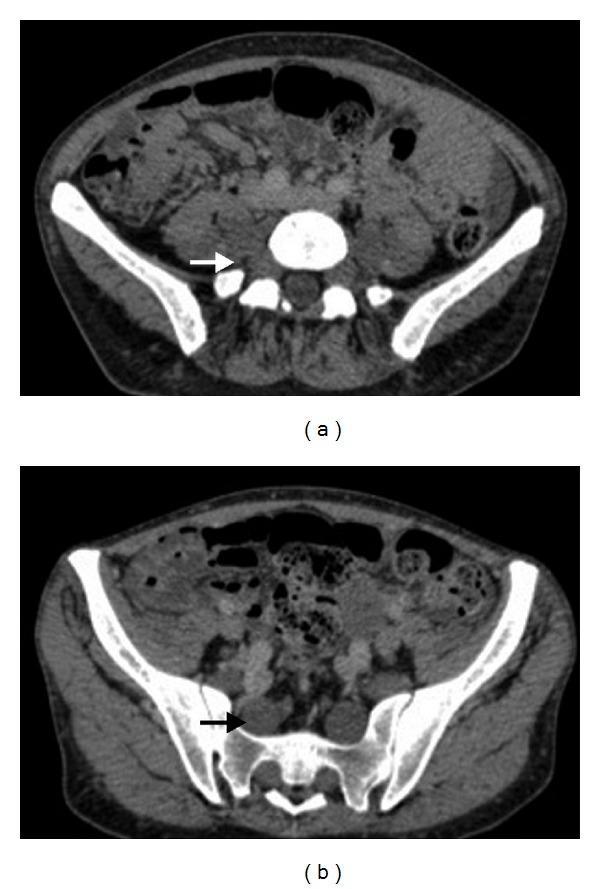
Two axial CT images of the pelvic and lower lumbar region in a 34-year-old patient demonstrate classic manifestations of Neurofibromatosis Type 1 (NF1). The images show bilateral, multi-segmental plexiform neurofibromas involving the lumbar and sacral nerve roots. These neurofibromas appear as irregular, ill-defined masses of soft tissue density that follow the course of the lumbosacral plexus. Key findings include marked enlargement and thickening of the nerve roots as they exit the neural foramina, with subsequent infiltration and displacement of adjacent soft tissues. Arrows highlight specific areas of nerve root expansion and the loss of normal perineural fat planes. The bony anatomy of the sacrum and iliac wings is visible, providing anatomical landmarks for the location of these peripheral nervous system tumors. The presentation is highly characteristic of the 'bag of worms' morphology associated with plexiform neurofibromas in the setting of NF1.
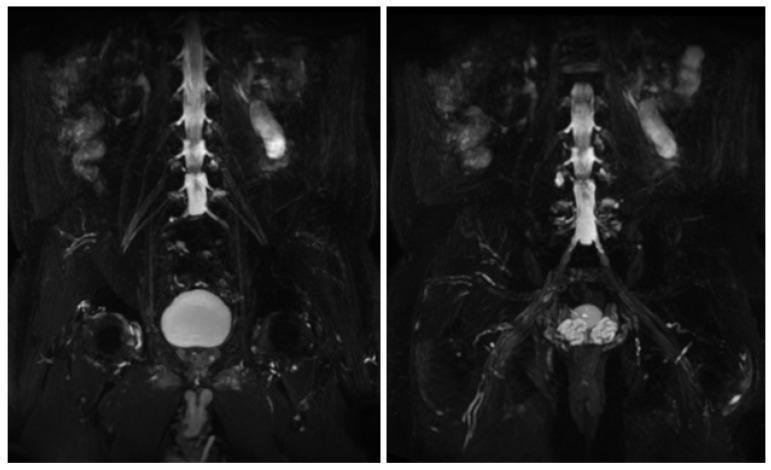
Diagnostic Image: This figure presents two coronal Maximum Intensity Projection (MIP) reconstructions from a 3D T2-weighted MRI sequence (likely a 3D CUBE or similar high-resolution neurography sequence) focusing on the lumbosacral plexus. The central vertical structure is the lumbar spinal column, where the thecal sac and exiting nerve roots exhibit high signal intensity against the suppressed background. The lumbar (L4, L5) and sacral (S1-S4) nerve roots are visible as thin, linear, branching structures extending laterally and inferiorly from the spine to form the plexus. The urinary bladder appears as a prominent, hyperintense spherical structure in the lower pelvic region. The images demonstrate normal anatomical morphology, with the nerve roots showing regular caliber, symmetry, and uniform signal intensity. There is no evidence of pathological contrast enhancement, hypertrophy, or diffuse swelling in this specific reconstruction. This imaging modality is essential in neurology and radiology for evaluating inflammatory or hereditary neuropathies and plexopathies by suppressing background fat and muscle to highlight neural architecture.
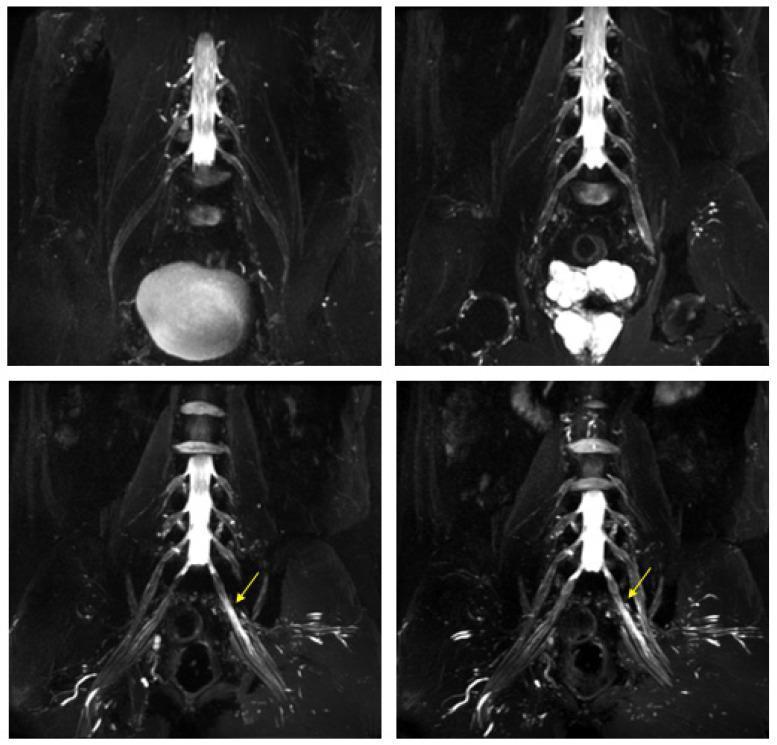
Diagnostic Image: This composite shows four Maximum Intensity Projection (MIP) reconstructions of a 3D-cube T2-weighted (T2W) MR neurography sequence focusing on the lumbosacral plexus. The images reveal a diffuse, moderate increase in the thickness and signal intensity of the lumbar and sacral nerve roots bilaterally. Specifically, in the lower panels, yellow arrows highlight the left S1 nerve root, which demonstrates asymmetric pathological thickening and marked T2 hyperintensity compared to the contralateral side. The anatomical landmarks include the lower lumbar vertebrae, sacrum, and the exiting nerve roots that form the sciatic nerve. These findings are characteristic of hypertrophic neuropathy or inflammatory polyradiculopathy, illustrating key diagnostic features such as nerve root enlargement (hypertrophy) and edema-like signal changes (hyperintensity) on fluid-sensitive MRI sequences. The medical specialty is Neuroradiology, intended for intermediate to advanced learners studying peripheral nerve imaging and plexopathy.
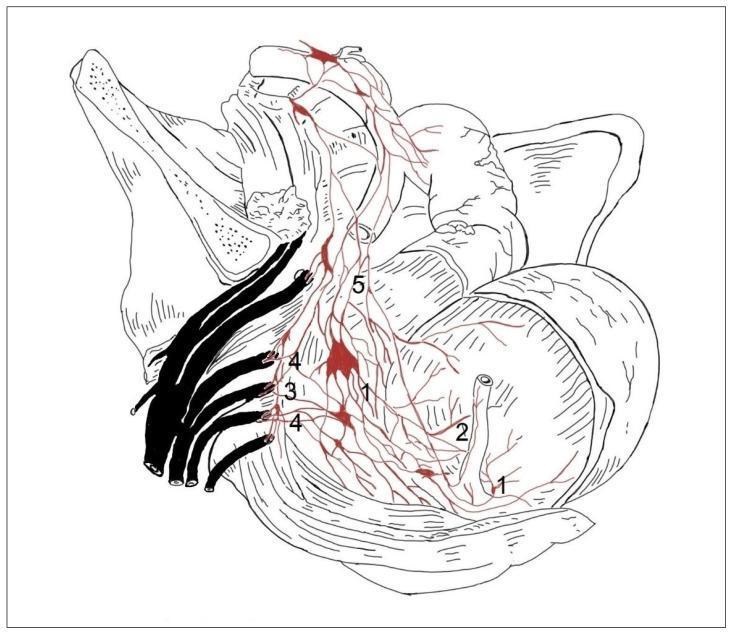
This medical anatomical diagram illustrates the autonomic nerve supply to the human pelvic viscera, specifically demonstrating the 'concentrated type' of innervation pattern. The illustration depicts a lateral view of the pelvic cavity with the rectum (1) and urinary bladder (2) as primary targets of innervation. Key structures include the sacral sympathetic trunk (3), shown as prominent vertical dark cords, and the nervi erigentes (4) or pelvic splanchnic nerves arising from the sacral plexus. The inferior hypogastric plexus (5) is shown as a network of nerves and ganglia (red highlights) distributing to the bladder and rectum. This concentrated variation is characterized by a simplified neural architecture: fewer, larger ganglia and less frequent, weaker connections between the sympathetic trunk and the visceral plexuses compared to the segmental type. The diagram is intended for neuroanatomical education, highlighting variations in pelvic autonomic pathways relevant to surgical considerations in proctology and urology.
cutaneous nerve supply lower limb dermatomes anterior posterior view
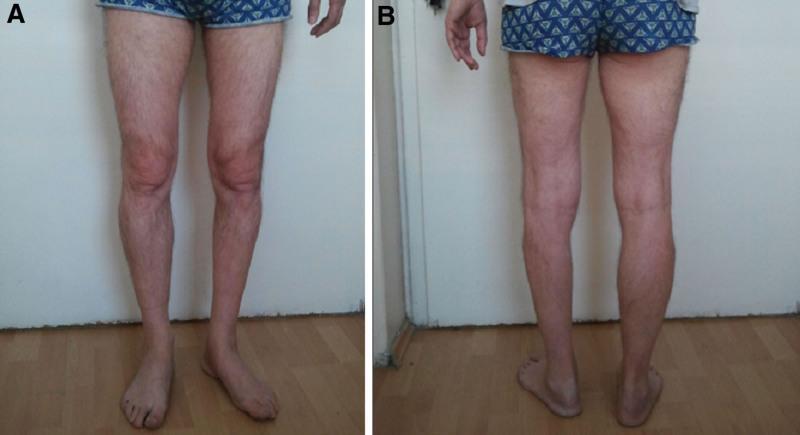
This clinical photograph consists of two panels, (A) anterior and (B) posterior views, demonstrating significant unilateral lower limb pathology in a standing patient. The primary finding is marked amyotrophy (muscle wasting) of the left lower leg. The anterior view (A) reveals a noticeable reduction in the girth of the left calf compared to the right, with the left foot exhibiting a degree of external rotation. The posterior view (B) emphasizes the loss of muscle bulk in the gastrocnemius and soleus complexes on the left side, resulting in a thinner contour of the lower leg and more prominent bony landmarks at the ankle joint. The right lower limb appears to have normal muscle mass and alignment. This comparison chart of anatomical views illustrates clinical signs characteristic of focal motor neuron diseases, peripheral nerve injuries, or unilateral radiculopathies. The content is suitable for medical education focusing on physical examination, neurology, and musculoskeletal assessment to teach the visual identification of muscle atrophy and associated postural changes.
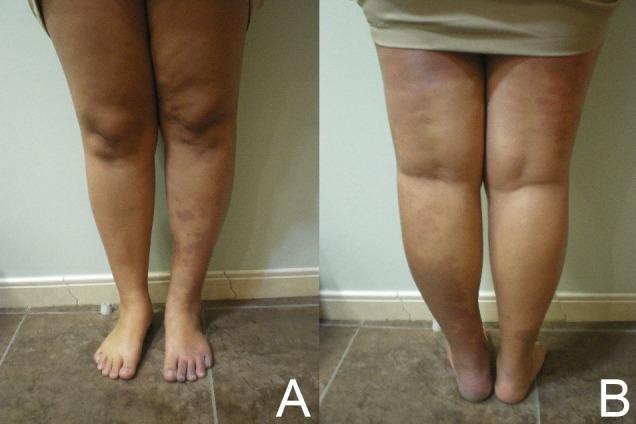
Clinical photograph showing an anterior (A) and posterior (B) view of the lower limbs of a patient demonstrating significant limb asymmetry and vascular malformations. The right lower limb (left side of panel A, right side of panel B) exhibits marked hypertrophy (overgrowth) in both circumference and length compared to the contralateral limb. Cutaneous findings include extensive, ill-defined purple-to-reddish port-wine stains (capillary malformations) and smaller scattered dark lesions consistent with angiokeratomas or verrucous nevi, particularly concentrated on the distal leg and foot. The skin of the affected limb shows altered texture and hyperpigmentation. This clinical presentation of limb hypertrophy, vascular malformations, and skin lesions is characteristic of overgrowth syndromes such as Klippel-Trenaunay Syndrome (KTS) or Parkes Weber Syndrome (PWS). The image illustrates key diagnostic features for angiology and dermatology specialties regarding congenital vascular anomalies.
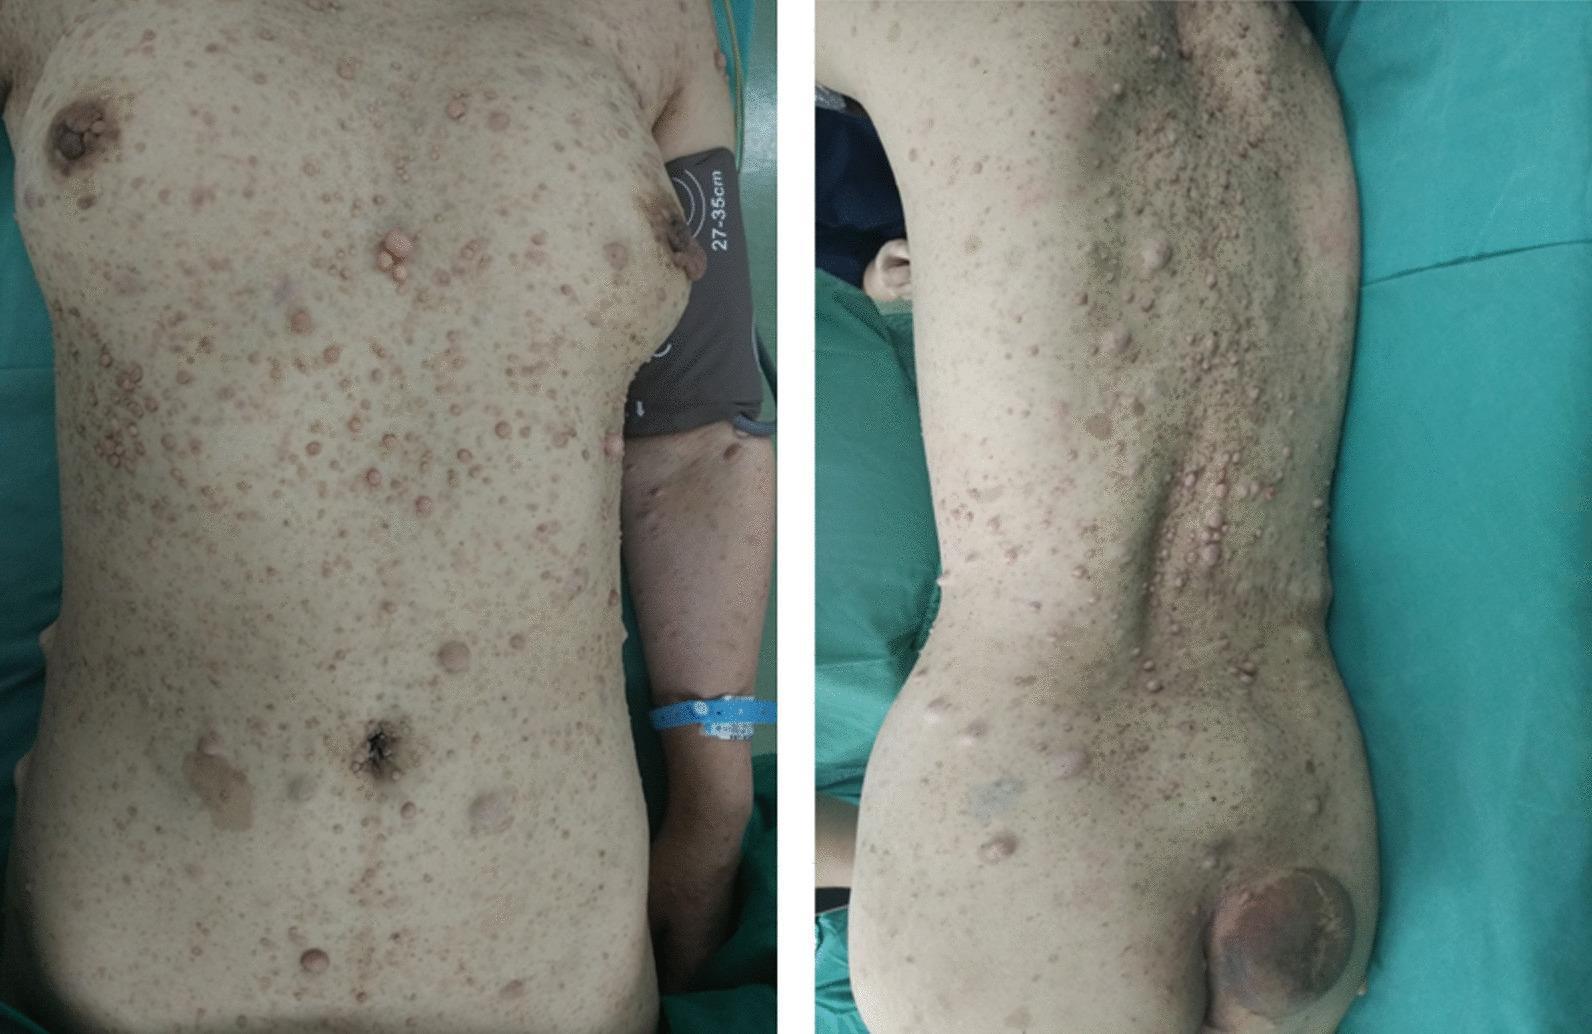
Two clinical photographs showing the anterior (left) and posterior (right) trunk of a 50-year-old female with extensive cutaneous neurofibromas, characteristic of Neurofibromatosis Type 1 (NF1). The anterior view demonstrates numerous skin-colored to light-brown, dome-shaped, and sessile nodules of varying sizes distributed across the chest and abdomen. The posterior view shows a higher density of lesions, particularly clustered along the paraspinal regions. Notably, a large, hyperpigmented, and prominent mass is visible on the right lower back/gluteal region, suggestive of a larger neurofibroma or potentially a plexiform variant. The lesions range from small papules to larger pedunculated masses. The presence of these multiple benign neurofibromas, combined with the clinical history of a posterior mediastinal malignant peripheral nerve sheath tumor (MPNST), illustrates the significant disease burden and potential for malignant transformation in patients with neurocutaneous syndromes.
Nerve Supply of the Lower Limb
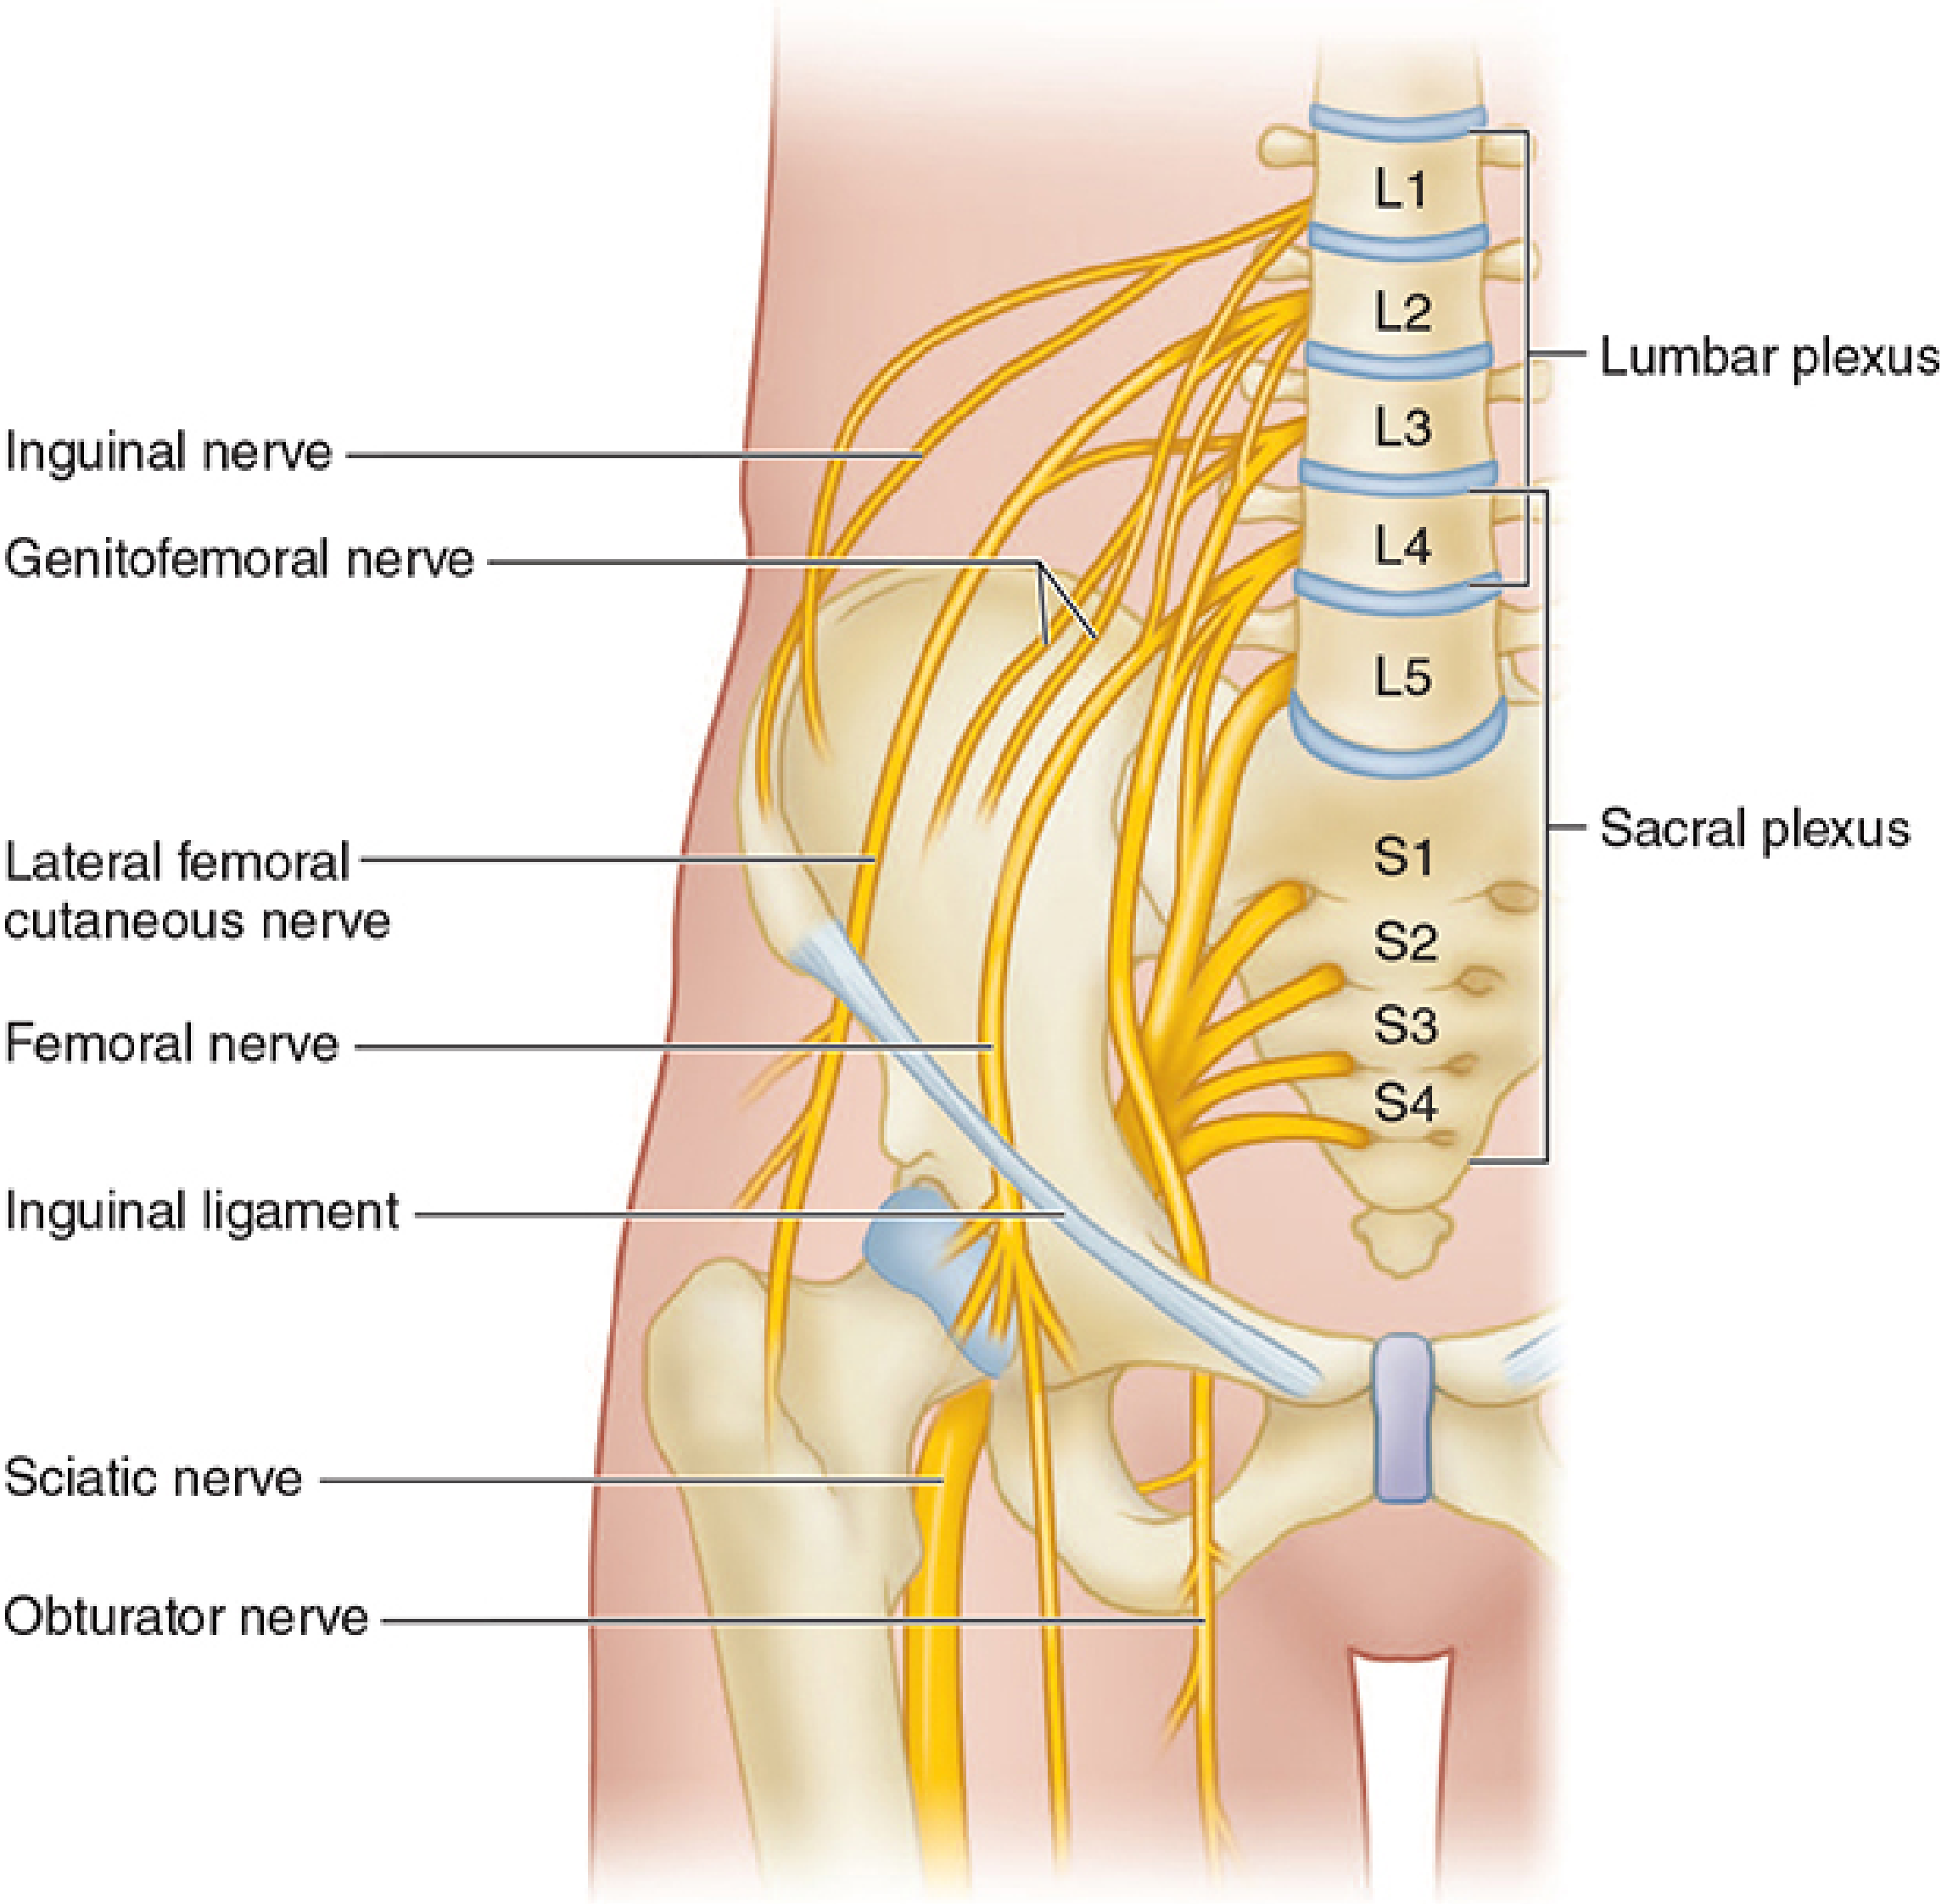
1. Lumbar Plexus (L1-L4)
Major Branches from Lumbar Plexus
| Nerve | Spinal Segments | Motor Supply | Sensory (Cutaneous) Supply |
|---|---|---|---|
| Ilio-inguinal | L1 | None in lower limb (innervates abdominal wall muscles) | Anteromedial upper thigh, adjacent perineum |
| Genitofemoral | L1, L2 | Genital branch: cremaster muscle (men) | Femoral branch: anterior central upper thigh; genital branch: anterior scrotum / mons pubis |
| Lateral cutaneous nerve of thigh | L2, L3 | None | Anterolateral thigh |
| Femoral nerve | L2-L4 | All anterior compartment thigh muscles (quadriceps, sartorius); also iliacus and pectineus | Anterior thigh, anteromedial knee, medial leg, medial foot (via saphenous nerve) |
| Obturator nerve | L2-L4 | All medial compartment thigh muscles (adductors, except ischial part of adductor magnus and pectineus); obturator externus | Upper medial thigh |
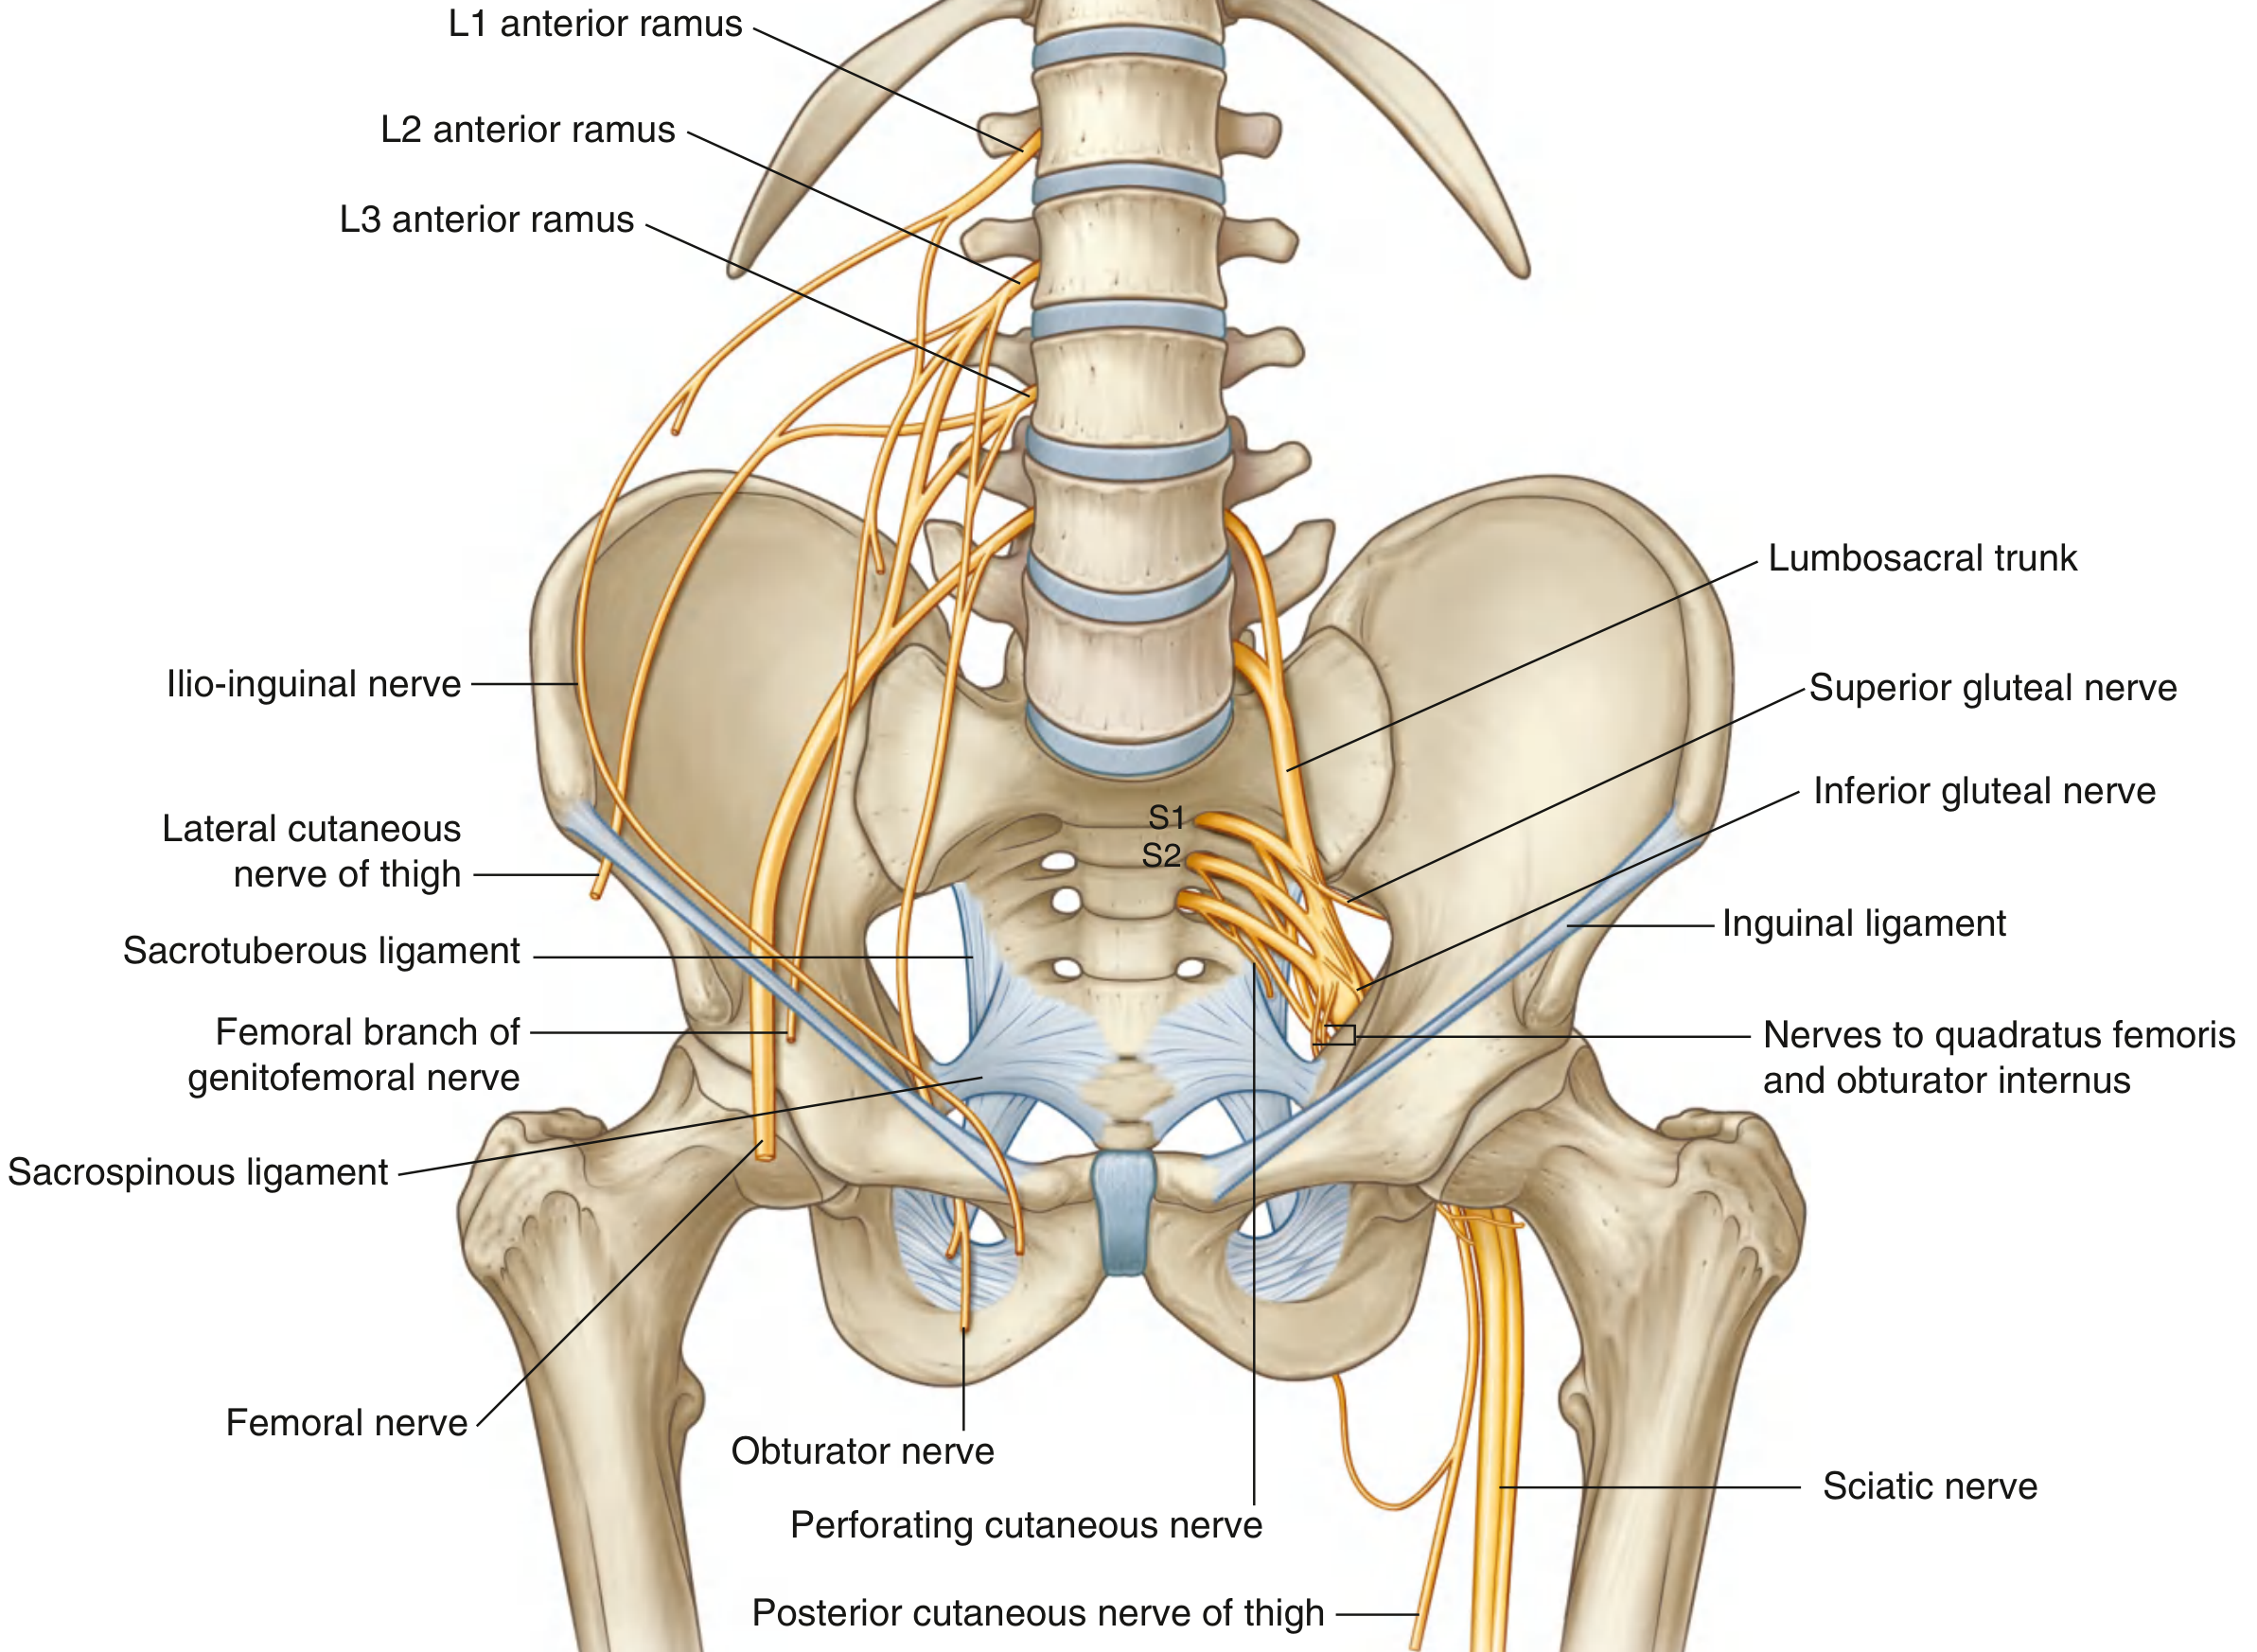
2. Sacral Plexus (L4-S4)
Major Branches from Sacral Plexus
| Nerve | Spinal Segments | Motor Supply | Sensory Supply |
|---|---|---|---|
| Sciatic nerve | L4-S3 | All posterior thigh compartment muscles + ischial part of adductor magnus; all leg and foot muscles | Lateral leg and lateral/sole of foot |
| - Tibial division | L4-S3 | Posterior thigh (hamstrings + adductor magnus ischial head); posterior leg; sole of foot | Skin of sole and plantar foot |
| - Common fibular (peroneal) division | L4-S2 | Short head of biceps femoris; anterior and lateral compartments of leg; extensor digitorum brevis | Anterolateral leg; dorsum of foot |
| Superior gluteal nerve | L4-S1 | Gluteus medius, gluteus minimus, tensor fasciae latae | None |
| Inferior gluteal nerve | L5-S2 | Gluteus maximus | None |
| Posterior cutaneous nerve of thigh | S1-S3 | None | Gluteal fold, posterior thigh, upper posterior leg, adjacent perineum |
| Nerve to quadratus femoris | L4-S1 | Quadratus femoris, gemellus inferior | None |
| Nerve to obturator internus | L5-S2 | Obturator internus, gemellus superior | None |
| Nerve to piriformis | S1, S2 | Piriformis | None |
| Perforating cutaneous nerve | S2, S3 | None | Medial aspect of gluteal fold |
| Pudendal nerve | S2-S4 | Perineal muscles, external urethral and anal sphincters | Most skin of perineum, penis/clitoris |
3. Key Nerve Details
Femoral Nerve (L2-L4)
- Enters the thigh by passing deep to the inguinal ligament, lateral to the femoral artery in the femoral triangle.
- Its most medial branch, the saphenous nerve, is the only branch to travel below the knee - it supplies skin on the medial leg, medial ankle, and medial foot.
- Sole motor nerve to quadriceps; blocking it disables knee extension.
Obturator Nerve (L2-L4)
- Enters the thigh via the obturator canal.
- Supplies all medial compartment adductors except pectineus (femoral nerve) and the ischial part of adductor magnus (sciatic nerve).
Sciatic Nerve (L4-S3)
- The largest nerve in the body.
- Forms on the anterior surface of piriformis, exits through the greater sciatic foramen inferior to piriformis.
- Usually divides into tibial and common fibular nerves in the popliteal fossa (though it may divide higher, even in the pelvis).
- The tibial nerve supplies the posterior leg and sole; the common fibular (peroneal) nerve supplies the anterior and lateral leg and dorsum of foot.
Gluteal Nerves
- Superior gluteal (L4-S1): exits above piriformis - supplies gluteus medius, minimus, and tensor fasciae latae.
- Inferior gluteal (L5-S2): exits below piriformis - supplies gluteus maximus only.
4. Summary Mnemonic by Region
| Region | Main Nerve(s) |
|---|---|
| Anterior thigh | Femoral (L2-L4) |
| Medial thigh | Obturator (L2-L4) |
| Posterior thigh | Sciatic (L4-S3) |
| Gluteal region | Superior gluteal, Inferior gluteal |
| Medial leg / medial foot | Saphenous (branch of femoral) |
| Anterior leg / dorsum of foot | Common fibular / deep fibular |
| Posterior leg / sole | Tibial |
Phases of Gait and its muscles
phases of gait cycle stance swing diagram
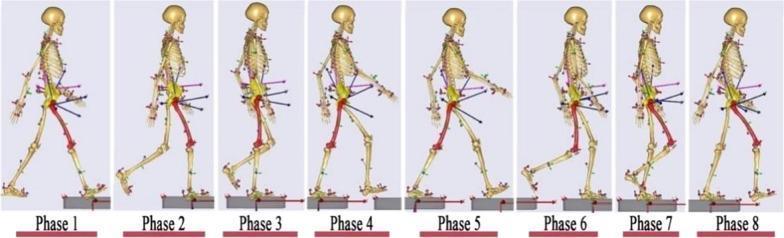
A schematic diagram illustrating the 8 anatomical phases of a human gait cycle using a subject-specific musculoskeletal kinematic model. The sequence of skeletal illustrations demonstrates the dynamic transition through stance and swing phases: Phase 1 (Initial Contact), Phase 2 (Loading Response), Phase 3 (Mid-stance), Phase 4 (Terminal Stance), Phase 5 (Pre-swing), Phase 6 (Initial Swing), Phase 7 (Mid-swing), and Phase 8 (Terminal Swing). The model displays detailed bone structures including the pelvis, femur, tibia, and foot. Multi-colored spherical markers and vector lines are strategically placed on key anatomical landmarks, including the trunk, upper limbs, hip joints, knees, and ankles, to represent biomechanical tracking points and force vectors. The diagram emphasizes joint angle variations—such as knee flexion and hip extension—and the precise positioning of the foot relative to a force platform during a complete walking cycle. This material is used for kinematic analysis and biomechanical research in orthopedics and physical therapy.
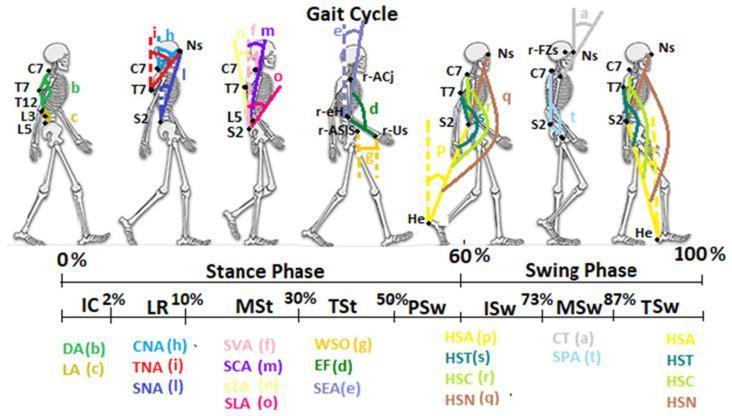
This medical illustration is a Timeline/Progression diagram depicting the human gait cycle from 0% to 100%. Seven skeletal figures in sagittal view demonstrate the biomechanics of movement across the Stance Phase (0-60%) and Swing Phase (60-100%). The diagram incorporates the DB-Total marker set protocol, with reflective markers at anatomical landmarks including the Nasion (Ns), spinous processes (C7, T7, L5, S2), acromioclavicular joint (ACj), and heel (He). Key gait phases are identified: Initial Contact (IC), Loading Response (LR), Mid-Stance (MSt), Terminal Stance (TSt), Pre-Swing (PSw), Initial Swing (ISw), Mid-Swing (MSw), and Terminal Swing (TSw). Color-coded lines and lowercase letters (a-t) represent eighteen sagittal kinematic parameters, such as Dorsal Angle (DA), Lumbar Angle (LA), Sagittal Vertical Axis (SVA), and various Heel-Sacrum relationships (HSA, HST, HSC, HSN). The educational focus is on whole-body kinematics, showing the dynamic alignment of the head, trunk, and limbs during walking for clinical motion analysis and gait assessment in rehabilitation medicine.
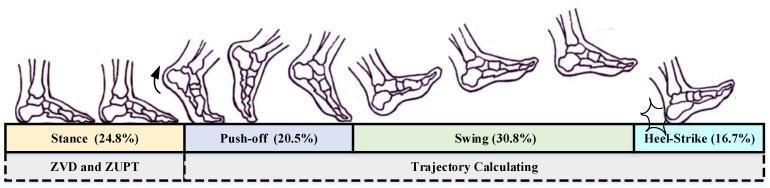
This medical diagram illustrates the four primary phases of the human gait cycle through a series of anatomical foot and ankle sketches. The phases are divided as follows: 1) Stance Phase (24.8%): The foot is shown flat on the supporting surface, coinciding with Zero-Velocity Detector (ZVD) and Zero-Velocity Update (ZUPT) calculations. 2) Push-off Phase (20.5%): The heel lifts, and the metatarsals/toes provide propulsion. 3) Swing Phase (38.0%): The foot is completely off the ground and moving forward through space. 4) Heel-Strike Phase (16.7%): The cycle concludes with initial contact of the heel on the ground. The diagram also maps these biomechanical stages to technical positioning tasks, showing that trajectory calculating occurs during the push-off, swing, and heel-strike phases. This visual is designed to explain the temporal distribution and kinematic transitions of walking, useful in physical therapy, biomechanics, and rehabilitation medicine.
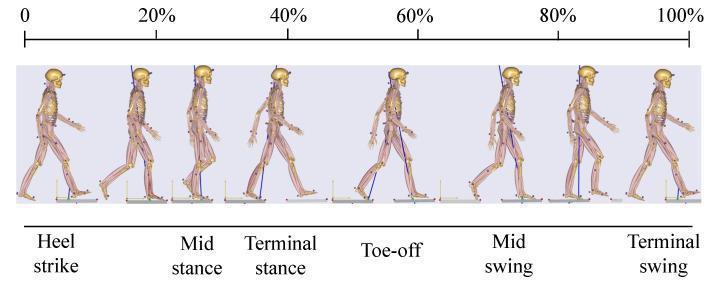
This medical illustration presents a comprehensive analysis of the human gait cycle, depicted through a series of eight anatomical models in a sagittal view. The diagram is structured along a timeline from 0% to 100%, categorizing the motion into distinct stance and swing phases. Key biomechanical events identified include Heel Strike (initial contact), Mid-stance (single limb support), Terminal Stance (heel-off), Toe-off (preswing), Mid-swing, and Terminal Swing. The models demonstrate the dynamic changes in joint kinematics, specifically showing hip flexion and extension, knee flexion/extension for shock absorption and ground clearance, and ankle plantarflexion/dorsiflexion. Markers on the musculoskeletal models indicate points of data collection, likely via inertial measurement units (IMUs), used for gait analysis in rehabilitation or kinesiology. This visual serves as an educational tool for understanding the spatiotemporal parameters of normal walking, often utilized in the development of assistive technologies like soft exosuits and the clinical evaluation of mobility disorders.
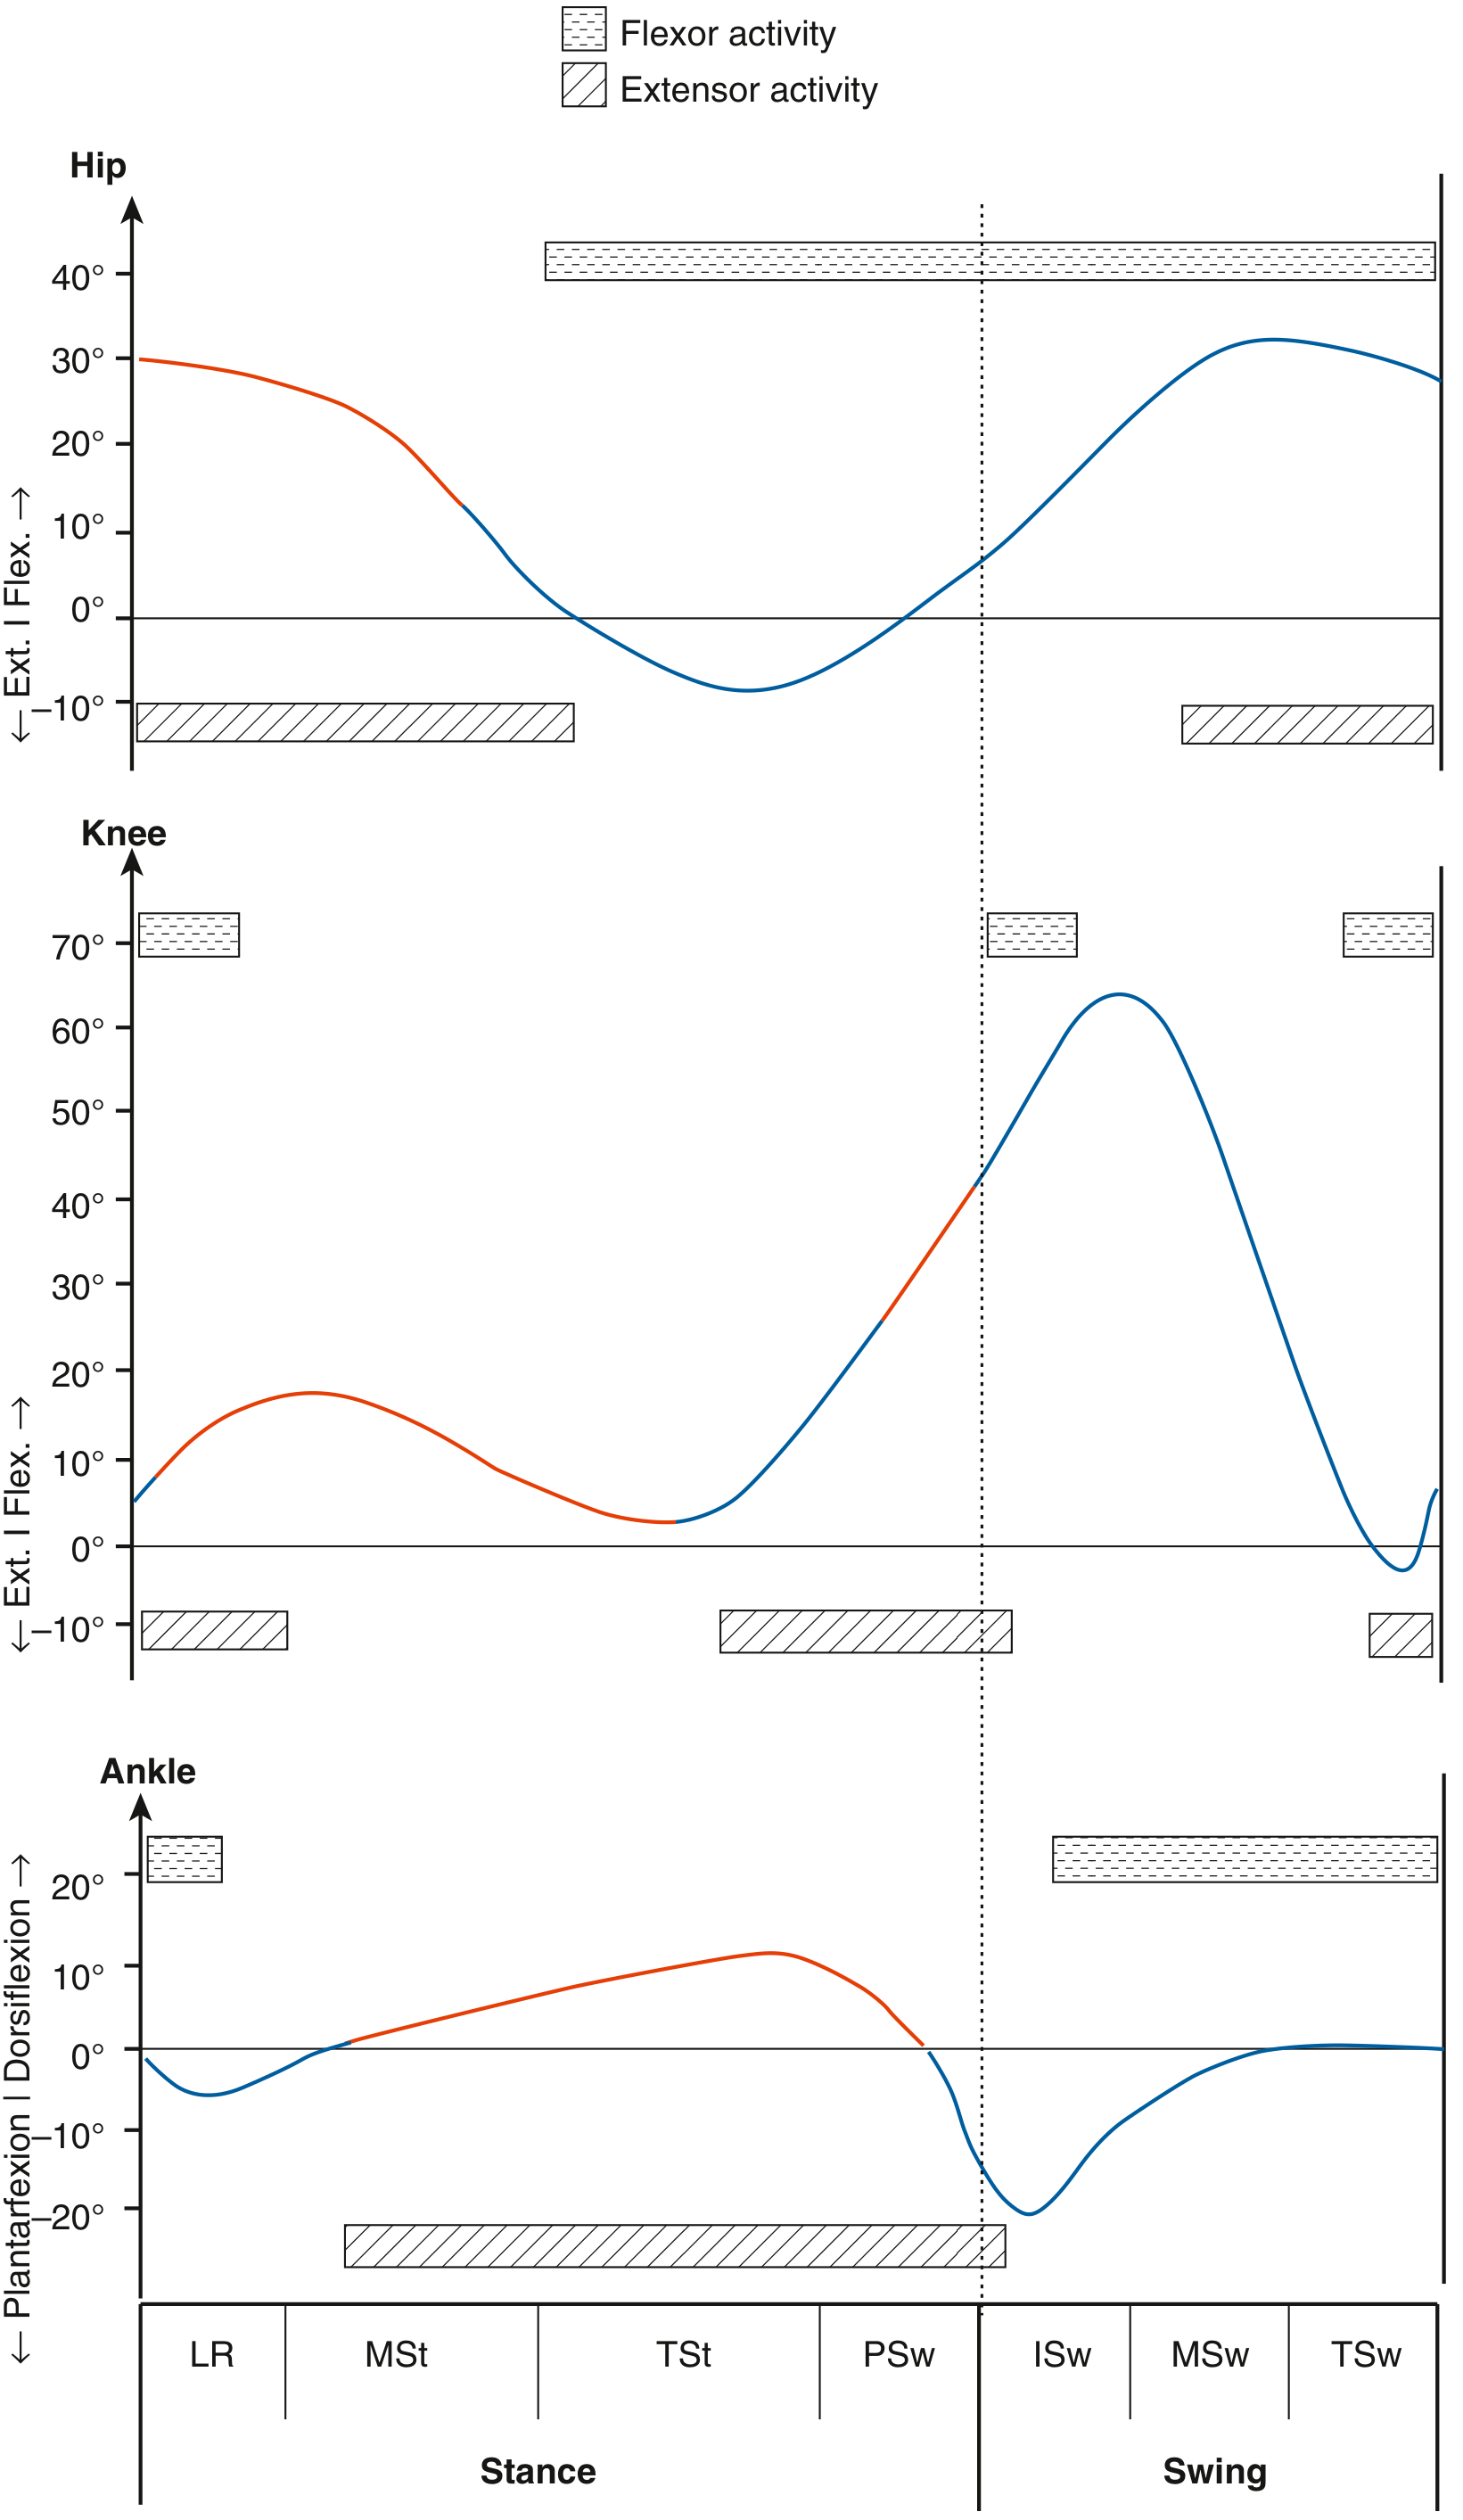
Phases of Gait and Muscles Active in Each Phase
Gait Cycle Overview
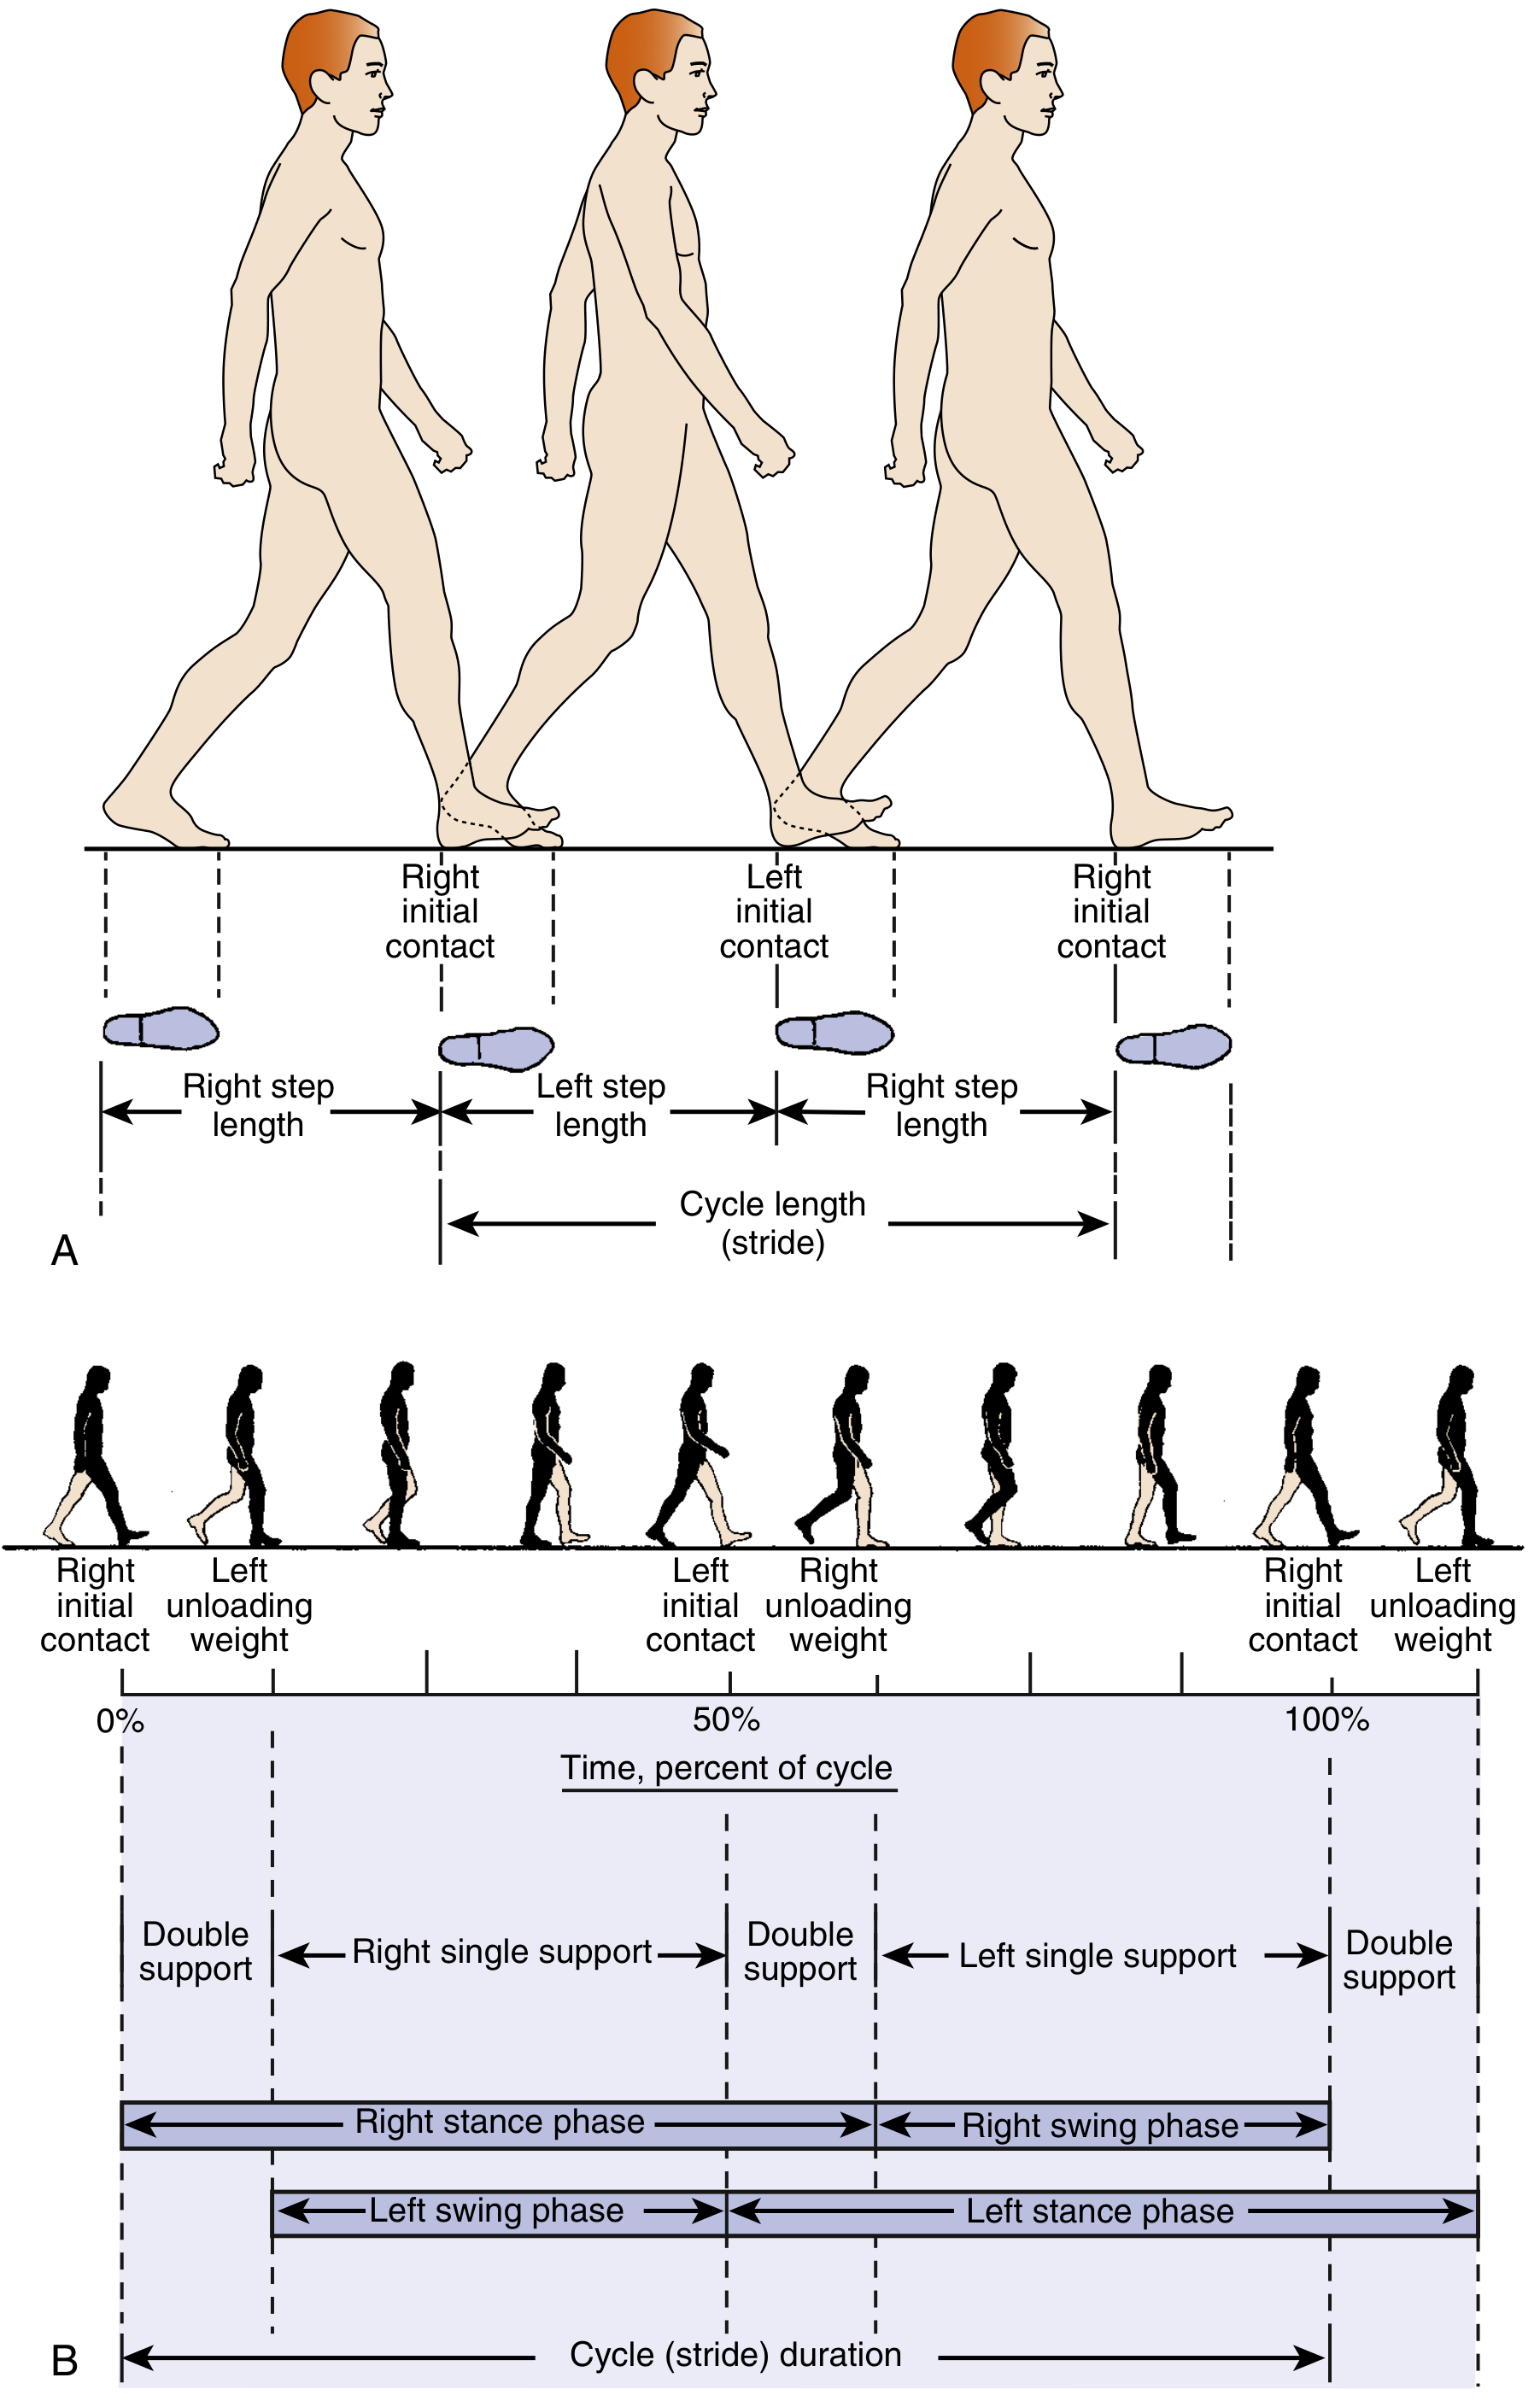
- There are two periods of double-limb support (both feet on ground): at Initial Contact + Loading Response (~10%), and at Preswing (~10%).
- Single-limb support occurs during Midstance and Terminal Stance.
- Vertical displacement of center of gravity = sinusoidal curve, amplitude ~5 cm; lateral displacement ~6 cm.
STANCE PHASE (60% of gait cycle)
1. Initial Contact (IC) - 0%
| Muscle | Action | Purpose |
|---|---|---|
| Tibialis anterior | Eccentric | Controls foot slap - guides foot to ground smoothly |
| Quadriceps | Eccentric | Prevents knee from buckling under load |
| Gluteus maximus | Concentric | Extends hip, stabilizes trunk |
| Hamstrings | Eccentric | Decelerate limb, control hip flexion |
2. Loading Response (LR) - 0-10%
| Muscle | Action | Purpose |
|---|---|---|
| Quadriceps | Eccentric | Stabilizes knee against flexion moment - shock absorption |
| Gluteus maximus | Eccentric/Concentric | Controls trunk lean, powers hip extension |
| Tibialis anterior | Eccentric | Controls forefoot contact |
| Hip abductors (Gluteus medius, minimus) | Eccentric | Prevent contralateral pelvic drop (Trendelenburg) |
3. Midstance (MSt) - 10-30%
| Muscle | Action | Purpose |
|---|---|---|
| Gluteus medius | Eccentric | Controls pelvic tilt (prevents contralateral drop) |
| Soleus / Gastrocnemius | Eccentric | Control forward tibial progression - "ankle rocker" |
| Quadriceps | Isometric/Concentric | Maintain knee extension |
| Hip adductors | Eccentric | Control lateral sway |
4. Terminal Stance (TSt) - 30-50%
| Muscle | Action | Purpose |
|---|---|---|
| Gastrocnemius / Soleus | Concentric | Power heel rise and forward propulsion (push-off) |
| Tibialis posterior | Concentric | Inverts hindfoot, locks transverse tarsal joints to create rigid lever for push-off |
| Flexor hallucis longus | Concentric | Powers toe-off |
| Hip flexors (Iliopsoas) | Beginning concentric | Initiate limb advancement |
5. Preswing (PSw) - 50-60%
| Muscle | Action | Purpose |
|---|---|---|
| Gastrocnemius | Concentric | Final push-off plantar flexion |
| Rectus femoris | Eccentric | Controls rate of knee flexion |
| Iliopsoas | Concentric | Initiates hip flexion to advance limb |
SWING PHASE (40% of gait cycle)
6. Initial Swing (ISw) - 60-73%
| Muscle | Action | Purpose |
|---|---|---|
| Iliopsoas | Concentric | Powers hip flexion, propels limb forward |
| Tibialis anterior | Concentric | Dorsiflexes ankle for foot clearance |
| Biceps femoris (short head) | Concentric | Assists knee flexion |
7. Midswing (MSw) - 73-87%
| Muscle | Action | Purpose |
|---|---|---|
| Tibialis anterior | Concentric | Maintains dorsiflexion for ground clearance |
| Iliopsoas | Concentric | Continues hip flexion |
| Hamstrings | Beginning eccentric activity | Prepare to decelerate the limb |
8. Terminal Swing (TSw) - 87-100%
| Muscle | Action | Purpose |
|---|---|---|
| Hamstrings | Eccentric | Decelerate the limb, control rate of knee extension |
| Quadriceps | Concentric | Extend knee in preparation for IC |
| Tibialis anterior | Eccentric (preparing) | Positions foot for heel strike |
| Gluteus maximus | Eccentric | Decelerates hip flexion, prepares for weight acceptance |
Summary: Major Muscles and Their Role in Gait
| Muscle | Action Type | Phase Active | Function |
|---|---|---|---|
| Gluteus maximus | Concentric | IC, LR | Powers hip extension |
| Gluteus medius/minimus | Eccentric | MSt | Controls pelvic tilt, prevents Trendelenburg |
| Iliopsoas | Concentric | PSw, ISw, MSw | Powers hip flexion, advances limb |
| Hip adductors | Eccentric | Late stance | Control lateral sway |
| Quadriceps | Eccentric | IC, LR | Stabilize knee at initial loading |
| Hamstrings | Eccentric | TSw, IC | Decelerate limb, control knee extension rate |
| Tibialis anterior | Eccentric (IC) / Concentric (Swing) | IC-LR, ISw-MSw | Foot slap control; dorsiflexion for clearance |
| Tibialis posterior | Concentric | TSt | Inverts hindfoot, locks transverse tarsal joints |
| Gastrocnemius/Soleus | Eccentric (MSt) / Concentric (TSt, PSw) | MSt → PSw | Control tibial progression; heel rise and push-off |
| Flexor hallucis longus | Concentric | TSt-PSw | Powers toe-off |
| Rectus femoris | Eccentric | PSw | Controls rapid knee flexion |
Key principle: Most muscle activity in gait is eccentric - muscles actively lengthen to control and decelerate joint motion rather than simply generating force.
Determinants of Gait (6 classic determinants)
- Pelvic rotation - reduces vertical drop of center of mass
- Pelvic tilt (list) - contralateral side drops 5°, reduces superior deviation
- Knee flexion at loading - 15° flexion dampens impact
- Foot and ankle motion - subtalar joint absorbs loading, provides propulsion
- Knee motion - works with foot/ankle to reduce unnecessary limb excursion
- Lateral pelvic displacement control - weight transfer narrows base of support
clinical correlation of lower limb
lower limb nerve injury clinical foot drop Trendelenburg
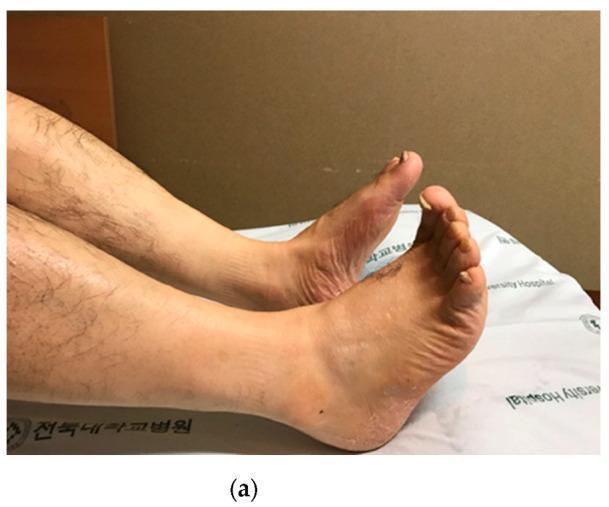
This clinical photograph shows the lower extremities of a 56-year-old male, highlighting signs of a peripheral nerve injury, specifically severe sciatic nerve palsy. The left foot (foreground) demonstrates characteristic 'foot drop' or equinus deformity, where the foot remains in a fixed plantarflexion position with an inability to actively dorsiflex. The skin on the dorsal aspect of the left foot and ankle appears dry, slightly erythematous, and thickened compared to the contralateral limb, suggesting possible autonomic dysfunction or chronic stasis. While the right foot maintains a more neutral posture, the left toes show subtle dorsal deviation. The legs appear otherwise symmetrical in size, with no gross muscle wasting visible from this angle. The visual findings correlate with the patient's clinical history of prolonged compression injury at the mid-thigh level, leading to downstream sensory and motor deficits. This image serves as a clinical example of the physical manifestations of high-level sciatic nerve injury and the secondary orthopedic complications such as equinus contracture.
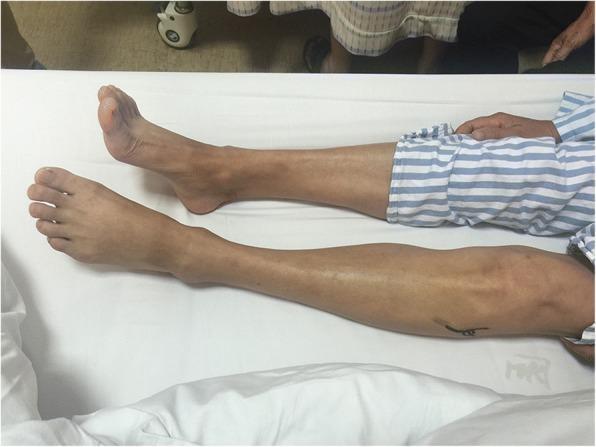
This clinical photograph displays the lower legs of a patient in a supine position, highlighting a unilateral foot drop of the left foot. The right foot maintains a neutral, upright position, whereas the left foot exhibits noticeable plantar flexion and an inability to dorsiflex. Furthermore, significant ecchymoses (bruising) are visible on the lateral aspect of the left knee and proximal calf, localized near the fibular head. These combined clinical signs—acute foot drop and localized trauma markers—are indicative of common peroneal (fibular) nerve palsy, which may result from external compression, trauma, or space-occupying lesions such as an intraneural ganglion cyst. This image serves as an educational example of the neurological and dermatological manifestations associated with peripheral nerve injury in the lower limb.
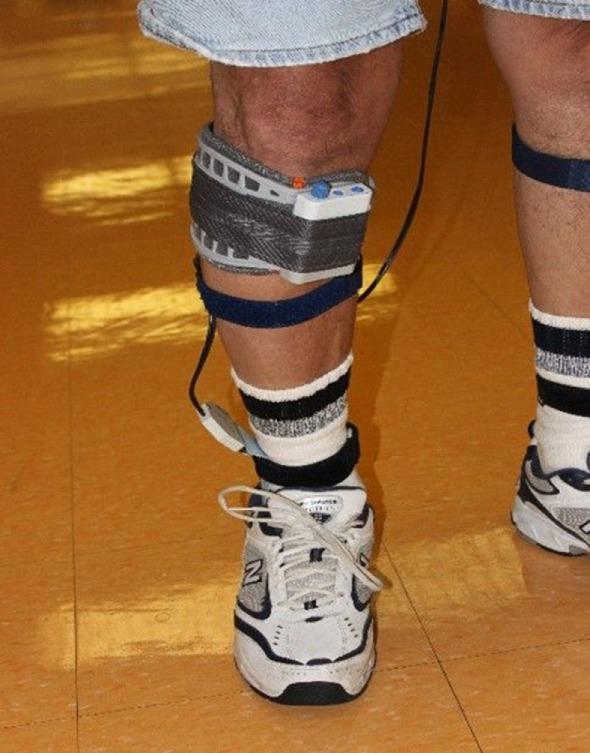
Clinical photograph of a patient's lower limb demonstrating the application of the Walkaide® Functional Electrical Stimulation (FES) system, an orthotic device designed to address foot drop. The device features a battery-operated electronic stimulator unit housed in a white rectangular casing, mounted onto a molded gray and silver textured cuff. This cuff is positioned circumferentially on the proximal lower leg, just below the knee, specifically targeting the lateral aspect near the fibular head to stimulate the common peroneal nerve. A dark blue secondary strap provides additional stabilization below the main unit. A thin black lead wire descends from the stimulator unit to a silver surface electrode positioned near the ankle. The system utilizes tilt sensors and accelerometers to deliver electrical impulses to the dorsiflexor muscles during the swing phase of gait. The image captures the device in a clinical or rehabilitative setting, illustrating the integration of assistive technology with daily wear, including athletic footwear and socks.
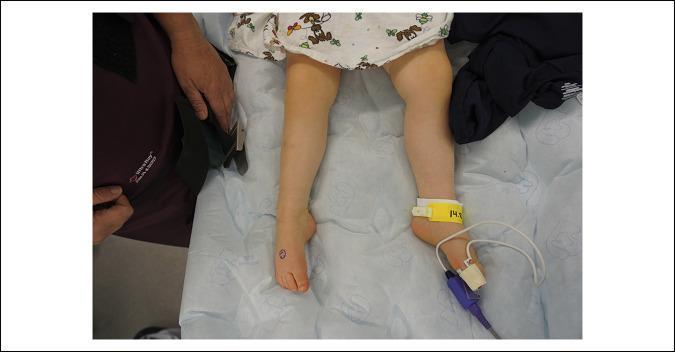
A clinical photograph of a pediatric patient's lower extremities in a supine position, highlighting a comparison between the right and left feet. The patient's right foot exhibits a classic 'foot drop' deformity, characterized by a resting posture of plantarflexion and inversion. This abnormal positioning suggests weakness or paralysis of the ankle dorsiflexors (primarily the tibialis anterior) and evertors, typically associated with common peroneal nerve palsy. In contrast, the left foot maintains a more neutral resting alignment. Visible medical attachments on the right limb include a yellow identification band at the ankle and a pulse oximetry probe secured to the hallux (great toe) with white tape, indicating the patient is undergoing perioperative monitoring. The image serves as a clinical example of lower motor neuron-type paralysis affecting the peroneal distribution, demonstrating how physical exam findings can localize neural compression or injury at the fibular head.
Clinical Correlations of the Lower Limb
1. Femoral Nerve (L2-L4) Injury
Causes
- Prolonged hip flexion (post-abdominal surgery, lithotomy position)
- Psoas muscle hematoma (haemophilia, anticoagulants)
- Compression by lateral retractor blades during pelvic surgery
- After total hip arthroplasty (THA)
- Inguinal lymph node enlargement, pancreatic pseudocyst, psoas tumour
- Subcutaneous injection of glatiramer acetate
Deficits
| Deficit | Mechanism |
|---|---|
| Loss of knee extension | Paralysis of quadriceps femoris |
| Weakness of hip flexion | Loss of iliacus innervation |
| Loss of patellar reflex (L4) | Sensory and motor arc interrupted |
| Sensory loss - anterior thigh, medial leg and foot | Saphenous nerve distribution |
Clinical Sign
- Inability to extend the knee - patient cannot climb stairs or rise from a chair
- Patient may hyperextend the knee (genu recurvatum) as a compensatory mechanism during stance
2. Obturator Nerve (L2-L4) Injury
Causes
- Complicated childbirth (compression by fetal head)
- Pelvic trauma or surgery
- Pelvic lymph node dissection (PLND)
- Lateral transurethral resection (obturator reflex: adductor jerk during TURBT)
Deficits
| Deficit | Mechanism |
|---|---|
| Weakness of thigh adduction | Loss of medial compartment muscles |
| Gait instability | Inability to stabilize leg during swing phase |
| Sensory loss - upper medial thigh | Cutaneous branch of obturator |
| Pain in medial thigh | Irritation of obturator nerve |
Clinical Sign
- Scissors gait tendency - difficulty crossing legs, weakness crossing limb over midline
- Obturator reflex exploited in TURBT: stimulation of obturator nerve by electrical current causes sudden adductor jerk, risking bladder perforation
3. Lateral Femoral Cutaneous Nerve (L2-L3) - Meralgia Paresthetica
Cause
Deficits
| Deficit | Mechanism |
|---|---|
| Pain, burning, paresthesias on lateral thigh | Compression of lateral femoral cutaneous nerve |
| Sensory loss - anterolateral thigh | Nerve territory |
| No motor deficit | Purely sensory nerve |
| No reflex change | No motor component |
Clinical Clue
- Symptoms worse after prolonged walking or standing
- Distinguished from L2/L3 radiculopathy (which would have motor changes and diminished patellar reflex)
- Also called Bernhardt-Roth syndrome
4. Superior Gluteal Nerve (L4-S1) Injury
Causes
- Hip surgery or THA
- Hip fracture or dislocation
- Iliac artery aneurysm
- Misplaced gluteal injections
- Entrapment between piriformis and ilium
Deficits
- Paralysis of gluteus medius, gluteus minimus, and tensor fasciae latae
- Loss of hip abduction and internal rotation
Clinical Sign - Trendelenburg Sign
- Trendelenburg gait (gluteus medius lurch): During the stance phase on the affected side, the trunk lurches toward the affected side to shift the body's center of gravity over the hip (compensatory mechanism). Also called abductor lurch.
- Commonly seen after polio, superior gluteal nerve injury, or hip disorders.
5. Inferior Gluteal Nerve (L5-S2) Injury
Causes
- Hip surgery, posterior hip dislocation, gluteal trauma
Deficits
- Paralysis of gluteus maximus (the main hip extensor and external rotator)
Clinical Sign
- Difficulty rising from seated position and climbing stairs
- Extension lurch gait: Trunk thrown backward during stance phase to compensate for weak hip extension
6. Sciatic Nerve (L4-S3) Injury
Causes
- Posterior hip dislocation (sciatic palsy in ~10% of cases)
- Intramuscular injection into the buttock (misplaced injection)
- Hip surgery (THA) - 80% of post-THA nerve injuries involve the sciatic nerve
- Fracture-dislocation of hip, piriformis syndrome
- Prolonged compression (improper positioning on operating table)
Deficits
| Deficit | Mechanism |
|---|---|
| Loss of all knee flexion (hamstrings) | Posterior thigh involvement |
| Loss of all movement below knee | Leg and foot muscles paralysed |
| Foot drop | Dorsiflexors paralysed |
| Clawing of toes | Intrinsic foot muscles paralysed |
| Sensory loss - entire leg below knee except medial strip | (medial leg spared - saphenous/femoral) |
| Loss of ankle jerk (S1) | Reflex arc interrupted |
Important Note
7. Common Fibular (Peroneal) Nerve (L4-S2) Injury
Causes
- Compression at fibular head - plaster cast, crossed legs, tight stockings, prolonged squatting, lateral knee trauma
- Forcible foot inversion (stretch injury)
- Knee arthroplasty (post-arthroplasty foot drop)
- Intraneural ganglia from superior tibiofibular joint
- Fracture of neck of fibula
Deficits
| Deficit | Mechanism |
|---|---|
| Foot drop | Paralysis of tibialis anterior (deep fibular nerve) |
| Loss of foot dorsiflexion and eversion | Anterior + lateral compartment paralysed |
| Steppage gait | Patient lifts knee high to clear dropped foot during swing |
| Sensory loss - dorsum of foot, dorsolateral leg | Superficial + deep fibular distributions |
| Foot inversion spared | Tibialis posterior (tibial nerve) intact |
Key Differential: Common Fibular Palsy vs. L5 Radiculopathy
| Feature | Common Fibular Palsy | L5 Radiculopathy |
|---|---|---|
| Foot inversion | Normal (tibialis posterior via tibial nerve) | Weak |
| Hip abduction | Normal | May be weak |
| Back/buttock pain | Absent | Often present |
| Ankle jerk | Normal | Normal (S1 is ankle jerk) |
| EMG/NCS | Localizes to fibular head | Shows radiculopathy pattern |
8. Tibial Nerve Injury
Causes
- Popliteal fossa injury/laceration
- Baker's cyst compression
- Tarsal tunnel syndrome (entrapment behind medial malleolus)
Deficits
| Deficit | Mechanism |
|---|---|
| Paralysis of plantar flexors | Gastrocnemius/soleus involvement |
| Clawing of toes | Loss of intrinsic foot muscles |
| Loss of ankle jerk (S1) | Triceps surae denervated |
| Sensory loss - sole of foot | Medial and lateral plantar nerves |
| Inability to stand on tiptoe | Loss of plantar flexion |
Tarsal Tunnel Syndrome
- Entrapment of tibial nerve under the flexor retinaculum behind the medial malleolus
- Pain, burning, and paresthesias in the sole and toes
- Analogous to carpal tunnel syndrome in the upper limb
9. Morton's Metatarsalgia (Digital Nerve Entrapment)
- Tight-fitting shoes compress digital nerves, especially between 3rd and 4th toes
- Burning pain and paresthesias in affected toes
- A palpable neuroma may be felt in the web space (Morton's neuroma)
Quick Reference Summary Table
| Nerve Injured | Level | Classic Sign | Key Deficit |
|---|---|---|---|
| Femoral | L2-L4 | Loss of patellar reflex | Cannot extend knee, cannot climb stairs |
| Obturator | L2-L4 | Weakness of adduction | Medial thigh pain/numbness, gait instability |
| Lateral femoral cutaneous | L2-L3 | Meralgia paresthetica | Anterolateral thigh burning, NO motor loss |
| Superior gluteal | L4-S1 | Trendelenburg sign/gait | Hip abduction weakness, pelvic tilt |
| Inferior gluteal | L5-S2 | Extension lurch | Cannot rise from chair, climb stairs |
| Sciatic | L4-S3 | Global below-knee loss | All movement/sensation below knee lost |
| Common fibular | L4-S2 | Foot drop, steppage gait | No dorsiflexion/eversion; inversion spared |
| Tibial | L4-S3 | Clawing of toes | No plantar flexion; sole anaesthetic |
explain in short the nerve supply of the lower limb
Nerve Supply of the Lower Limb - Short Summary
Lumbar Plexus (L1-L4) - Anterior & Medial Thigh
| Nerve | Roots | Supplies |
|---|---|---|
| Femoral | L2-L4 | Anterior thigh muscles (quadriceps); skin - anterior thigh, medial leg & foot (via saphenous) |
| Obturator | L2-L4 | Medial thigh muscles (adductors); skin - upper medial thigh |
| Lateral femoral cutaneous | L2-L3 | Sensory only - anterolateral thigh |
| Ilio-inguinal | L1 | Sensory - anteromedial upper thigh |
| Genitofemoral | L1-L2 | Sensory - anterior upper thigh |
Sacral Plexus (L4-S4) - Posterior & Gluteal
| Nerve | Roots | Supplies |
|---|---|---|
| Sciatic | L4-S3 | Largest nerve; posterior thigh muscles; divides into: |
| - Tibial | L4-S3 | Posterior leg, sole of foot |
| - Common fibular | L4-S2 | Anterior & lateral leg, dorsum of foot |
| Superior gluteal | L4-S1 | Gluteus medius, minimus, TFL |
| Inferior gluteal | L5-S2 | Gluteus maximus only |
| Posterior femoral cutaneous | S1-S3 | Sensory - posterior thigh |
One-Line Rule
- Femoral = anterior thigh
- Obturator = medial thigh
- Sciatic = posterior thigh + everything below the knee
- Saphenous (femoral branch) = only nerve to reach the medial foot without sciatic input