Hb electrophoresis
Reading File
Finding Sources
Finding Sources
Reading File
Reading File
Loading Image
Loading Image
Finding Sources
Reading File
Reading File
Loading Image
I now have all the information needed for a thorough, well-illustrated answer. Here is the complete breakdown:
Hemoglobin Electrophoresis
Principle
Hemoglobin electrophoresis separates Hb variants based on molecular charge and size in an electric field. At alkaline pH, hemoglobins are negatively charged and migrate toward the anode (+). The speed of migration depends on the net charge of each variant - amino acid substitutions that alter charge (e.g., Glu → Val in HbS) shift the band position.
Methods
1. Alkaline Electrophoresis (pH 8.6) - Cellulose Acetate
The standard first-line test. Migration from cathode (-) toward anode (+):
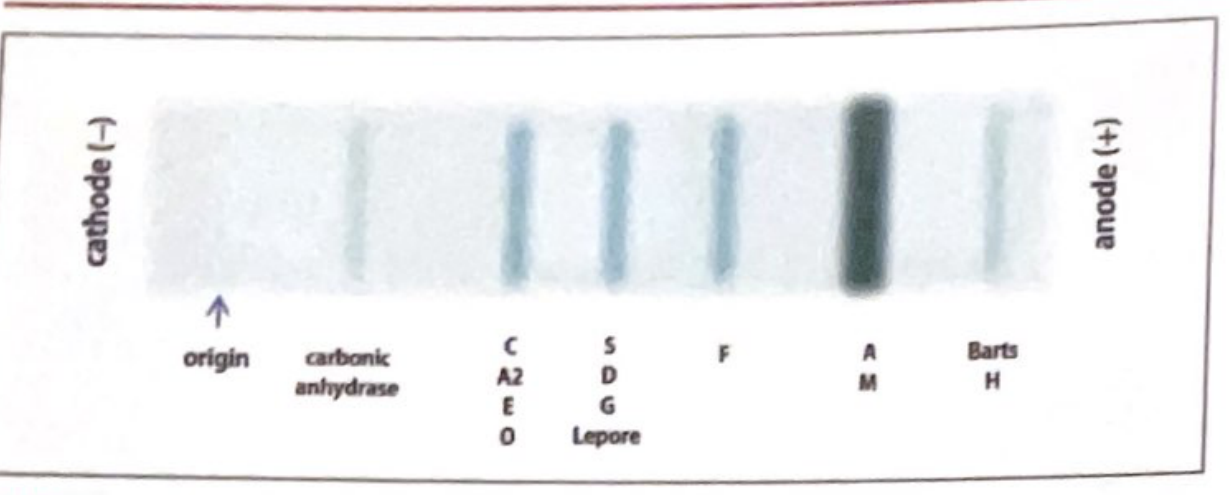
Band positions (slowest to fastest toward anode):
| Band Position | Hemoglobins |
|---|---|
| C band (slowest) | HbC, HbA2, HbE, HbO |
| S band | HbS, HbD, HbG, Hb Lepore |
| F band | HbF |
| A band (fastest common) | HbA, HbM |
| Fast (beyond A) | Hb Barts, HbH |
Key limitation: Cannot distinguish HbS from HbD, HbG, or Hb Lepore. HbC, HbA2, HbE, and HbO all co-migrate at the C band.
2. Acid Electrophoresis (pH 6.2) - Citrate Agar
Used as a confirmatory/complementary test when alkaline results are ambiguous:
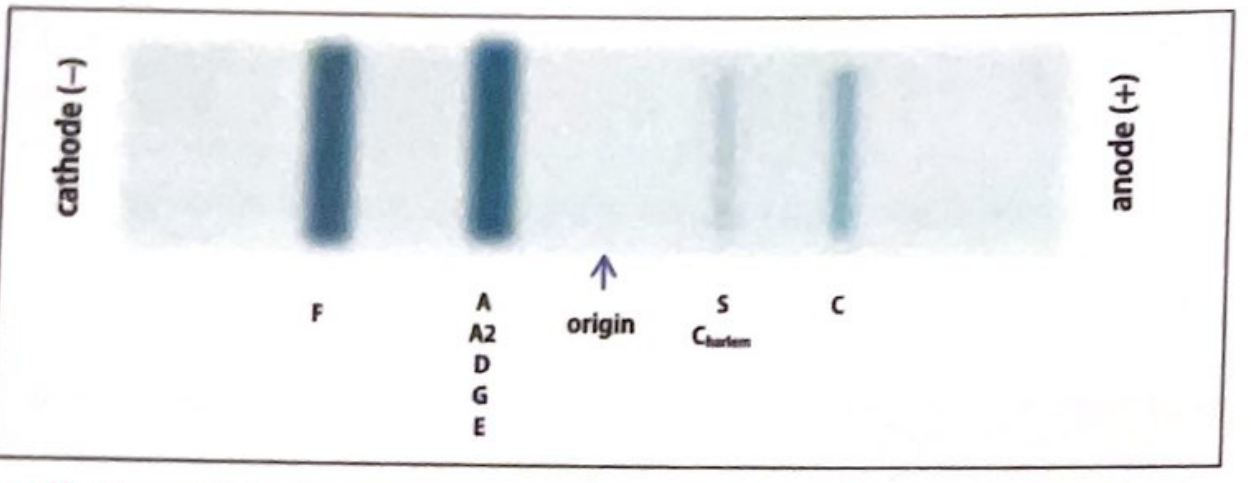
Key differentiations at acid pH:
- HbS and HbC are now clearly separated from each other
- HbA, HbA2, HbD, HbG, and HbE all co-migrate in the A/A2 position
- HbF moves toward the cathode (separate from HbA)
- A band at S on alkaline: if it migrates to A position on acid, it is HbD/G/Lepore (not HbS); if it stays at S, it confirms HbS
3. Migration Mechanism (Lippincott Biochemistry)
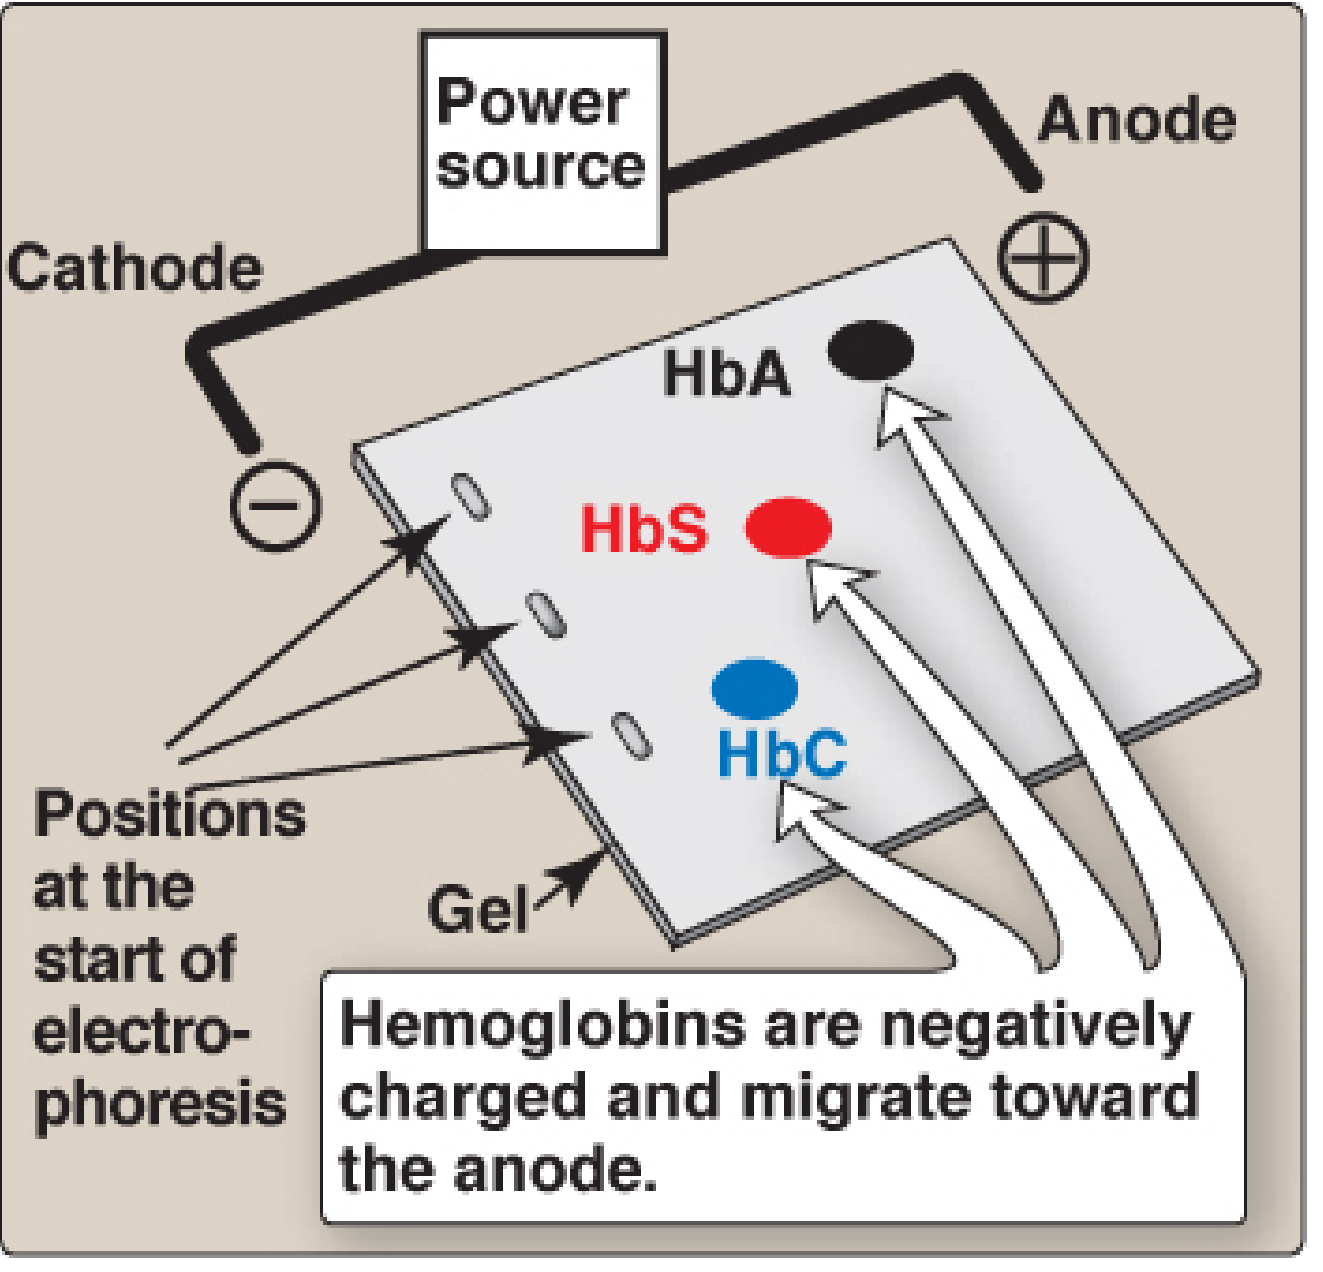
- HbS: Glu → Val substitution at β-chain position 6 removes two negative charges, making HbS less negative than HbA → migrates slower toward anode
- HbC: Glu → Lys substitution at β-chain position 6 adds a positive charge → migrates even slower than HbS
- Migration order at alkaline pH: HbA (fastest) > HbF > HbS > HbC (slowest)
Normal Adult Pattern
- >97% HbA (α2β2)
- <3% HbA2 (α2δ2) - seen in the C band
- No other bands
- Normal: HbF is <1% in adults
Interpretation of Common Patterns
| Pattern | Interpretation |
|---|---|
| Predominantly HbA, small HbA2 (<3%) | Normal |
| HbA + HbA2 elevated (>3.5%) | β-thalassemia trait |
| HbA + HbA2 (normal) + thalassemic indices | α-thalassemia (HbA2 normal in α-thal) |
| HbA + HbS (~40% S) | Sickle cell trait (AS) |
| HbS only (~90%) + no HbA | Sickle cell disease (SS) or Sβ⁰-thal |
| HbS + HbC (roughly equal) | HbSC disease |
| HbS + HbA + HbA2 (HbA present) | Sβ⁺-thalassemia |
| HbF only | β-thalassemia major or HPFH |
| HbA + HbC (~40%) | HbC trait |
Neonatal Hb Electrophoresis Patterns (Harriet Lane)
Variants are reported in order of decreasing abundance (e.g., FA = more F than A):
| Pattern | Meaning |
|---|---|
| FA | Normal newborn (HbF predominant, some HbA) |
| FAS | Sickle cell trait (benign) |
| FS | Sickle cell disease (SS) or Sβ⁰-thal - clinically significant |
| FSC | HbSC disease - clinically significant |
| FSA | Sβ⁺-thalassemia - clinically significant |
| FC | Homozygous HbC (mild disorder) |
| FAC | HbC trait (benign) |
| F only | β-thalassemia major or HPFH |
| AF | Likely prior transfusion - repeat at 4 months |
Newborn screening for sickle cell is mandatory in many states; positive sickle prep tests must be confirmed with electrophoresis or isoelectric focusing.
Advanced / Modern Methods
Isoelectric Focusing (IEF)
- Greater resolving power than conventional electrophoresis
- Separates HbD and HbG from each other and from HbS (which alkaline electrophoresis cannot)
- Hemolysate migrates to its isoelectric point in a pH gradient (pH 6.0-8.0)
- Limitation: temperature-sensitive, cannot accurately quantify HbA2 and HbF at low concentrations
Capillary Electrophoresis (CE)
- Automated, can accurately quantify low HbA2 levels and HbE levels separately
- HbC still co-migrates with HbA2 in this method
- High throughput, widely used in newborn screening programs
HPLC (High Performance Liquid Chromatography)
- Gold standard for quantification (especially HbA1c, HbA2, HbF)
- Separates by ion exchange chromatography
- Limitation: cannot separate HbS from HbD on alkaline electrophoresis, but HPLC handles this well
- Peaks noted in S and C positions in HbSC disease
Globin Chain Electrophoresis
- Individual globin chains are dissociated using dithiothreitol and urea, then run at both acidic and alkaline pH
- Used to determine whether a variant involves the α chain or β chain
- Useful for characterizing novel/rare variants
Clinical Significance Summary
| Disease | Electrophoresis Finding |
|---|---|
| Sickle cell anemia | HbS ~90%, no HbA |
| Sickle cell trait | HbA ~60%, HbS ~40% |
| HbSC disease | HbS ~50%, HbC ~50% |
| β-thalassemia major | HbF predominant, HbA2 elevated, no/little HbA |
| β-thalassemia trait | HbA2 >3.5%, mild elevation HbF |
| α-thalassemia | Normal HbA2, normal electrophoresis (diagnosis by molecular/MCH) |
| HPFH | HbF elevated (up to 100% in homozygous), HbA2 normal |
| HbC disease | HbC ~90%, no HbA |
Sources: Quick Compendium of Clinical Pathology 5th ed., p. 13495-13513 | Lippincott Biochemistry 8th ed., p. 122 | Harriet Lane Handbook 23rd ed., p. 477 | Tietz Textbook of Laboratory Medicine 7th ed.
This is a shared conversation. Sign in to Orris to start your own chat.