
Principles of growth and development pediatrics
pediatric growth development milestones chart
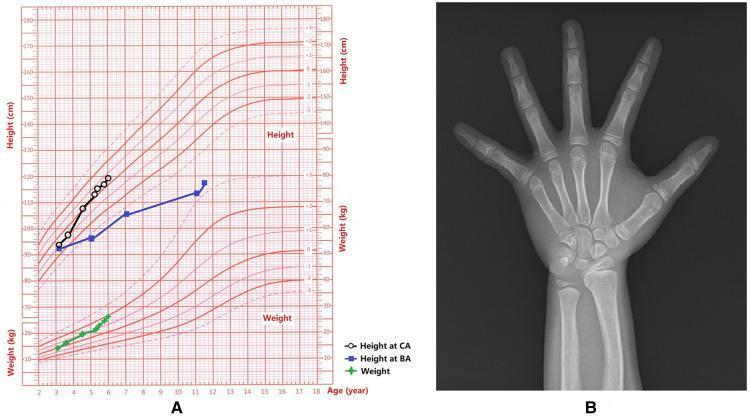
This composite educational graphic contains two panels documenting a pediatric patient's growth and skeletal development. Panel A is a standardized Growth Chart plotting height and weight against age (2 to 18 years). It tracks three parameters: Height at Chronological Age (CA) shown by open circles, Height at Bone Age (BA) shown by blue squares, and weight shown by green plus signs. The data indicates an accelerated growth velocity where BA significantly exceeds CA, and height and weight trend above the standard deviation curves. Panel B is a posterior-anterior (PA) view diagnostic X-ray of the left hand and wrist used for bone age assessment. The radiograph demonstrates a bone age advanced beyond the chronological age of 5.3 years (to approximately 10.5 years). Morphological findings include a slight Madelung deformity, characterized by a shortened radius with a volar and ulnar tilt of the distal radial articular surface and relative prominence of the distal ulna. The carpal bones show advanced ossification consistent with the BA assessment.
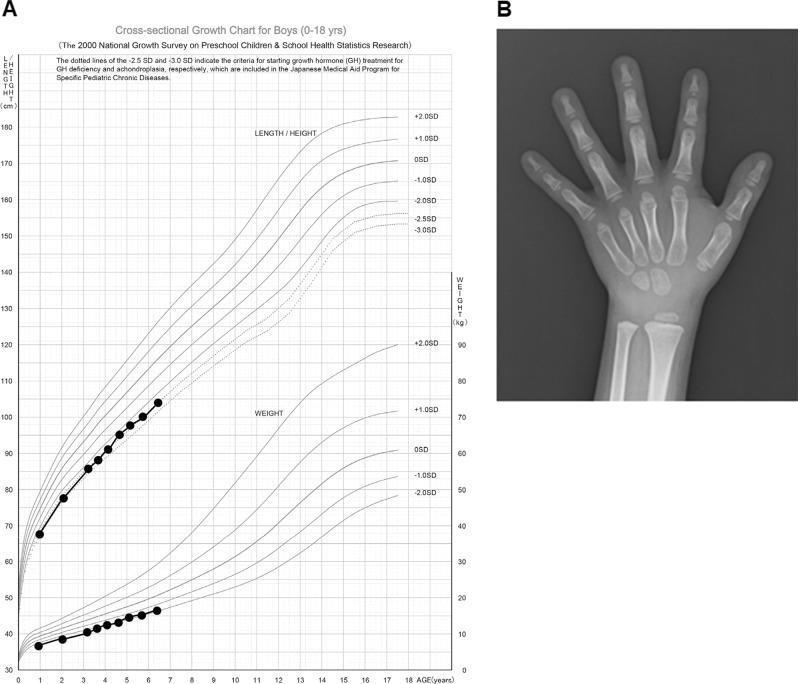
This composite educational figure illustrates the clinical assessment of pediatric growth and skeletal maturation. Panel A displays a cross-sectional growth chart for boys (ages 0-18 years) depicting length/height and weight trajectories. The patient’s data points, plotted against standard deviation (SD) curves, show persistent short stature with height tracking below the -2.0 SD line, reaching approximately -2.4 SD at age 7. Panel B is a posterior-anterior (PA) diagnostic radiograph of the left hand and wrist used for bone age assessment. Visible anatomical structures include the distal radius and ulna, carpal bones, metacarpals, and phalanges. Key educational features include the presence of open epiphyseal plates (growth plates) and specific ossification centers. In this clinical context, the radiograph demonstrates delayed bone maturation, where the skeletal development corresponds to a bone age significantly younger (3-year delay) than the patient’s chronological age of 7 years. This combination of growth velocity tracking and bone age radiography is a primary diagnostic approach in evaluating pediatric endocrine and genetic conditions such as NBAS mutation-based diseases.
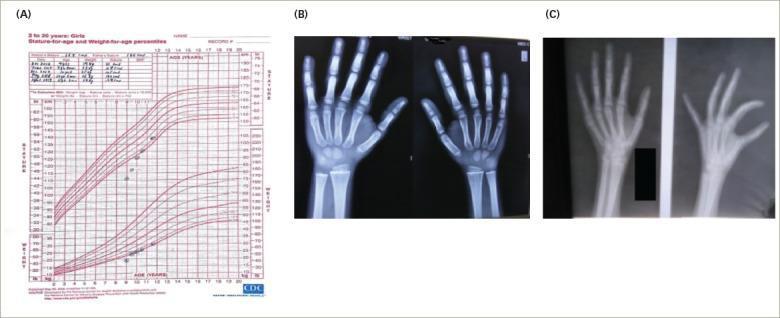
This composite educational image illustrates a basic endocrine work-up for a pediatric patient, likely related to growth hormone deficiency or constitutional growth delay. Panel A presents a standardized CDC growth chart for girls (2 to 20 years) plotting stature-for-age and weight-for-age. Longitudinal data points show the patient tracking consistently below the 3rd percentile for both height and weight, indicating significant growth failure. Panels B and C are comparative pediatric hand and wrist X-rays used for bone age assessment. Panel B (at diagnosis) shows carpal and epiphyseal development that typically assists in determining skeletal maturation relative to chronological age. Panel C (12 months post-treatment) provides a follow-up comparison to assess the rate of skeletal advancement following medical intervention. The diagnostic images highlight key anatomical structures including phalanges, metacarpals, carpal bones, and distal radius/ulna epiphyses. This material is designed for teaching clinical evaluation of endocrine-mediated growth disorders and the utility of serial growth monitoring and radiographic bone age studies.
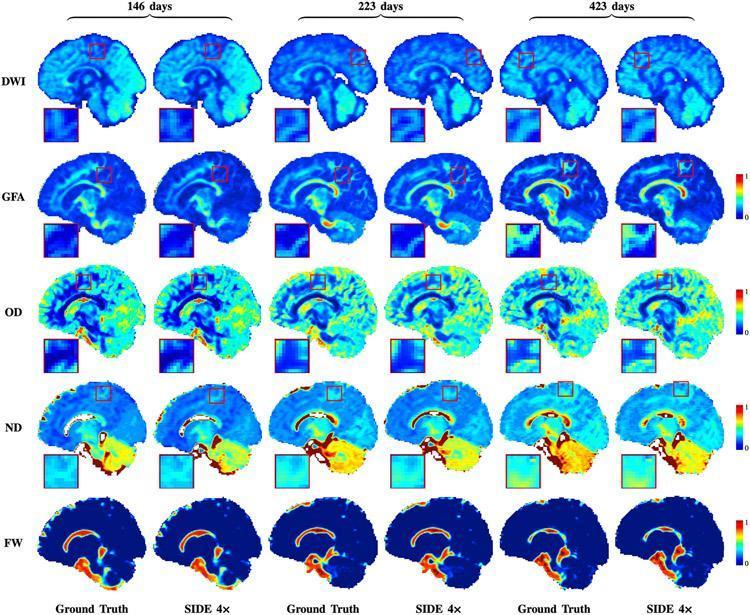
A comparison chart of sagittal pediatric brain MRI scans illustrating the progression of neural development at three time points: 146, 223, and 423 days after birth. The image displays five rows of diagnostic metrics: Diffusion Weighted Imaging (DWI), Generalized Fractional Anisotropy (GFA), Orientation Dispersion (OD), Neurite Density (ND), and Free Water (FW). For each time point, 'Ground Truth' data is compared side-by-side with 'SIDE 4x' reconstructions (undersampled by factor 4). The scans demonstrate longitudinal changes in brain size, morphological maturation, and white matter tract development. Color-coded heatmaps (blue for low values, red for high) visualize quantitative microstructural parameters. Key developmental milestones shown include increasing Neurite Density (ND) and more defined GFA signals in the corpus callosum and brainstem as the infant ages. Each scan includes a red boxed inset providing high-magnification detail of a cortical region, highlighting the fidelity of the SIDE 4x reconstruction method in maintaining structural details compared to the fully sampled ground truth.
developmental milestones motor gross fine language social infant toddler
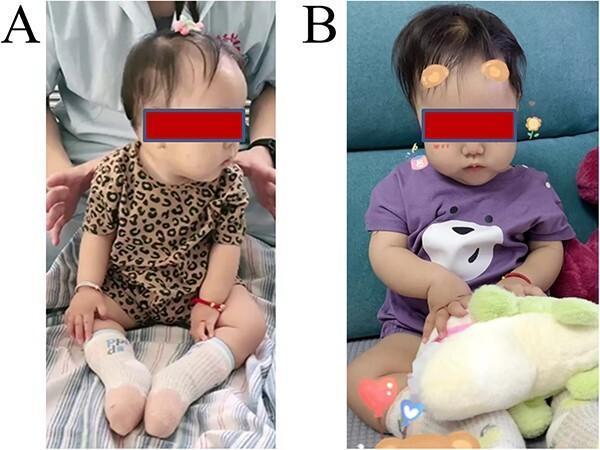
Two-panel clinical photograph (A and B) demonstrating the gross motor development and therapeutic progress of a pediatric patient with Spinal Muscular Atrophy (SMA) post-risdiplam treatment. Image A shows the infant at 3 months post-treatment, achieving the milestone of sitting for approximately 5 seconds without direct assistance, although caregiver hands remain in close proximity to monitor trunk stability. The patient exhibits characteristic features of SMA-related hypotonia but shows improving axial strength. Image B shows the same patient 7 months post-treatment, demonstrating significant clinical improvement in postural control and fine motor skills. The infant is now sitting independently and stably on a couch for over 2 minutes, actively engaging in play with a plush toy. This transition illustrates the functional efficacy of SMN2-directed therapy in improving neuromuscular scores (CHOP-INTEND) and achieving developmental milestones such as unassisted sitting and manual exploration of the environment.

This clinical visual consists of a series of four animation keyframes used as an illustrative re-enactment for behavioral assessment studies. The images depict an infant (approximately 6-9 months old) and a small domestic dog on a patterned rug indoors. The sequence demonstrates developmental milestones related to gross motor skills and social interaction. Specifically, it captures the infant in a prone position, exhibiting crawling behaviors and functional mobility. From a pediatric developmental perspective, the sequence illustrates ‘tummy time’ dynamics, head control, and the infant's ability to engage with a mobile environmental stimulus (the dog). Key visual features include the child's reaching motions, social referencing (looking toward the animal), and the transition between static prone positioning and active crawling. This material is typically utilized in medical education to study infant behavior, motor development, and human-animal interaction within a domestic setting.

Clinical photograph of a 4.8-month-old infant demonstrating early motor development through an independent standing task. The infant is positioned on a buoyant blue corkboard held by an instructor over a pool of water, providing a moderately stable but dynamic base of support. Visually, the infant exhibits high-guard arm positioning—abducted and extended—to maintain balance, characteristic of early postural control development. The lower extremities are slightly flexed at the knees and hips, with a neutral foot placement to stabilize the center of gravity. The infant's gaze is directed downward, indicating visual engagement with the supporting surface to assist proprioceptive feedback. This image is used in pediatric developmental assessments to illustrate gross motor milestones, specifically the emergence of weight-bearing and trunk stability in the pre-walking phase. The setting and skin appearance suggest an aquatic therapy or infant swimming context, highlighting the role of environmental factors and external support in eliciting advanced motor responses.
Principles of Growth and Development in Pediatrics
1. Definitions
- Optimal nutrition
- Freedom from recurrent infections
- Freedom from adverse genetic and environmental influences
2. General Principles of Growth and Development
| Principle | Description |
|---|---|
| Cephalocaudal direction | Development proceeds from head downward (head control before trunk before leg control) |
| Proximodistal direction | Development proceeds from central to peripheral (trunk before limbs before fingers) |
| Simple to complex | Simple skills precede complex ones |
| Continuous process | Growth never stops, but rate varies |
| Critical periods | Specific windows when exposure or deprivation has maximal effect |
| Individual variation | Children vary in rate but follow the same sequence |
3. Determinants of Growth and Development
- Genetic inheritance - Influences height, weight, mental, and social development; personality traits
- Nutrition - Before AND after birth; growth retardation is an early indicator of malnutrition
- Age - Growth rate is maximum during fetal life, the first year of life, and at puberty
- Sex - Girls experience a growth spurt around age 10-11 years; boys slightly later at 12-13 years
- Physical surroundings - Sunshine, good housing, lighting, ventilation
- Psychological factors - Love, tender care, and proper child-parent relationships affect social, emotional, and intellectual development
- Infections and parasitosis - Intrauterine infections (rubella, syphilis) affect fetal growth; postnatal infections (diarrhea, measles) and intestinal parasites slow growth
- Economic factors - Standard of living affects nutrition and overall health
- Other factors - Birth order, birth spacing, birth weight, parental education
4. Age-Specific Growth Patterns
Fetal Period
- Most rapid period of overall growth
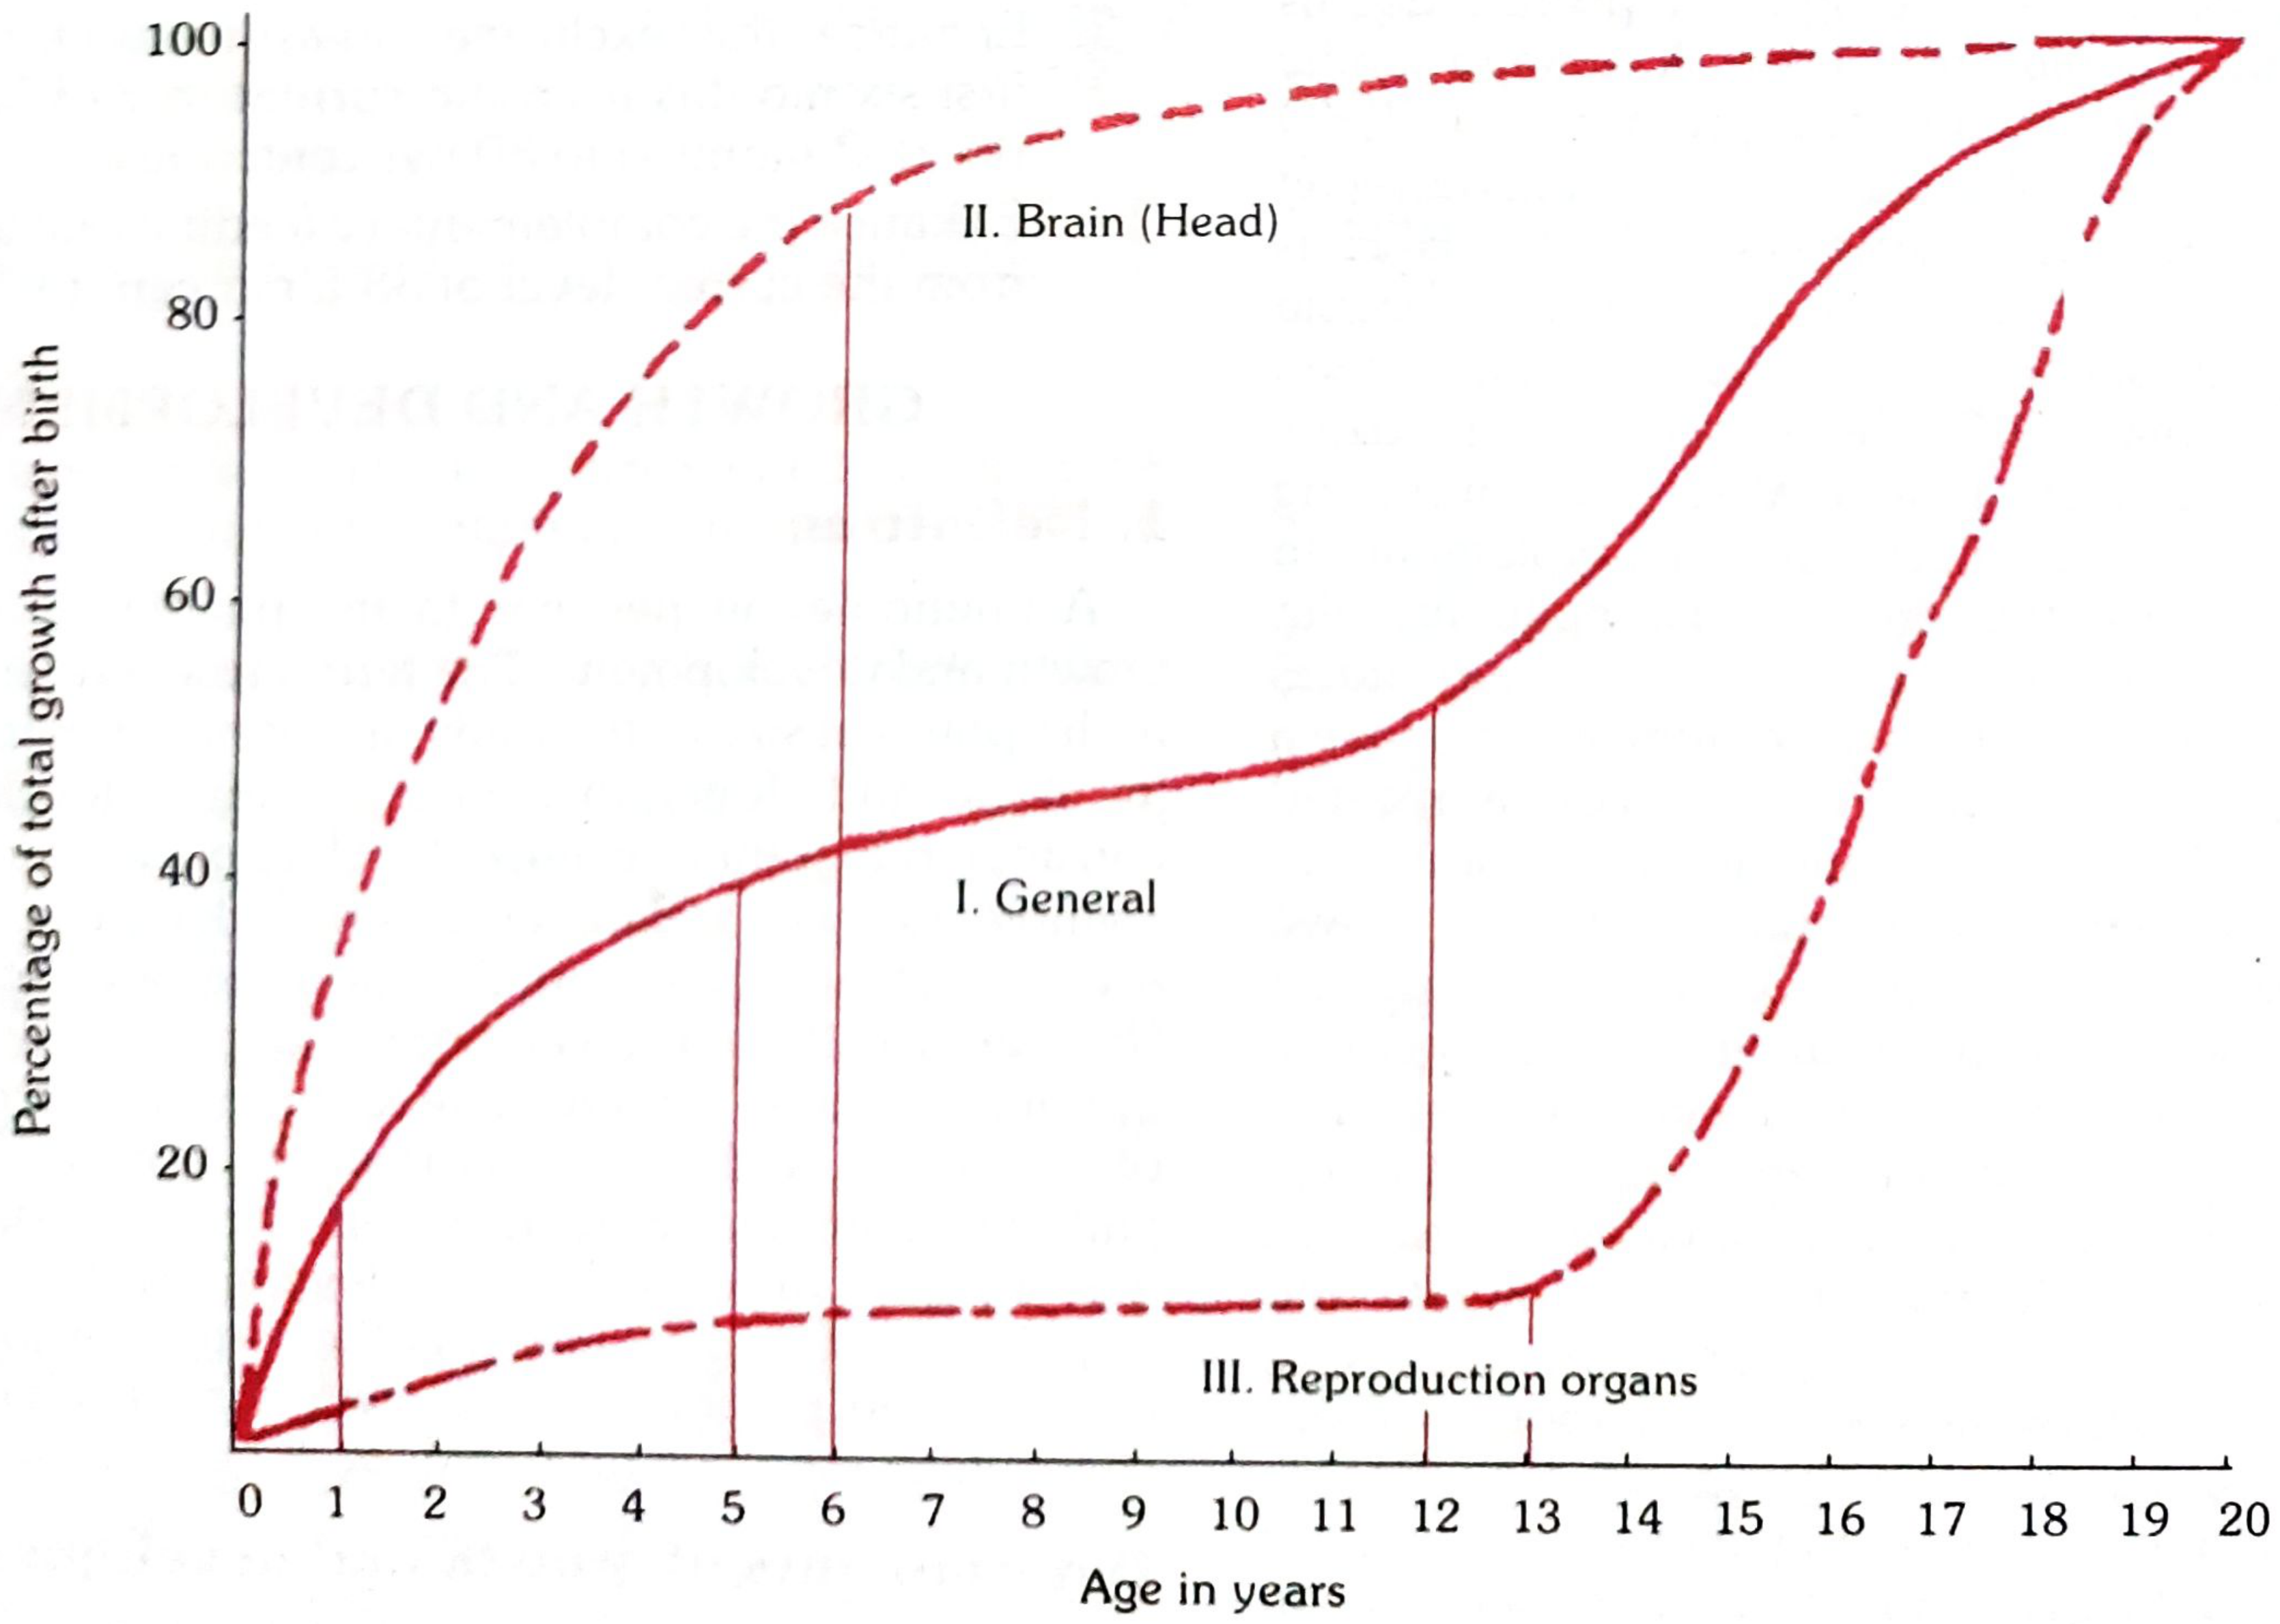
- Brain growth is spectacular - 90% of adult brain cell number is achieved by age 2 years
Infancy (0-1 year)
- Weight: Birth weight doubles by ~5 months, triples by 1 year (~10 kg)
- Length: Increases ~25 cm in first year
- Head circumference: Grows ~12 cm in first year (most rapid head growth)
- Fontanelles: Posterior closes by 6-8 weeks; anterior by 12-18 months
Toddler / Pre-school (1-5 years)
- Growth rate slows but remains steady
- Weight gain ~2 kg/year
- Height gain ~6-8 cm/year
- 20 deciduous (milk) teeth complete by ~2.5 years
School age (6-10 years)
- Steady, slow growth ~5-6 cm/year
- Cognitive and social development predominant
Puberty (Adolescence)
- Second major growth spurt
- Girls: 10-11 years (menarche ~12-13 years)
- Boys: 12-13 years (later, but greater magnitude)
- Peak height velocity ~8-10 cm/year
5. Developmental Milestones
A. Gross Motor
| Age | Milestone |
|---|---|
| 2 months | Holds head momentarily |
| 4 months | Head steady; pushes up on forearms |
| 6 months | Sits with support; rolls over |
| 9 months | Sits without support; stands with support |
| 12 months | Walks with one hand held |
| 15 months | Walks independently |
| 18 months | Runs; climbs stairs with support |
| 2 years | Runs well; up/down stairs |
| 3 years | Jumps; rides tricycle |
| 5 years | Skips; hops on one foot |
B. Fine Motor / Adaptive
| Age | Milestone |
|---|---|
| 3 months | Hands open; grasp reflex fading |
| 6 months | Palmer grasp of objects |
| 9 months | Pincer grasp developing |
| 12 months | Neat pincer grasp |
| 15 months | Builds tower of 2 cubes |
| 18 months | Scribbles; tower of 3-4 cubes |
| 2 years | Tower of 6 cubes; circular scribble |
| 3 years | Copies circle |
| 4 years | Copies cross |
| 5 years | Copies square; draws human figure |
C. Language
| Age | Milestone |
|---|---|
| 2 months | Cooing, social smile |
| 4-6 months | Babbling |
| 9-10 months | "Mama," "dada" (non-specific) |
| 12 months | 1-2 meaningful words |
| 18 months | 7-20 words; jargon |
| 2 years | 2-word phrases; ~200 words |
| 3 years | Short sentences; 3-word phrases |
| 4-5 years | Complete sentences; asks questions |
D. Social / Personal
| Age | Milestone |
|---|---|
| 6 weeks | Social smile |
| 3 months | Recognizes mother |
| 6-9 months | Stranger anxiety begins |
| 12 months | Waves bye-bye; plays pat-a-cake |
| 18 months | Feeds self with spoon |
| 2 years | Parallel play |
| 3 years | Group play; cooperative play |
| 4-5 years | Dresses/undresses self |
6. Concept of Normality
7. Methods of Growth Assessment
- Mean/median method - Variation of ±2 SD is within normal limits; skewed distributions use the median
- Percentile (centile) method - Easier to understand; 3rd to 97th centile = "normal" range (94% of children); 6% outside this range are not necessarily abnormal if growing parallel to centile lines
- Age-independent indices - Weight-for-length, weight-for-height (useful when age is unknown)
- Longitudinal - Same child measured at regular intervals (shows individual growth trajectory)
- Cross-sectional - Children of same age measured at one point (comparison with peers)
8. Parameters of Physical Growth Measurement
| Parameter | Key Points |
|---|---|
| Weight-for-age | Most sensitive single parameter; best to do serial measurements |
| Height (length)-for-age | Indicates long-term/chronic nutrition (stunting if < -2 SD) |
| Weight-for-height | Age-independent; detects wasting (acute malnutrition); < 70% of expected = severe wasting |
| Head circumference | Reflects brain growth; critical in infancy |
| Chest circumference | At birth, head > chest; by 1 year they are equal |
| BMI-for-age | Used for detecting overweight/obesity in older children |
9. Growth Standards and Reference Values
- Harvard (Boston) Standards - Based on North European children, 1930-1956; widely used historically
- WHO Reference Values - Replaced Harvard; based on NCHS data; used for children up to 5 years
- WHO Child Growth Standards (2006) - Generated from the Multicentre Growth Reference Study (MGRS, 1997-2003), covering children from Brazil, Ghana, India, Norway, Oman, and USA (9,440 breast-fed infants); now the gold standard internationally; adopted by India in February 2009
10. Growth Chart (Road-to-Health Chart)
- Visual display of a child's physical growth over time
- Used for longitudinal monitoring (growth monitoring)
- Weight-for-age: does not account for height, but is the most sensitive measure
- Direction of growth is more important than position on the chart
- Flattening or falling of weight curve = growth failure = earliest sign of protein-energy malnutrition (PEM), preceding clinical signs by weeks or months
- Growth monitoring - identifies faltering early
- Tool for health education (feeding, infections)
- Guides nutrition interventions
- Evaluates effectiveness of child care programs
- Facilitates communication between health workers and mothers
11. Surveillance of Growth and Development
- Recommended intervals: Monthly from birth to 1 year; every 2 months in 2nd year; every 3 months up to 5 years
- Purpose: Identify children not growing normally; reflect effectiveness of nutrition, sanitation, and infection control
- India's Mother and Child Protection (MCP) Card integrates growth charting, immunization record, developmental milestones, and feeding guidance
12. Common Child Health Problems Related to Growth
- Low birth weight (< 2,500 g) - Major risk for growth failure
- Malnutrition - Most widespread; ~35.7% of Indian children under 5 are underweight; 38.4% stunted; malnutrition underlies 45% of deaths under age 5
- Stunting (low height-for-age) - Chronic malnutrition
- Wasting (low weight-for-height) - Acute malnutrition; increased mortality risk
- Infections/parasitosis - Create a vicious cycle with malnutrition
- Behavioral/developmental problems - Often linked to psychological deprivation