
regulation on respiration
regulation of respiration respiratory control center diagram
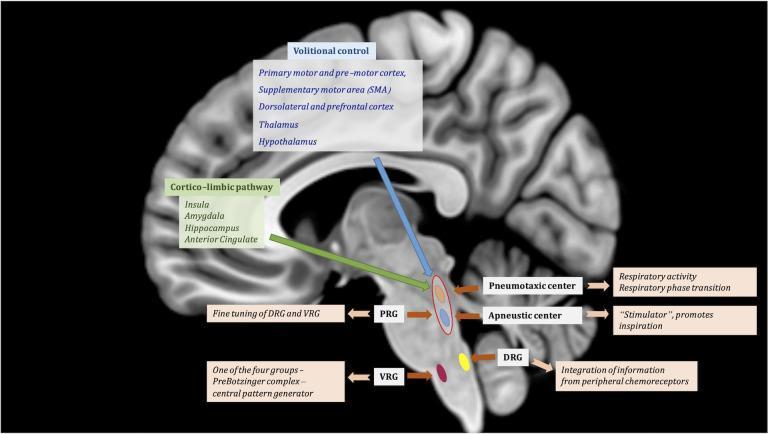
This medical illustration features a T1-weighted sagittal MRI of the human brain overlaid with a diagram of the central regulation of respiratory function. The graphic outlines two primary suprapontine pathways: the 'Volitional control' pathway (originating from the motor cortex, SMA, and thalamus/hypothalamus) and the 'Cortico-limbic pathway' (originating from the insula, amygdala, and hippocampus), both descending toward the brainstem. Within the pons, the Pontine Respiratory Group (PRG) is highlighted, comprising the Pneumotaxic center (responsible for respiratory phase transition) and the Apneustic center (a stimulator promoting inspiration). These centers exert fine-tuning over the medullary respiratory groups. In the medulla, the illustration identifies the Dorsal Respiratory Group (DRG), which integrates peripheral chemoreceptor information, and the Ventral Respiratory Group (VRG), specifically noting the PreBötzinger complex as the central pattern generator. The diagram effectively illustrates the hierarchical neuroanatomical structure of breathing regulation, from cortical modulation to autonomic brainstem control.
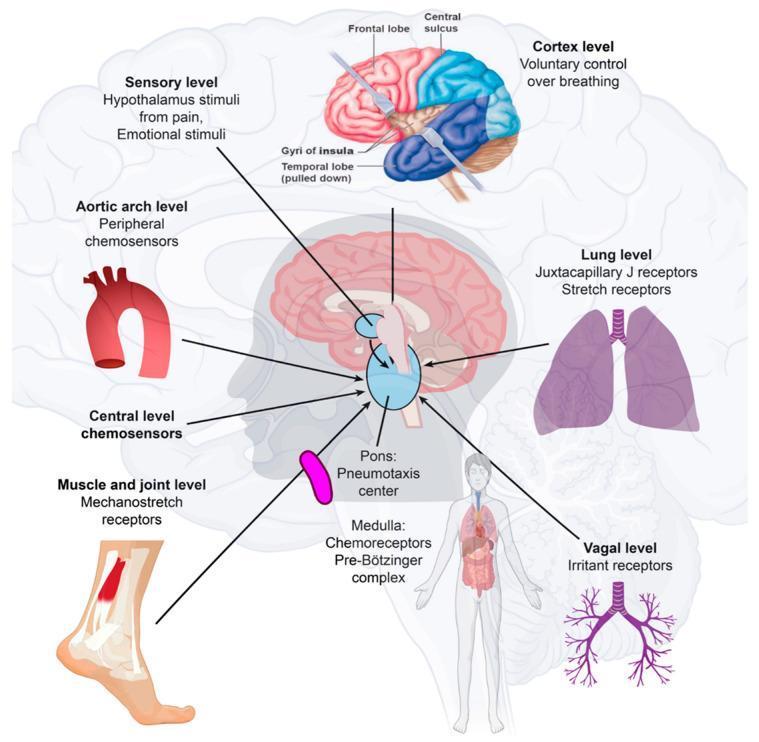
This medical illustration details the neuroanatomical and physiological pathways regulating human respiration. The central focus is a sagittal view of the brainstem, highlighting the Pons (Pneumotaxic center) and Medulla Oblongata (Chemoreceptors and Pre-Bötzinger complex) as the primary integration hubs for breathing rhythm. The diagram maps multiple afferent inputs to these centers: the Cortex level (frontal lobe) for voluntary control; the Sensory level (hypothalamus) processing pain and emotional stimuli; and central chemosensors. Peripheral inputs are illustrated at several anatomical levels: the Aortic arch (peripheral chemosensors), Lung level (Juxtacapillary J receptors and stretch receptors), Muscle/joint level (mechanostretch receptors), and Vagal level (irritant receptors). An anatomical overlay shows the cerebral cortex with labels for the frontal lobe, central sulcus, and gyri of the insula. The illustration summarizes how multifaceted physiological parameters, including blood pH, CO2, O2, lung volume, and physical movement, are processed by the autonomic nervous system to control respiratory rate and depth.
This medical pathophysiology diagram illustrates the functional enrichment of core metabolic pathways regulated by specific histone modifications across the three phases of the Yeast Metabolic Cycle (YMC): Oxidative (OX), Respiration Burst (RB), and Respiration Control (RC). Three cellular models depict pathways including the Pentose Phosphate Pathway, Glycolysis, 1C-metabolism, TCA cycle, Fatty acid biosynthesis, and Beta-oxidation, connecting the cytosol to the mitochondria and cell membrane. Color-coded horizontal bars overlying specific pathways indicate enrichment by specific epigenetic marks: H3K9ac (red), H3K18ac (green), H3K56ac (yellow), H3K14ac (purple), H4K5ac (orange), and H3K4me3 (blue). In the OX phase, enrichment is high in ribosome biosynthesis and the pentose phosphate pathway. The RB phase shows increased glycolysis and fatty acid biosynthesis regulation. The RC phase demonstrates a shift toward amino acid degradation and beta-oxidation. This visualization demonstrates how chromatin modifications coordinate gene expression to drive metabolic transitions during different cellular respiratory states.
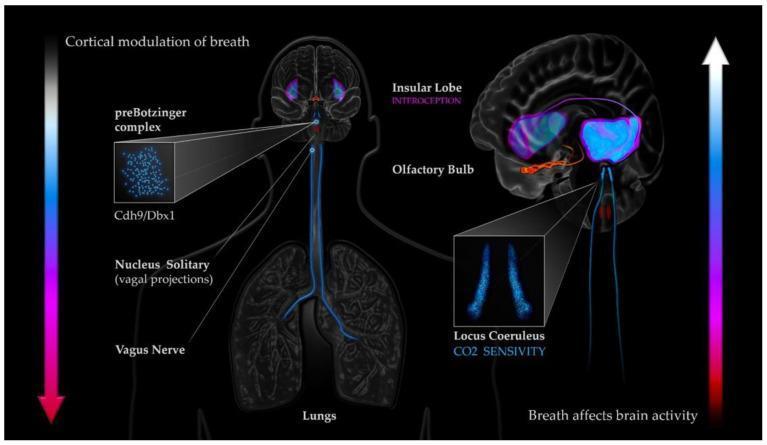
This pathophysiology diagram illustrates the bidirectional coupling mechanisms between respiratory dynamics and cortical activity. The central figure depicts an anatomical pathway starting from the lungs, connecting via the Vagus Nerve to the Nucleus Solitary (vagal projections) in the brainstem. Key respiratory control centers are highlighted, including the preBotzinger complex (noting Cdh9/Dbx1 neurons). A sagittal brain section on the right details higher-order structures involved in this loop: the Olfactory Bulb, the Locus Coeruleus (linked to CO2 sensitivity), and the Insular Lobe (associated with interoception). Visual callouts provide magnified views of cellular populations within the preBotzinger complex and the bilateral structure of the Locus Coeruleus. Vertical gradient arrows signify the dual nature of this system: 'Cortical modulation of breath' (descending) and 'Breath affects brain activity' (ascending). This infographic serves as an educational tool for understanding the neuroanatomical basis of respiratory-attentional synchronization and autonomic nervous system regulation.
Regulation of Respiration
1. The Respiratory Center
A. Medullary Centers
- Located in the nucleus tractus solitarius (NTS)
- Primarily drives inspiration - generates the basic rhythm of breathing
- Receives sensory input from peripheral chemoreceptors (carotid/aortic bodies), baroreceptors, and lung receptors via CN IX (glossopharyngeal) and CN X (vagus)
- Emits repetitive bursts of inspiratory action potentials even when all peripheral inputs are cut - demonstrating intrinsic rhythmicity
- Largely inactive during quiet, normal breathing
- Activated during forceful or heavy breathing - drives both inspiratory and expiratory muscles
- Contains the pre-Bötzinger complex, a rostral subregion with spontaneously firing pacemaker neurons; this is considered the central pattern generator for respiratory rhythm
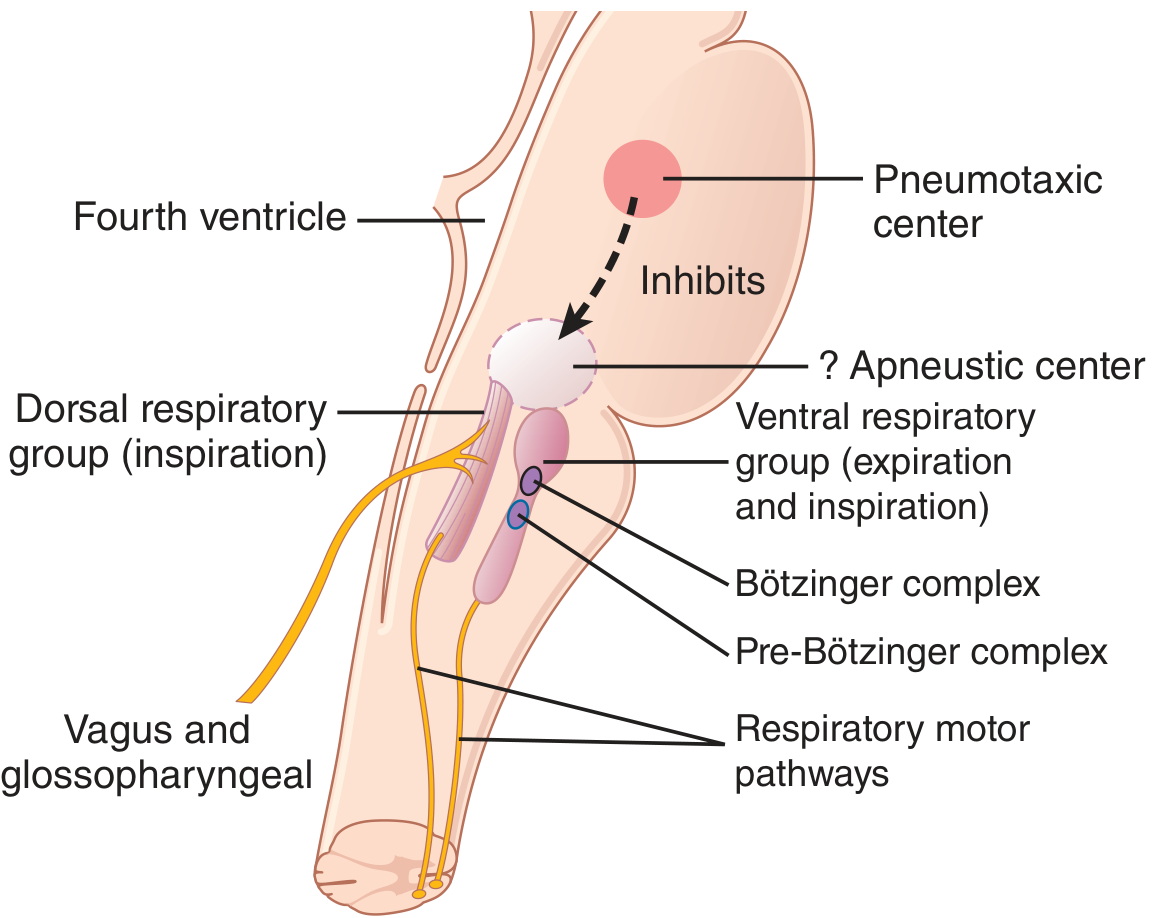
B. Pontine Centers
- Continuously transmits inhibitory signals to the DRG
- Its main role is to limit the duration of inspiration, preventing the lungs from over-filling
- When more active, it increases the respiratory rate (shortens each breath cycle)
- Tends to promote prolonged, gasping inspiration ("apneusis")
- Normally held in check by the pneumotaxic center
- Its precise role in humans remains debated
C. The Inspiratory "Ramp" Signal
- Starts weakly and builds steadily over ~2 seconds (a ramp pattern)
- Then stops abruptly for ~3 seconds, allowing passive elastic recoil expiration
- Repeats continuously
- Ramp steepness - how fast the signal rises (determines how rapidly lungs fill - important during exercise)
- Ramp cut-off point - how early the signal stops (determines inspiratory duration and therefore respiratory rate)
2. Chemical Control of Respiration
"The ultimate goal of respiration is to maintain proper concentrations of O₂, CO₂, and H⁺ in the tissues."
- Guyton and Hall Textbook of Medical Physiology
A. Central Chemoreceptors (CO₂ and H⁺)
- These neurons are primarily stimulated by H⁺ ions in the interstitial fluid of the brain
- However, H⁺ does NOT easily cross the blood-brain barrier (BBB)
- CO₂, in contrast, freely crosses the BBB. Once inside, it reacts with water:
- CO₂ + H₂O → H₂CO₃ → H⁺ + HCO₃⁻
- The H⁺ generated locally then strongly stimulates the chemosensitive neurons
B. Peripheral Chemoreceptors (O₂, CO₂, H⁺)
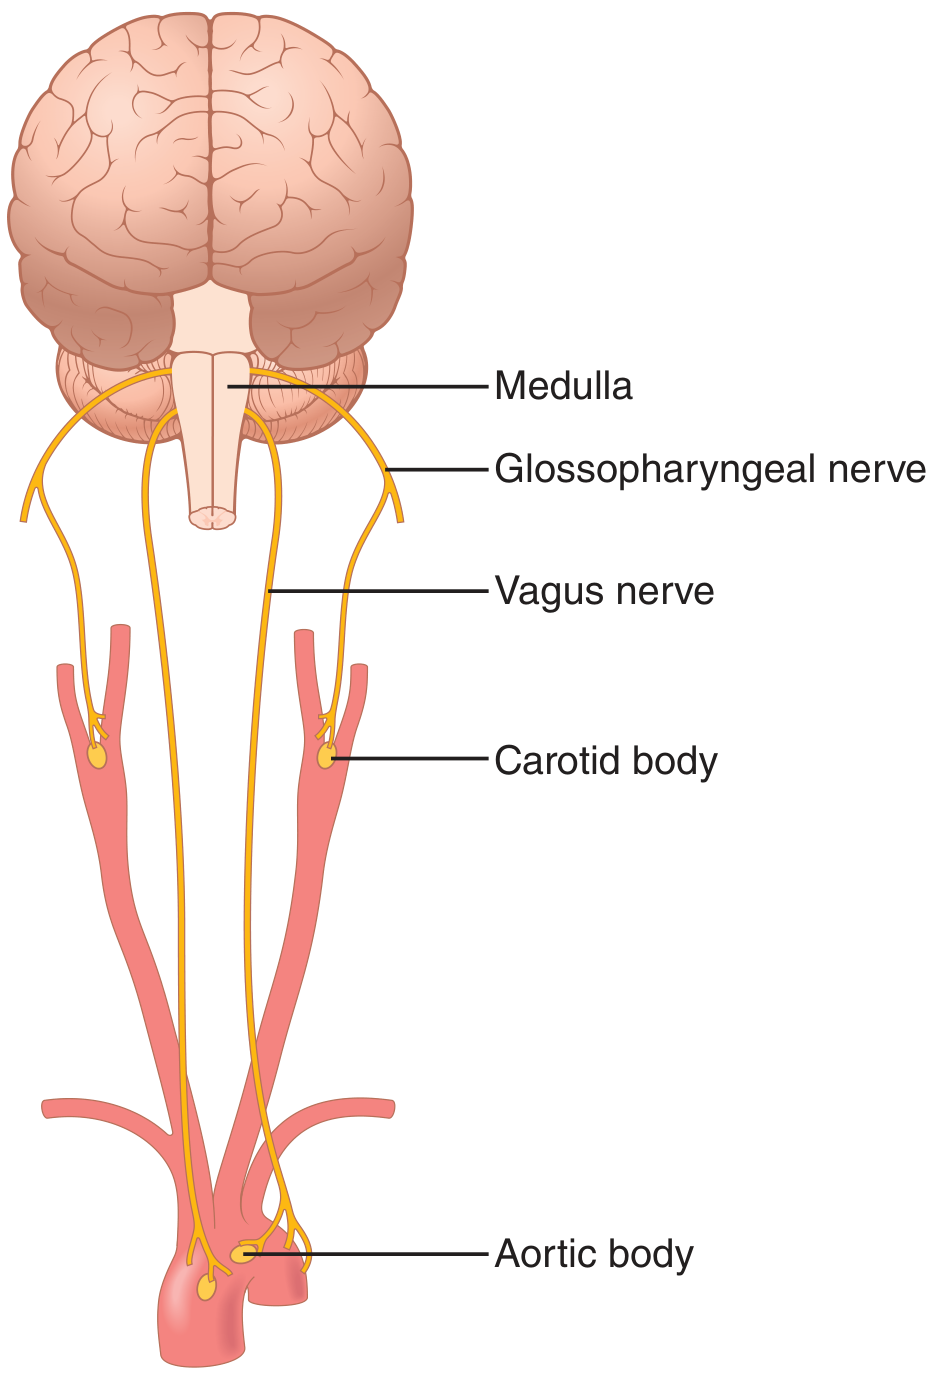
- Carotid bodies - at the bifurcation of the common carotid arteries (main sensors); afferents travel via Hering's nerve → CN IX → DRG
- Aortic bodies - along the aortic arch; afferents via CN X → DRG
- Little stimulation when PO₂ > 100 mmHg
- Significant stimulation as PO₂ falls below 60 mmHg (when Hb saturation drops steeply)
- Ventilation can increase ~5-fold at very low PO₂
- Increased PCO₂ (moderate effect)
- Increased blood H⁺ / metabolic acidosis
3. Pulmonary Reflexes (Nervous Feedback)
- Stretch receptors in the bronchial walls fire when lungs are over-inflated
- Signals travel via the vagus to the DRG → terminates inspiration
- Mainly protects against excessive lung distension; relatively weak in adults at normal tidal volumes
- Between epithelial cells lining the airways
- Respond to dust, smoke, noxious gases → cause coughing, bronchoconstriction, increased breathing rate
- In alveolar walls adjacent to capillaries
- Stimulated by pulmonary capillary engorgement (as in heart failure) or chemicals
- Cause rapid, shallow breathing and dyspnea
4. Other Inputs to the Respiratory Center
| Input | Effect |
|---|---|
| Higher cortical centers | Voluntary control of breathing (talking, breath-holding, Valsalva) |
| Hypothalamus / limbic system | Emotion, pain, temperature changes alter breathing rate |
| Proprioceptors in joints/muscles | Movement reflexes - increase ventilation at exercise onset |
| Hering-Breuer reflex | Lung inflation terminates inspiration |
| Baroreceptors | Hypertension slightly inhibits respiration |
5. Regulation During Exercise
-
Neurogenic drive - the motor cortex transmits collateral signals to the brainstem respiratory center simultaneously with signals to exercising muscles ("feed-forward" mechanism). This is why ventilation increases almost instantaneously at exercise onset, before any blood gas changes can occur.
-
Chemical fine-tuning - once exercise is sustained, any small drift in PCO₂ or H⁺ provides additional corrective chemical stimulus
6. Acclimatization to Altitude
- Persistent low PO₂ drives increased ventilation
- This blows off CO₂, which would normally inhibit further ventilation
- Over 2-3 days, the central chemoreceptors lose ~80% of their sensitivity to CO₂/H⁺
- O₂-driven hyperventilation is then no longer suppressed
- Alveolar ventilation can increase 400-500% (vs. only ~70% with acute hypoxia)
Summary Diagram of Control Hierarchy
Make an explanation on the regulation of respiration using these notes from guyton provided. Make notes according to the subtopics and make them understandable.
🫁 Regulation of Respiration
Based on Guyton & Hall Textbook of Medical Physiology, Chapter 42
SUBTOPIC 1: The Respiratory Center
1A. Dorsal Respiratory Group (DRG)
- Located in the nucleus tractus solitarius (NTS) of the medulla
- Main function: drives INSPIRATION
- This group generates the basic rhythm of breathing
- Even if you cut all peripheral nerves to the medulla, the DRG still fires rhythmically - meaning it has built-in automaticity
- It receives sensory input (via CN IX and CN X) from:
- Peripheral chemoreceptors
- Baroreceptors
- Lung receptors
💡 Think of the DRG as the "pacemaker" of breathing - it keeps firing automatically, like the SA node of the heart.
1B. Ventral Respiratory Group (VRG)
- Also in the medulla, just ventral to the DRG
- Mostly silent during quiet breathing
- Activated only during forced/heavy breathing - then drives both inspiratory AND expiratory muscles
- Contains the pre-Bötzinger complex (rostral subregion), which has spontaneously firing pacemaker neurons - this is considered the central pattern generator for respiratory rhythm
💡 Think of the VRG as a reserve team - only called in when extra effort is needed (like during exercise).
1C. Pneumotaxic Center (Upper Pons)
- Located in the upper pons
- Sends continuous inhibitory signals to the DRG
- Its role: limits the duration of inspiration (prevents lung over-inflation)
- When it is MORE active → breaths are shorter → respiratory rate increases
- When it is LESS active → inspiration lasts longer → rate decreases
💡 Think of the pneumotaxic center as a brake on inspiration - it decides when to cut inspiration off.
1D. Apneustic Center (Lower Pons)
- Located in the lower pons
- Tends to promote prolonged inspiration (apneusis) - a gasping type of breathing
- Normally kept in check by the pneumotaxic center
- If the pneumotaxic center is destroyed, apneustic breathing results
1E. The Inspiratory "Ramp" Signal
- It starts weakly
- Increases steadily (like a ramp) over ~2 seconds
- Then stops abruptly for ~3 seconds → elastic recoil causes passive expiration
- The cycle repeats
| Control | Effect |
|---|---|
| Steepness of ramp | Steeper = lungs fill faster (used in exercise) |
| Cut-off point | Earlier cut-off = shorter inspiration = faster breathing rate |
💡 The ramp signal ensures smooth, gradual lung filling - not a gasp. Inspiration is active; expiration at rest is passive.
SUBTOPIC 2: Chemical Control of Respiration
Key principle: The brain constantly monitors O₂, CO₂, and H⁺ levels and adjusts ventilation to keep them normal.
2A. Central Chemoreceptors (CO₂ and H⁺ Sensors)
- H⁺ ions cannot freely cross the blood-brain barrier (BBB)
- CO₂ freely crosses the BBB
- Once CO₂ enters brain tissue, it reacts:
CO₂ + H₂O → H₂CO₃ → H⁺ + HCO₃⁻
- This locally produced H⁺ directly stimulates the chemoreceptor neurons
💡 CO₂ is the most powerful moment-to-moment controller of breathing at sea level in healthy people. Even small rises in PCO₂ sharply increase ventilation.
2B. Peripheral Chemoreceptors (O₂, CO₂, and H⁺ Sensors)
| Location | Nerve pathway |
|---|---|
| Carotid bodies (at carotid bifurcation) | Hering's nerve → CN IX (glossopharyngeal) → DRG |
| Aortic bodies (along aortic arch) | CN X (vagus) → DRG |
- These bodies receive enormous blood flow (~20× their weight per minute)
- They are always exposed to arterial blood, not venous
- Glomus cells (type I cells) are the actual sensors
- When arterial PO₂ drops → glomus cell K⁺ channels close → membrane depolarizes → signals sent to DRG → ventilation increases
- Very little response when PO₂ > 100 mmHg
- Strong stimulation when PO₂ falls below 60 mmHg (when Hb saturation drops steeply)
- Can increase ventilation up to 5-fold at very low PO₂
| Feature | Central Chemoreceptors | Peripheral Chemoreceptors |
|---|---|---|
| Location | Medulla | Carotid & aortic bodies |
| Primary stimulus | CO₂ / H⁺ | O₂ (mainly), also CO₂, H⁺ |
| Responds to blood H⁺ directly? | No (BBB limits it) | Yes |
| Main role at sea level | Dominant day-to-day control | Backup; active mainly in hypoxia |
SUBTOPIC 3: Pulmonary Reflexes (Nervous Feedback from the Lungs)
3A. Hering-Breuer Inflation Reflex
- Stretch receptors in bronchial walls fire when lungs are over-inflated
- Signal: vagus → DRG → inspiration is terminated
- Prevents dangerous lung over-distension
- Relatively weak in adults at normal tidal volumes (more important in newborns)
3B. Irritant Receptors
- Between airway epithelial cells
- Triggered by: dust, smoke, chemicals, cold air
- Response: coughing, bronchoconstriction, faster breathing rate
3C. J (Juxtacapillary) Receptors
- In alveolar walls, next to pulmonary capillaries
- Stimulated by: pulmonary edema, congestion (heart failure), certain chemicals
- Response: rapid, shallow breathing + sensation of dyspnea
SUBTOPIC 4: Other Inputs to the Respiratory Center
| Input Source | Effect on Breathing |
|---|---|
| Cerebral cortex | Voluntary control - talking, breath-holding, voluntary hyperventilation |
| Hypothalamus / limbic system | Emotion (fear, anxiety), pain, body temperature changes alter rate |
| Proprioceptors (joints and muscles) | Movement signals increase ventilation immediately at exercise onset |
| Baroreceptors | High blood pressure mildly inhibits respiration |
SUBTOPIC 5: Regulation During Exercise
Mechanism 1: Neurogenic (Feed-Forward) Drive
- When the motor cortex sends signals to muscles, it simultaneously sends collateral signals to the brainstem respiratory center
- This is a predictive/anticipatory response - ventilation jumps up almost instantly when you start exercising, even BEFORE blood gases change
Mechanism 2: Chemical Fine-Tuning
- If the neurogenic drive is slightly too strong or too weak, small changes in PCO₂ or H⁺ provide a corrective chemical signal
- CO₂ and H⁺ act as a feedback system to fine-tune what the neurogenic drive started
- Immediate - ventilation shoots up (neurogenic)
- First 30 seconds - may overshoot, briefly lowering PCO₂
- After 30-40 seconds - CO₂ production matches ventilation, PCO₂ normalizes
- Sustained exercise - both mechanisms keep gases stable
💡 The brain "predicts" the need for more breathing and acts immediately - chemistry then fine-tunes it. This explains why you don't feel breathless one second into a sprint.
SUBTOPIC 6: Acclimatization to High Altitude
- Central chemoreceptors lose ~80% of their sensitivity to CO₂/H⁺
- Now the CO₂-blowoff no longer suppresses breathing
- O₂-driven hyperventilation can proceed unchecked
| Condition | Increase in Ventilation |
|---|---|
| Acute altitude exposure | ~70% increase |
| After 2-3 days acclimatization | 400-500% increase |
💡 Acclimatization = the brain deliberately "turns down" its CO₂ sensitivity so that low O₂ can drive full hyperventilation without being suppressed.
Quick Revision Summary
RESPIRATORY CENTER
├── Medulla
│   ├── DRG → inspiration rhythm (automatic)
│   └── VRG → forced breathing + pre-Bötzinger (pacemaker)
└── Pons
    ├── Pneumotaxic → limits inspiration (↑ rate)
    └── Apneustic → prolongs inspiration (normally inhibited)

CHEMICAL CONTROL
├── Central chemoreceptors → CO₂ (via H⁺ in brain tissue) → dominant control
└── Peripheral chemoreceptors → O₂ mainly (below 60 mmHg) → hypoxic drive

REFLEX CONTROL
├── Hering-Breuer → stretch → stops inspiration
├── Irritant receptors → cough + bronchoconstriction
└── J receptors → pulmonary edema → rapid shallow breathing

EXERCISE → neurogenic (feed-forward) + chemical (feedback)
ALTITUDE → acclimatization = ↓ CO₂ sensitivity → ↑↑ ventilation
Read up on the hemoglobin oxygen dissociation curve & factors affecting the curve
oxygen hemoglobin dissociation curve sigmoidal shape factors shift right left
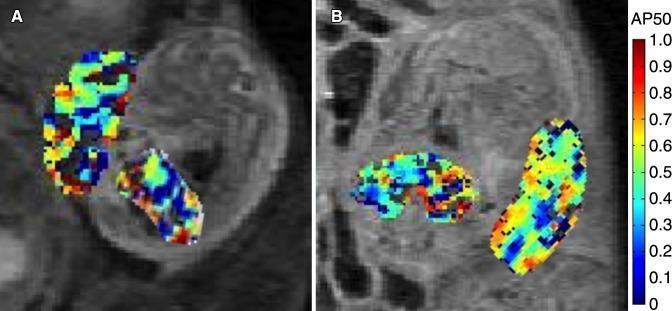
This diagnostic image set displays two functional MR images (A and B) showing maternal-fetal units in a mouse model at embryonic days 14.5 and 17.5. The images feature overlaid color-coded AP50 maps, which represent fetal and placental oxygen-hemoglobin dissociation parameters. In both panels, the placenta and fetal liver are isolated as regions of interest. A vertical color bar on the right side indicates AP50 values scaled from 0 to 1.0, with cool colors (dark blue) representing lower values and warm colors (red/orange) representing higher values. Panel A (day 14.5) demonstrates a heterogeneous distribution of oxygenation parameters within the tissues, showing a mix of green, yellow, and blue pixels. Panel B (day 17.5) illustrates the progression of these physiological markers over time, with the placental AP50 values showing a significant spatial shift toward warmer colors, reflecting changes in oxygen transfer efficiency. These maps provide a non-invasive visual method for studying fetal oxygenation and placental function during gestation.
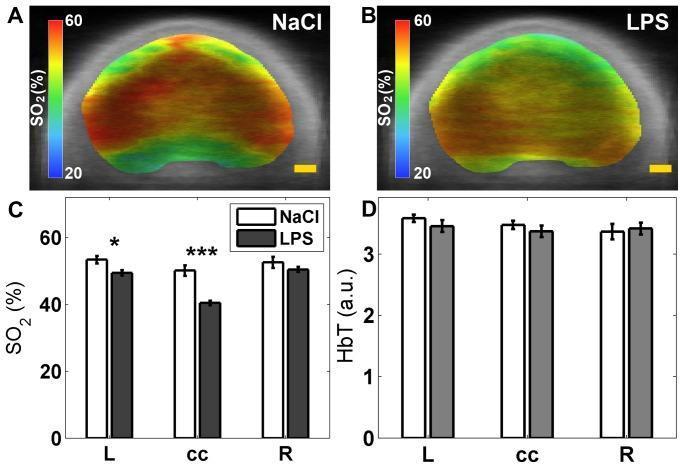
This composite educational graphic presents locoregional oxygen saturation (SO2) data in a neonatal rat brain model following lipopolysaccharide (LPS) exposure, utilizing Photoacoustic Tomography (PAT). Panels A and B display group-averaged, SO2-weighted PAT images overlaid on anatomical brain sections for sham control (NaCl) and LPS-treated groups. A colorimetric scale indicates saturation levels ranging from 20% (blue) to 60% (red). Visually, the LPS group (B) shows a shift towards green and yellow hues, indicating reduced cortical oxygenation compared to the predominantly red and orange tones in the control (A). Panel C provides a quantitative bar graph comparing SO2 percentages across three regions of interest: the left cortex (L), corpus callosum (cc), and right cortex (R). Statistically significant decreases in SO2 are noted in the LPS group (grey bars) compared to controls (white bars) in the left cortex and corpus callosum (*P<0.05, ***P<0.001). Panel D displays total hemoglobin (HbT) values, showing no significant variation between groups. This figure demonstrates the utility of PAT in monitoring metabolic and hemodynamic changes in neuroinflammatory disease models.
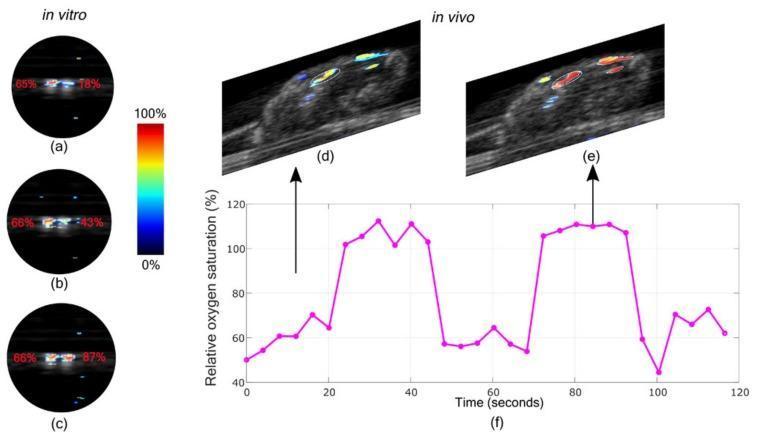
This composite educational graphic illustrates the capabilities of photoacoustic imaging (PAI) and ultrasound (US) for monitoring oxygen saturation (sO2). Panels (a–c) present in-vitro oxygen saturation maps of two tubes. The left tube serves as a control with stable blood oxygenation (~65-66%), while the right tube demonstrates a progressive increase in sO2 from 18% to 43% and 87%, represented by a color gradient shifting from blue (low) to red (high). Panels (d) and (e) display in-vivo interleaved PA/US images of a mouse thigh muscle. These images show the dynamic change in hemoglobin oxygenation within the tissue during different phases of an oxygen-controlled breathing cycle. Panel (f) provides a corresponding line graph plotting relative oxygen saturation (%) over 120 seconds, showing distinct peaks (~110%) and troughs (~60%) that correlate with the high and low oxygen cycles observed in the visual mapping. This content demonstrates the clinical relevance of multispectral LED-based PAI in non-invasively quantifying tissue hypoxia and vascular functional parameters.
🩸 Hemoglobin-Oxygen Dissociation Curve
Based on Guyton & Hall Textbook of Medical Physiology, Chapter 41
SUBTOPIC 1: How Oxygen is Carried in the Blood
| Method | % of O₂ carried |
|---|---|
| Bound to hemoglobin (in RBCs) | 97% |
| Dissolved in plasma | 3% |
- O₂ combines with the heme portion of hemoglobin in a loose, reversible bond
- High PO₂ (in lungs) → O₂ binds to Hb
- Low PO₂ (in tissues) → O₂ released from Hb
- This reversibility is the entire basis of O₂ transport
- Normal blood has 15 g of Hb per 100 mL blood
- Each gram of Hb binds 1.34 mL O₂
- 15 × 1.34 = ~20 mL O₂ per 100 mL blood = "20 volume percent" (at 100% saturation)
SUBTOPIC 2: The Oxygen-Hemoglobin Dissociation Curve
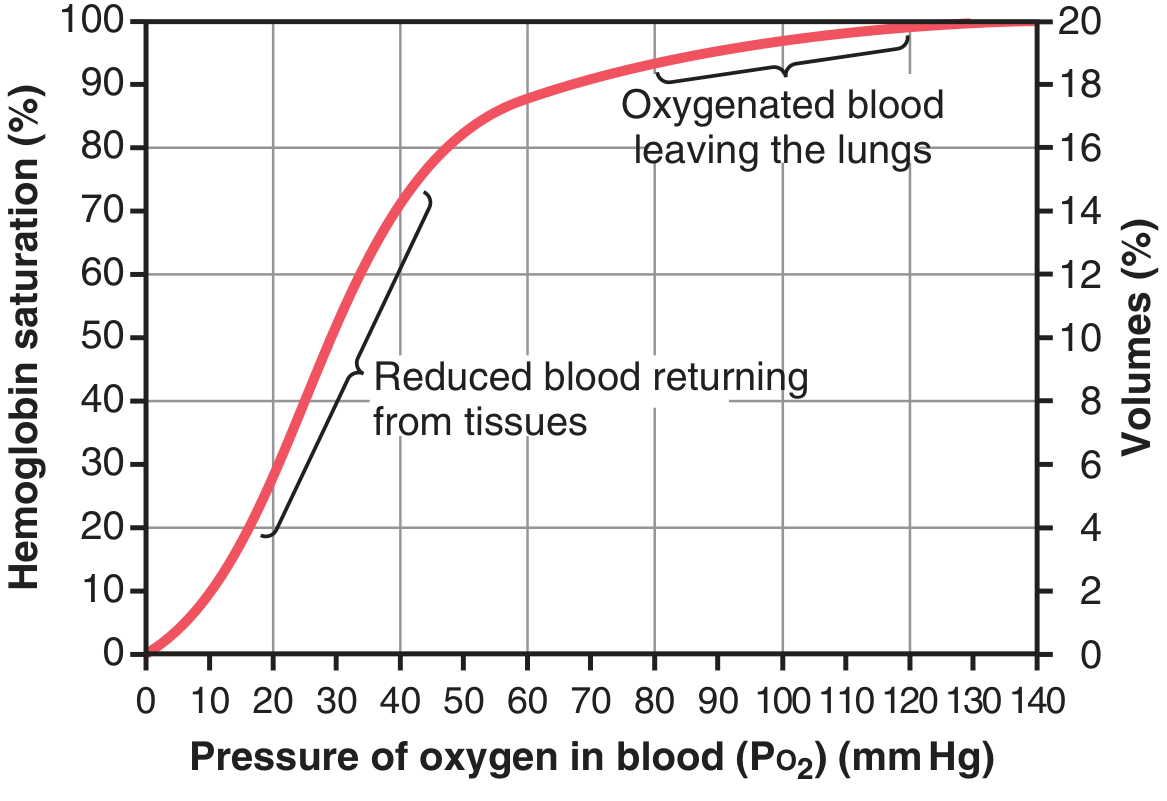
Shape: Why is it S-shaped (sigmoidal)?
- Small drops in PO₂ cause very little drop in saturation
- This is a safety zone - even if alveolar PO₂ drops from 104 to 60 mmHg, saturation only falls from 97% to 89% (just 8% drop)
- Protects O₂ loading in the lungs even at moderate altitude or mild lung disease
- Small drops in PO₂ cause large amounts of O₂ to be released
- This is the tissue range - allows efficient O₂ unloading to active cells
- This is where tissues operate (venous blood ~40 mmHg)
💡 The flat top = safety for loading in the lungs. The steep slope = efficiency for unloading in the tissues.
Key Reference Points
| Location | PO₂ | Hb Saturation | O₂ Content |
|---|---|---|---|
| Arterial blood (leaving lungs) | 95 mmHg | 97% | ~19.4 mL/100 mL |
| Venous blood (returning from tissues) | 40 mmHg | 75% | ~14.4 mL/100 mL |
| O₂ delivered per 100 mL blood | - | - | ~5 mL |
SUBTOPIC 3: Hemoglobin as an Oxygen Buffer
- Upper limit: Tissue PO₂ cannot rise above ~40 mmHg because that is where Hb holds its O₂ and won't release more than the tissues need
- Lower limit: Even when alveolar PO₂ drops dramatically (from 104 to 60 mmHg), tissue PO₂ barely changes because the flat top of the curve keeps arterial saturation high
- Normal: ~25% (only 25% of the Hb gives up its O₂)
- Heavy exercise: can reach 75-85%
- In extreme local ischemia: can approach 100%
SUBTOPIC 4: Factors That Shift the Curve
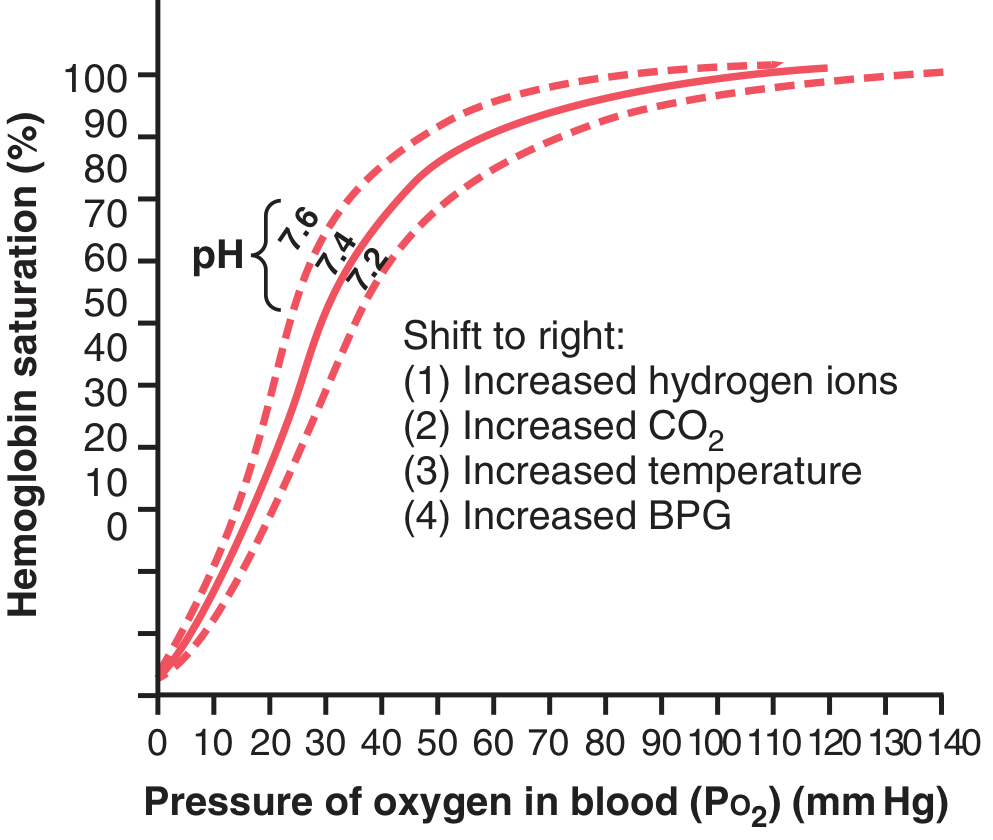
What does shifting mean?
- Right shift = at ANY given PO₂, Hb gives up MORE O₂ = facilitates O₂ unloading to tissues
- Left shift = at ANY given PO₂, Hb holds MORE O₂ = facilitates O₂ loading in lungs (but less unloading)
Factors Causing a RIGHT Shift (↓ affinity for O₂)
1. ↑ H⁺ (↓ pH) — The Bohr Effect
- pH falls from 7.4 → 7.2: curve shifts ~15% to the right
- More H⁺ means more acid → Hb changes shape → releases O₂ more readily
- Acid is produced by active tissues (CO₂ + H₂O → H⁺ + HCO₃⁻; also lactic acid in exercise)
2. ↑ CO₂ — Also part of the Bohr Effect
- CO₂ diffuses from active tissues into blood → raises blood PCO₂
- This raises H₂CO₃ and H⁺ → shifts curve right
- CO₂ also binds directly to Hb (carbaminohemoglobin), reducing its O₂ affinity
💡 The Bohr effect is a beautiful self-regulating mechanism: Active tissues produce CO₂ and H⁺ → these shift the curve right → more O₂ released exactly where it is needed most.
3. ↑ Temperature
- Exercising muscle temperature rises 2-3°C
- Heat weakens the Hb-O₂ bond → more O₂ released
- Acts in synergy with CO₂ and H⁺ during exercise
4. ↑ 2,3-BPG (Bisphosphoglycerate)
- A metabolic byproduct produced by RBCs during glycolysis
- Normal BPG keeps the curve slightly right-shifted at baseline
- Increased in hypoxia (e.g., high altitude, anemia, heart failure) after a few hours
- Increased BPG shifts curve further right → O₂ released to tissues at 10 mmHg HIGHER tissue PO₂ than normal
- This is an important adaptation mechanism in chronic hypoxia
Factors Causing a LEFT Shift (↑ affinity for O₂)
| Factor | Change |
|---|---|
| ↓ H⁺ (↑ pH / alkalosis) | Left shift |
| ↓ CO₂ (in pulmonary capillaries) | Left shift |
| ↓ Temperature | Left shift |
| ↓ 2,3-BPG | Left shift |
| Carbon monoxide (CO) | Extreme left shift |
| Fetal hemoglobin (HbF) | Natural left shift |
💡 The Bohr effect works in reverse in the lungs: CO₂ diffuses OUT of blood into alveoli → ↓ PCO₂ → ↓ H⁺ → left shift → Hb picks up more O₂ at any given alveolar PO₂. This is the same mechanism, working in both directions.
Summary Table of All Factors
| Factor | Direction | Mechanism | Physiological Role |
|---|---|---|---|
| ↑ PCO₂ | RIGHT | ↑ H⁺ via carbonic acid; direct binding | Release O₂ in active tissues |
| ↑ H⁺ (acidosis) | RIGHT | Alters Hb conformation | Release O₂ in acidic tissues |
| ↑ Temperature | RIGHT | Weakens Hb-O₂ bond | Release O₂ in warm (exercising) tissues |
| ↑ 2,3-BPG | RIGHT | Binds Hb, reduces O₂ affinity | Adaptation to chronic hypoxia |
| ↓ PCO₂ | LEFT | ↓ H⁺ | Load O₂ in the lungs |
| ↓ H⁺ (alkalosis) | LEFT | Stabilizes Hb-O₂ bond | Load O₂ in the lungs |
| ↓ Temperature | LEFT | Strengthens Hb-O₂ bond | Cold tissues retain O₂ |
| CO poisoning | LEFT (extreme) | CO binds Hb 200× more avidly | Pathological - prevents O₂ release |
| Fetal Hb (HbF) | LEFT | Lower BPG affinity | Draws O₂ from maternal blood across placenta |
SUBTOPIC 5: The Bohr Effect - Putting It All Together
IN THE TISSUES:
Active cell → produces CO₂ + H⁺
         → enters capillary blood
         → shifts ODC to the RIGHT
         → Hb releases more O₂ to the cell ✓

IN THE LUNGS:
CO₂ leaves blood → enters alveoli
         → blood PCO₂ and H⁺ fall
         → shifts ODC to the LEFT
         → Hb picks up more O₂ from alveoli ✓
SUBTOPIC 6: The Curve During Exercise
- ↑ CO₂ (from active muscles)
- ↑ H⁺ (CO₂ → H⁺; also lactic acid)
- ↑ Temperature (muscle heat)
- ↑ 2,3-BPG (if prolonged)
Quick Revision Summary
THE CURVE
├── Shape: S-shaped (sigmoidal)
│   ├── Flat top (>60 mmHg) = safe loading zone in lungs
│   └── Steep middle (20-60 mmHg) = efficient unloading in tissues
├── Normal arterial: PO₂ 95 mmHg → 97% saturation
├── Normal venous: PO₂ 40 mmHg → 75% saturation
└── O₂ delivered: ~5 mL per 100 mL blood normally

RIGHT SHIFT (↓ affinity, ↑ O₂ release to tissues)
├── ↑ H⁺ (↓ pH)    ← Bohr effect
├── ↑ CO₂           ← Bohr effect
├── ↑ Temperature
└── ↑ 2,3-BPG

LEFT SHIFT (↑ affinity, ↑ O₂ loading in lungs)
├── ↓ H⁺ (↑ pH)
├── ↓ CO₂
├── ↓ Temperature
├── ↓ 2,3-BPG
├── CO poisoning
└── Fetal Hb (HbF)

BOHR EFFECT = CO₂/H⁺ cause right shift at tissues,
              left shift at lungs → automatic O₂ delivery
Read up on bohr's and haldane effect.
🔄 The Bohr Effect & The Haldane Effect
Based on Guyton & Hall + Fishman's Pulmonary Diseases + Basic Medical Biochemistry
PART 1: THE BOHR EFFECT
What is it?
One-line definition: CO₂ and H⁺ produced by metabolizing tissues signal Hb to let go of O₂ and deliver it to those tissues.
The Molecular Mechanism
- CO₂ and H⁺ bind at sites on Hb that differ from the O₂-binding heme sites
- There are many more H⁺-binding sites than CO₂-binding sites on the Hb molecule
- When Hb releases O₂ (deoxygenation), 16 amino acid groups change their pKa values (14 histidine residues + 2 terminal amino groups) - these are called "Bohr groups"
- The net result: deoxygenated Hb has greater buffering power and lower O₂ affinity than oxygenated Hb
💡 Deoxy-Hb is a weaker acid than oxy-Hb - it holds on to H⁺ more readily. This is central to understanding BOTH the Bohr and Haldane effects.
How it Works: Step by Step
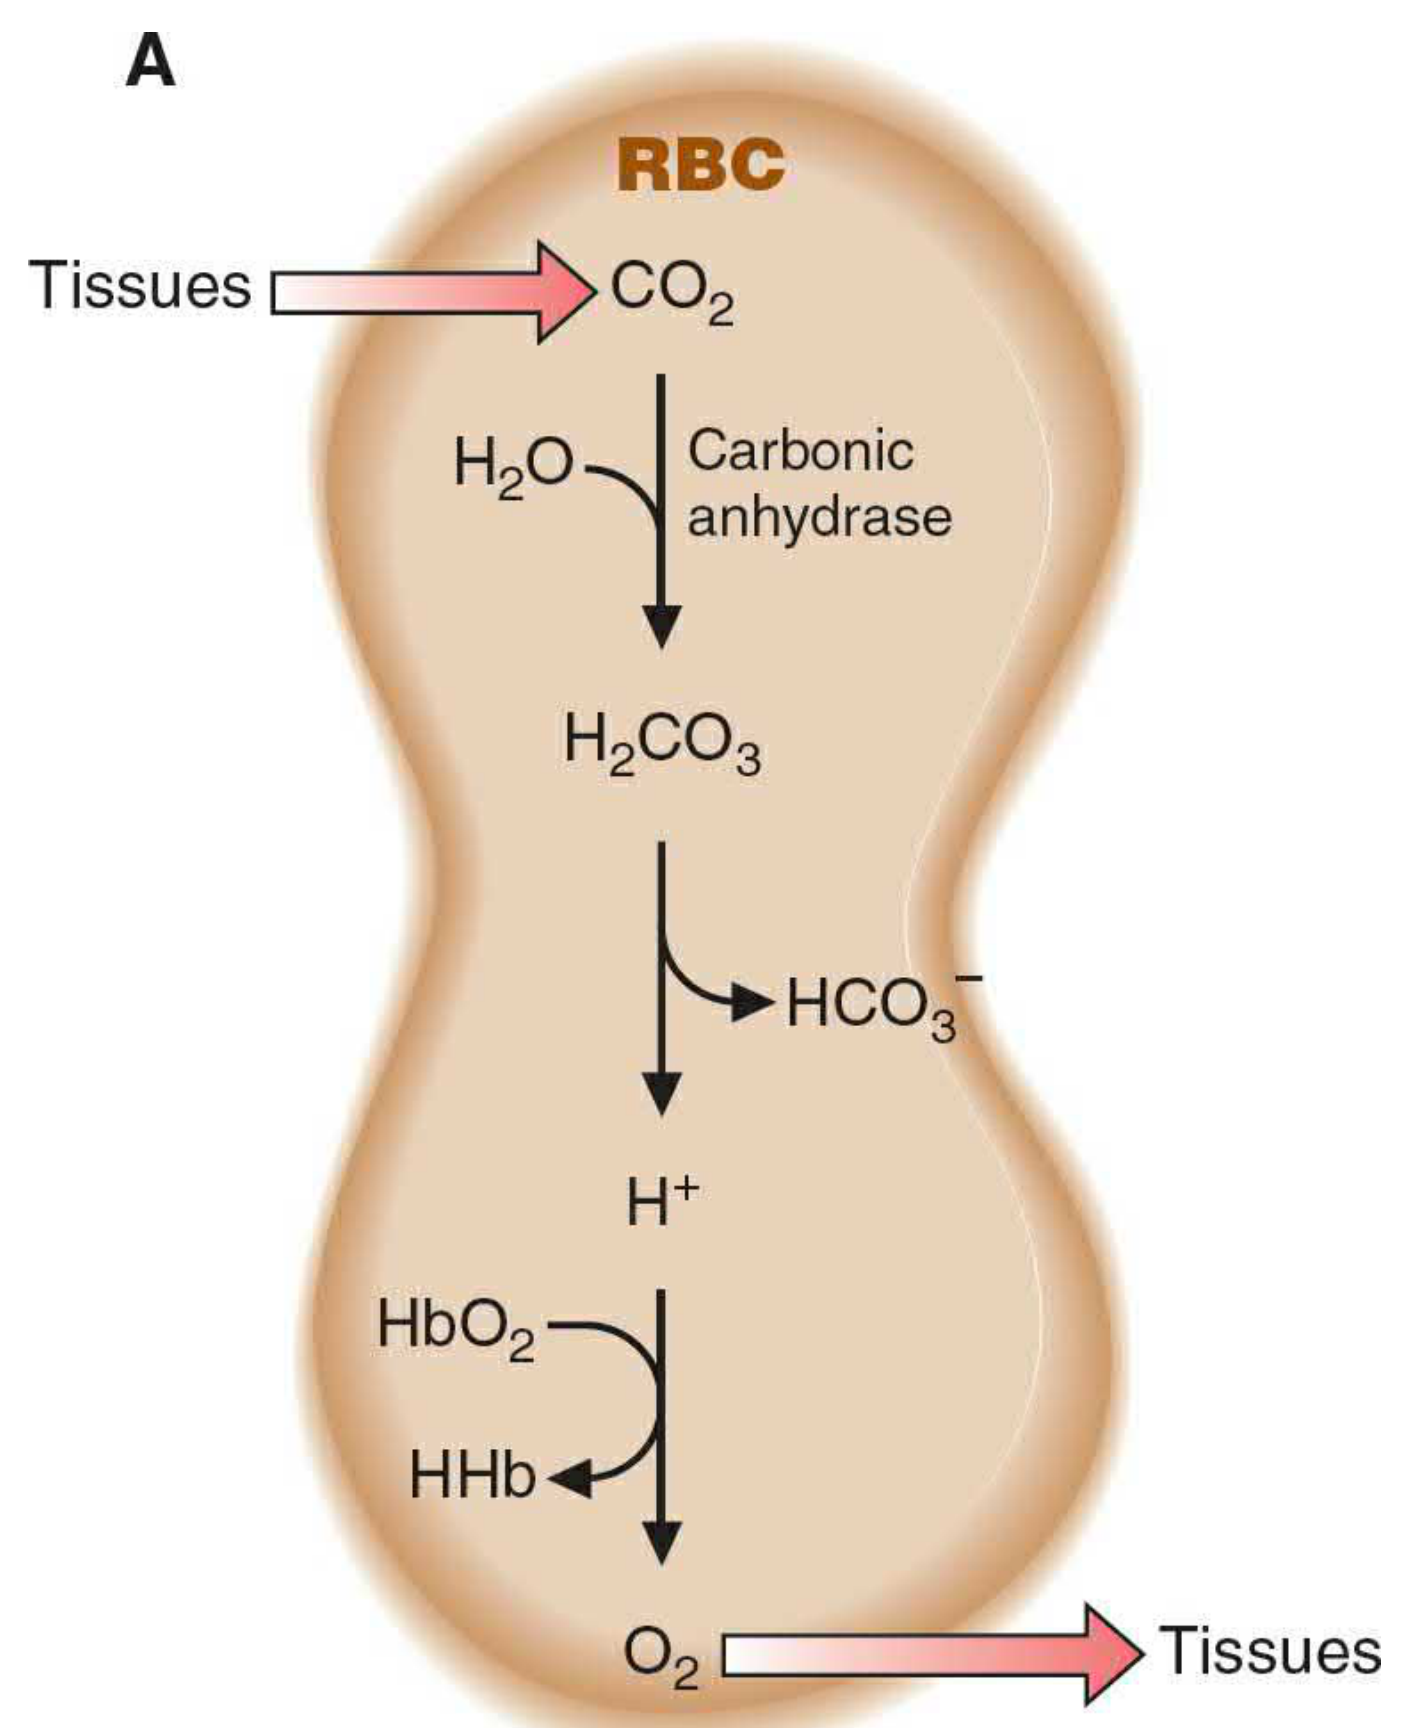
Active cell produces CO₂
    ↓
CO₂ enters RBC
    ↓
CO₂ + H₂O  →[carbonic anhydrase]→  H₂CO₃  →  H⁺ + HCO₃⁻
    ↓
H⁺ binds to Hb (Bohr groups change conformation)
    ↓
Hb affinity for O₂ DECREASES → O₂ released
    ↓
O₂ delivered to active tissue ✓
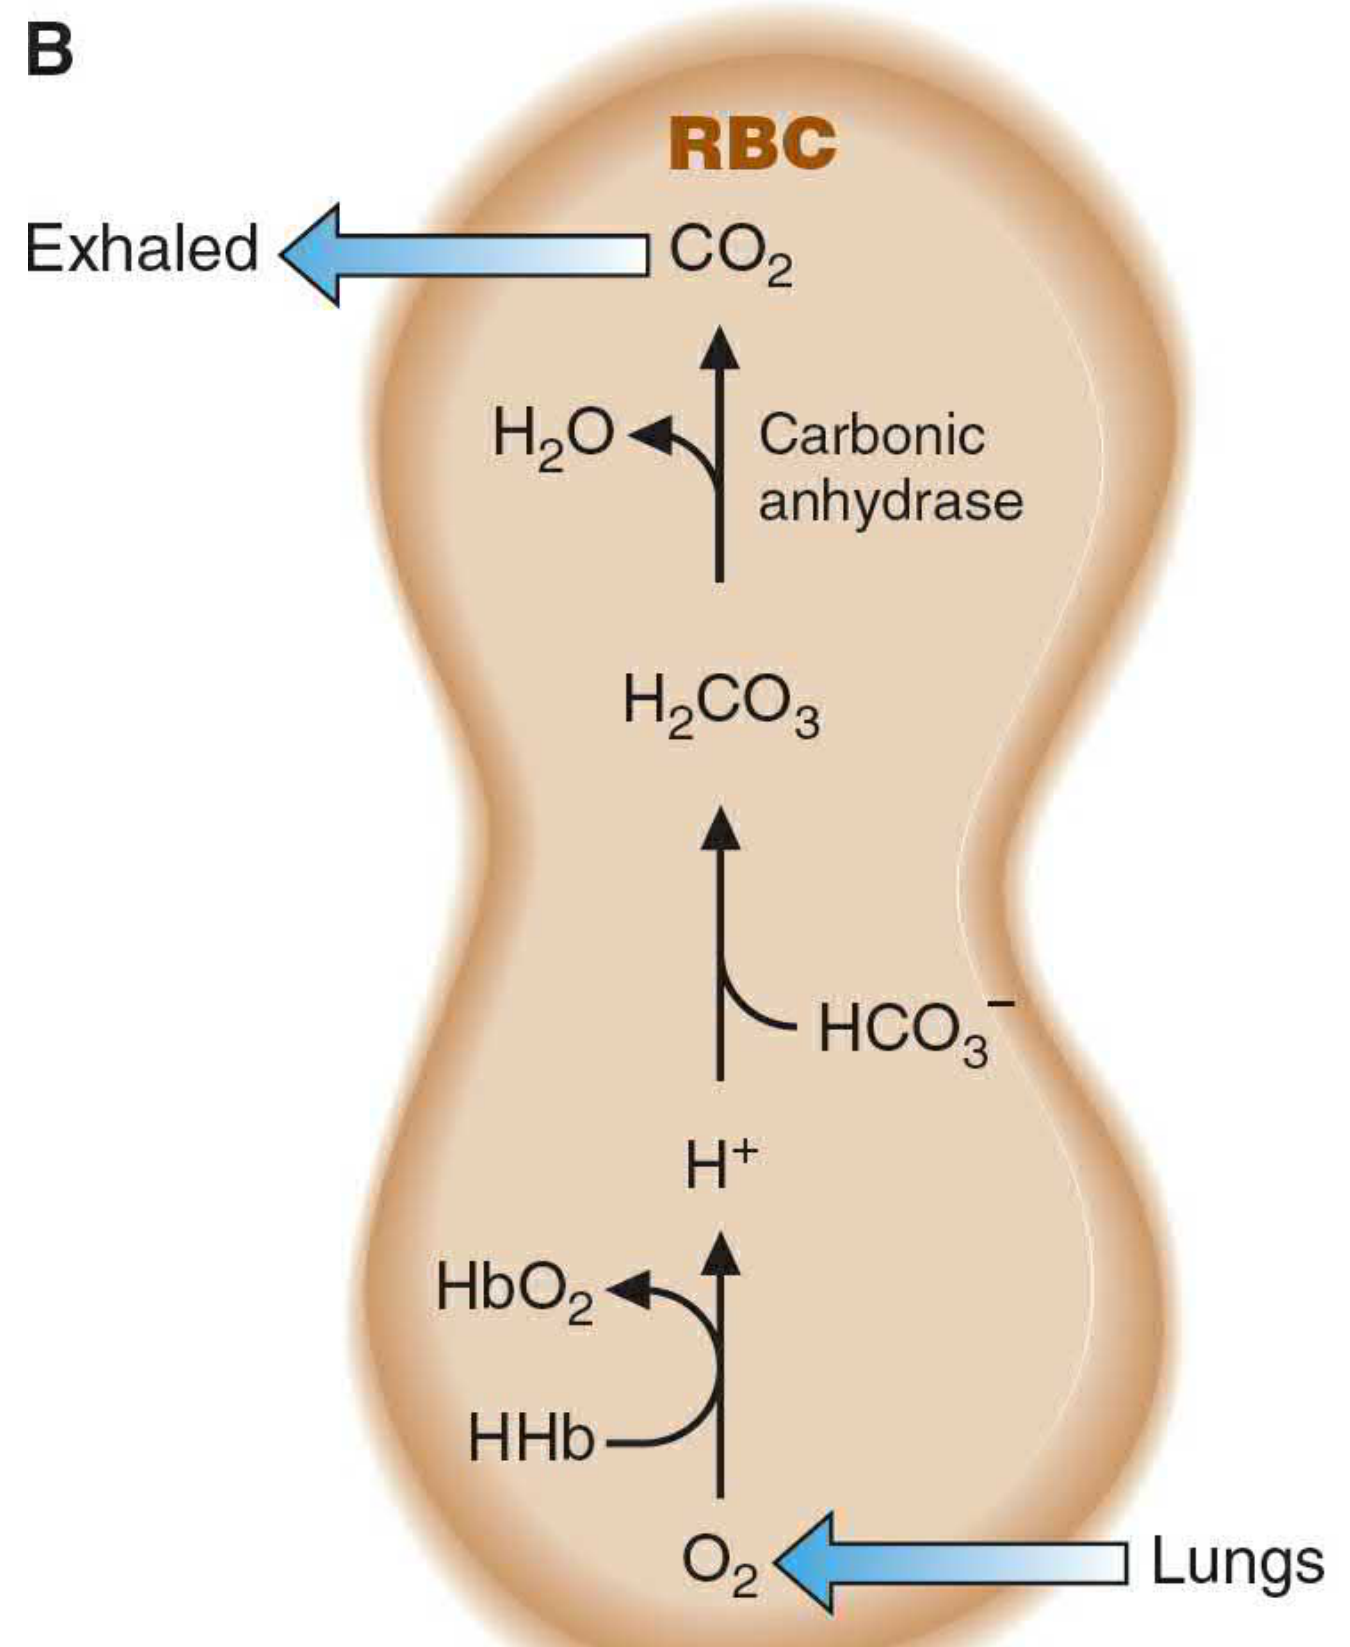
O₂ enters blood from alveoli (high PO₂)
    ↓
O₂ binds to Hb → Hb becomes more acidic
    ↓
H⁺ released from Hb
    ↓
H⁺ + HCO₃⁻  →  H₂CO₃  →[carbonic anhydrase]→  H₂O + CO₂
    ↓
CO₂ diffuses into alveoli → exhaled ✓
    ↓
Also: lower PCO₂ in blood → left shift → Hb picks up even more O₂
The pH Change and Its Magnitude
| Blood | pH | O₂ Saturation | PCO₂ |
|---|---|---|---|
| Arterial | 7.41 | 97% | 40 mmHg |
| Venous | 7.37 | 75% | 45 mmHg |
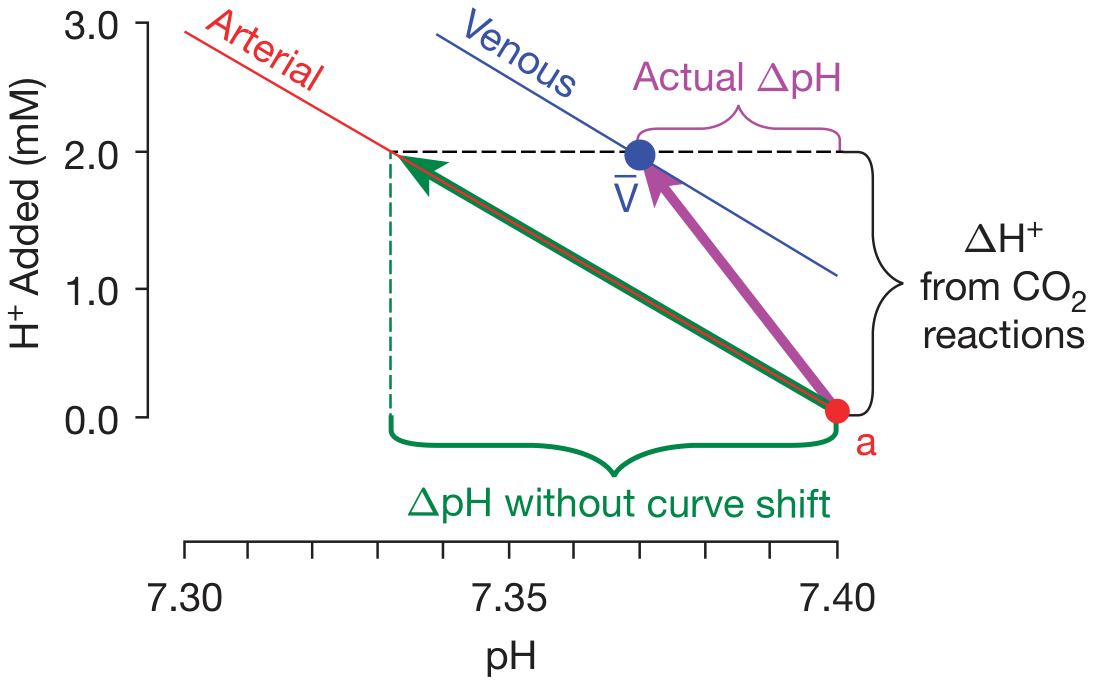
Quantitative Importance of the Bohr Effect
- Lactic acid accumulates (anaerobic glycolysis)
- Muscle CO₂ production surges
- Muscle temperature rises 2-3°C
- All four right-shifting factors act simultaneously
💡 The main physiological benefit of the Bohr effect is actually its contribution to pH buffering, not just O₂ unloading. Deoxygenated Hb absorbs H⁺ produced by metabolism, keeping blood pH stable.
The Bohr Effect - Summary
| Location | PO₂ | PCO₂/H⁺ | Curve Direction | Result |
|---|---|---|---|---|
| Tissues | Low | High (CO₂ produced) | RIGHT shift | O₂ unloaded to cells |
| Lungs | High | Low (CO₂ blown off) | LEFT shift | O₂ loaded onto Hb |
PART 2: THE HALDANE EFFECT
What is it?
One-line definition: O₂ loading in the lungs drives CO₂ out of the blood; O₂ unloading in the tissues allows Hb to carry more CO₂ back.
"The Haldane effect is quantitatively far more important in promoting CO₂ transport than the Bohr effect is in promoting O₂ transport."
Why Does it Happen? The Molecular Basis
- Deoxygenated Hb (in tissues) readily binds CO₂ at the N-terminal amino groups of the β-chains → forms carbaminohemoglobin (carbamate)
- When O₂ binds in the lungs → Hb conformation changes → lower affinity for CO₂ → carbamino-CO₂ is released
- Oxy-Hb (in lungs) releases H⁺ (because it is a stronger acid)
- These H⁺ ions combine with HCO₃⁻ → H₂CO₃ → carbonic anhydrase → H₂O + CO₂
- CO₂ diffuses into the alveoli and is exhaled
How it Works: Step by Step
O₂ unloaded from Hb to tissues
    ↓
Hb becomes DEOXY-Hb (weaker acid, stronger base)
    ↓
Effect 1: Deoxy-Hb has ↑ affinity for CO₂
    → CO₂ + Hb-NH₂ → Hb-NHCOO⁻ + H⁺ (carbaminohemoglobin)

Effect 2: Deoxy-Hb has ↑ affinity for H⁺
    → Hb absorbs H⁺ → drives CO₂ + H₂O → HCO₃⁻ + H⁺ rightward
    → More CO₂ converted to HCO₃⁻ and transported

Result: Blood picks up MORE CO₂ from tissues ✓
O₂ binds to Hb (high PO₂ in lungs)
    ↓
Hb becomes OXY-Hb (stronger acid)
    ↓
Effect 1: Oxy-Hb has ↓ affinity for CO₂
    → Carbaminohemoglobin releases CO₂ → diffuses to alveoli

Effect 2: Oxy-Hb releases H⁺
    → H⁺ + HCO₃⁻ → H₂CO₃ → H₂O + CO₂
    → CO₂ exhaled

Result: Blood releases MORE CO₂ in the lungs ✓
The Quantitative Proof - Guyton's Numbers
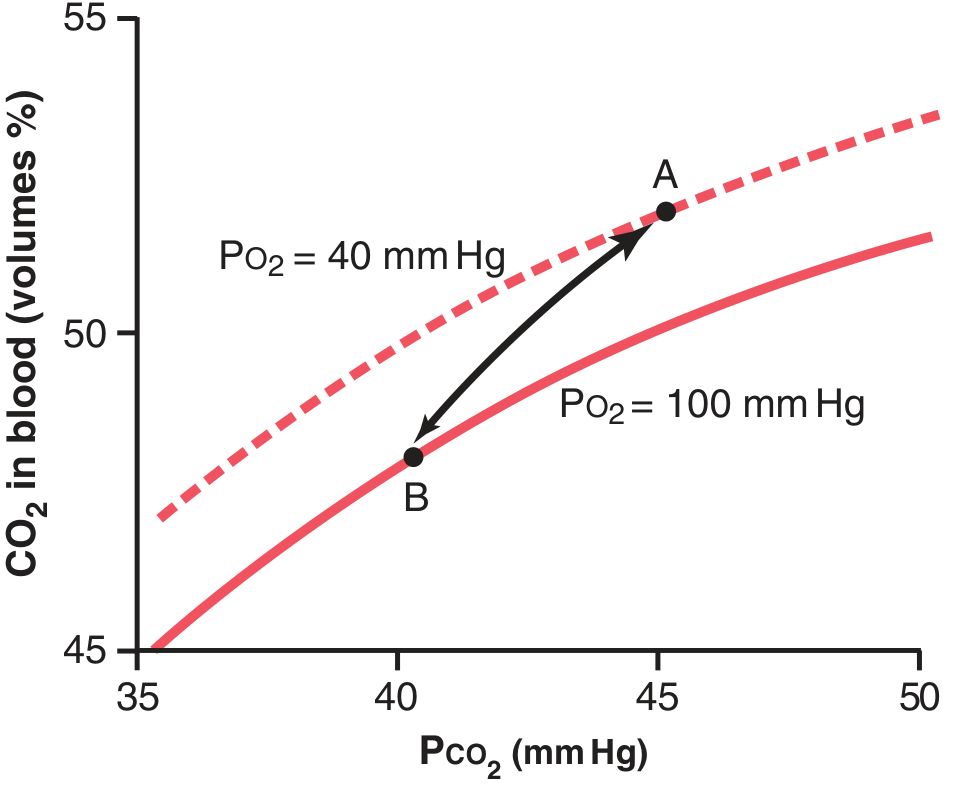
- Point A (tissues): PCO₂ = 45 mmHg, PO₂ = 40 mmHg → blood carries 52 vol% CO₂
- Blood enters lungs: PCO₂ falls to 40 mmHg, PO₂ rises to 100 mmHg
- Without the Haldane effect: CO₂ would only fall from 52 → 50 vol% (only 2 vol% CO₂ released)
- With the Haldane effect: O₂ binding shifts the CO₂ dissociation curve DOWN → CO₂ falls to 48 vol% (Point B)
- Additional 2 vol% released due to Haldane = doubles total CO₂ released
💡 The Haldane effect approximately DOUBLES the amount of CO₂ transported - from both the lungs (release) and the tissues (uptake). Without it, tissue PCO₂ would be approximately twice as high as normal.
How CO₂ is Carried in Blood (Context for the Haldane Effect)
| Form | Proportion | Haldane Effect Involved? |
|---|---|---|
| Bicarbonate (HCO₃⁻) in plasma | ~70% | Yes - H⁺ buffering by Hb drives this reaction |
| Dissolved CO₂ in plasma | ~7% | No |
| Carbaminohemoglobin (CO₂ bound to Hb) | ~23% | Yes - directly |
PART 3: THE BOHR-HALDANE INTERACTION - How They Work Together
THE COMPLETE PICTURE AT THE TISSUE CAPILLARY:

Tissue produces CO₂ + H⁺
        ↓
CO₂ enters RBC → forms HCO₃⁻ + H⁺ (carbonic anhydrase)
        ↓
H⁺ binds to Hb → Bohr effect:
    Hb releases O₂ → O₂ delivered to tissue ✓
        ↓
Hb is now deoxygenated → Haldane effect:
    Hb now has ↑ affinity for CO₂ and H⁺
    → Picks up more CO₂ as carbamino
    → Buffers more H⁺ → drives more HCO₃⁻ formation ✓

RESULT: O₂ unloaded AND CO₂ loaded in one efficient cycle
THE COMPLETE PICTURE AT THE LUNG CAPILLARY:

O₂ diffuses from alveolus into blood (high PO₂)
        ↓
O₂ binds Hb → Haldane effect:
    Hb releases CO₂ from carbamino + releases H⁺
    H⁺ + HCO₃⁻ → H₂CO₃ → CO₂ exhaled ✓
        ↓
CO₂ loss from blood → ↓ PCO₂ → ↓ H⁺ → Bohr effect:
    Hb affinity for O₂ increases
    → Even more O₂ loaded onto Hb ✓

RESULT: CO₂ unloaded AND O₂ loaded in one efficient cycle
💡 The Bohr effect facilitates O₂ delivery; the Haldane effect facilitates CO₂ transport. Both are triggered by the same biochemical events (oxygenation state of Hb) and they reinforce each other.
Quick Comparison Table
| Feature | Bohr Effect | Haldane Effect |
|---|---|---|
| Named after | Christian Bohr | John Scott Haldane |
| Trigger | ↑ CO₂ and H⁺ in blood | Change in O₂ saturation of Hb |
| Observation | CO₂/H⁺ shift ODC to right | Oxygenation of Hb displaces CO₂ |
| In tissues | Hb releases O₂ | Deoxy-Hb carries more CO₂ |
| In lungs | Hb loads O₂ | Oxy-Hb releases CO₂ |
| Primary benefit | O₂ delivery to tissues + pH buffering | CO₂ removal from tissues to lungs |
| Quantitative impact | ~2-3% augmentation at rest | Doubles CO₂ transport (40-50% of total CO₂ exchange) |
| More important? | Less so | More important (Guyton) |
One-Paragraph Revision Summary
Pulmonary embolism ●Pneumonia
create summary for regulation of respiration in one paragraph