
MYOCARDIAL INFARCTION EVERYTHING FROM BASIC TO CLINICAL
MYOCARDIAL INFARCTION EVERYTHING FROM BASIC TO CLINICAL
myocardial infarction coronary artery occlusion diagram
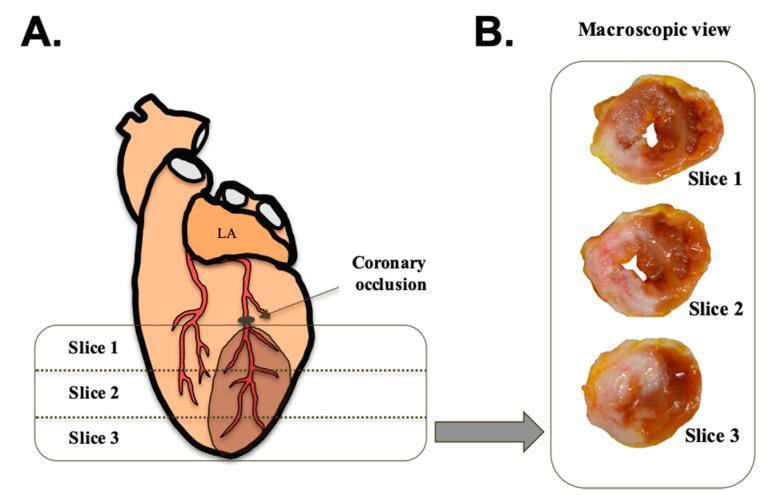
This medical figure illustrates the methodology and visual findings of an experimental myocardial infarction model. Panel A is an anatomical diagram showing a heart with a coronary occlusion placed on a coronary artery distal to the left atrium (LA). A shaded brown region extending inferiorly from the occlusion site represents the infarcted area. The diagram indicates the levels of three transverse ventricular sections labeled Slice 1, Slice 2, and Slice 3. Panel B displays corresponding macroscopic clinical photographs of these three cross-sectional heart slices stained with thioflavin-S under white light. The macroscopic view demonstrates the progression of tissue damage: Slice 1 (proximal) shows a localized area of pale, healthy tissue alongside darker necrotic regions; Slice 2 and Slice 3 (distal) exhibit increasingly larger areas of dark, necrotic tissue, indicating the transmural extent of the infarction throughout the left ventricle. This material is designed for cardiovascular pathology education, specifically illustrating the spatial relationship between arterial ligation and the resulting downstream myocardial necrosis.
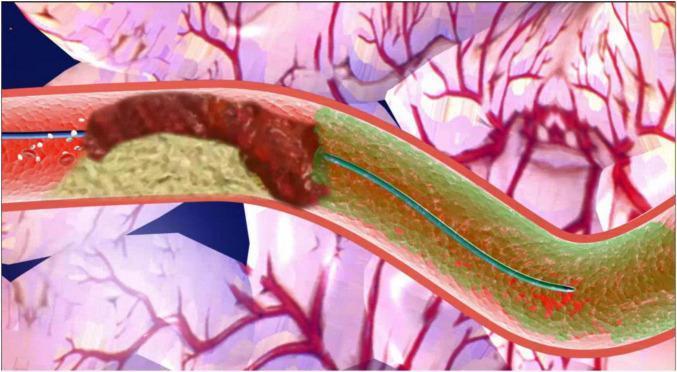
This medical illustration depicts a pathophysiology diagram of an intracoronary artery retrograde thrombolysis (ICART) system during a percutaneous coronary intervention (PCI) for ST-elevation myocardial infarction (STEMI). The primary focus is a longitudinal cross-section of a coronary artery showing total occlusion. A dark reddish-brown, elongated, irregular mass representing a thrombus is visible, situated adjacent to yellowish atherosclerotic plaque material. A thin blue interventional guidewire is shown successfully traversing the occlusion into the distal vessel segment. The distal artery is color-coded green, containing small red patches, indicating the site for retrograde thrombolytic cocktail injection via a microcatheter. The background illustrates the branching coronary vasculature of the heart. This diagram serves as an educational tool to demonstrate the mechanical and pharmacological approach to managing culprit vessel occlusion by delivering thrombolytic agents directly to the distal lumen through a retrograde technique.
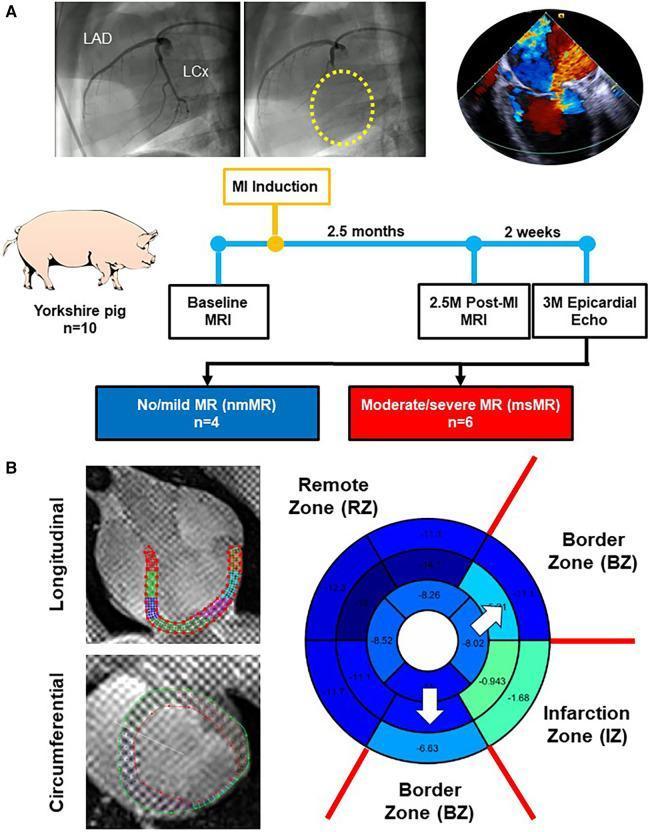
Educational medical composite depicting cardiac imaging analysis in a porcine model of myocardial infarction (MI). Figure A shows the experimental timeline: baseline MRI, MI induction via LCx artery occlusion, and follow-up cardiac MRI and epicardial echocardiography. Angiograms highlight the LAD and LCx coronary arteries. Figure B displays diagnostic images and data visualization of regional myocardial function. Left: Longitudinal and circumferential tagging cardiac MRI views with superimposed green and red myocardial contours for strain analysis. Right: A bull's-eye plot (17-segment model) representing peak strain distribution. The myocardial regions are categorized into three distinct areas: the Infarction Zone (IZ) in the inferolateral region (light green segments), the adjacent Border Zones (BZ) (cyan segments), and the healthy Remote Zone (RZ) (dark blue segments covering the remaining anterior and septal walls). The diagram illustrates spatial classification used to study differences in longitudinal and circumferential strain following ischemic injury and subsequent mitral regurgitation development.
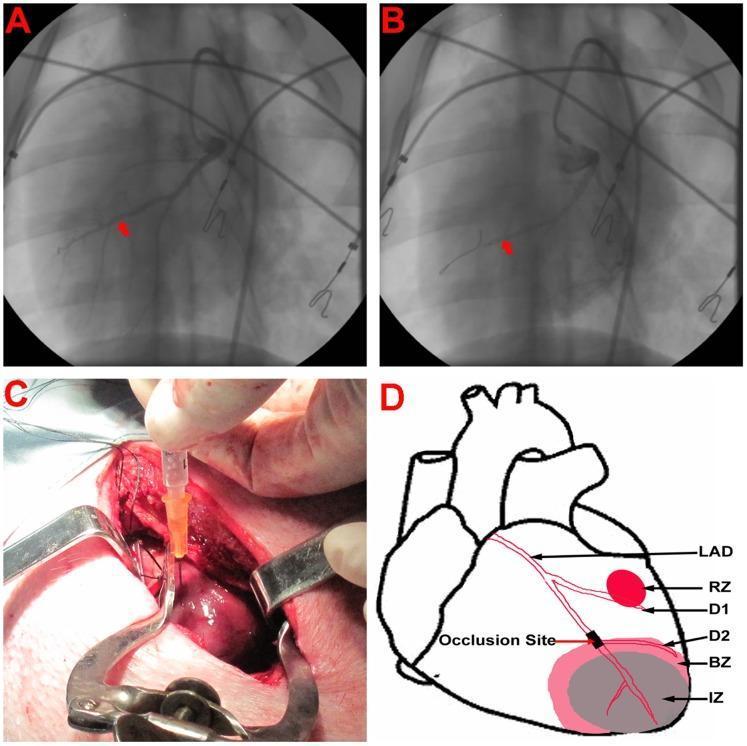
This composite image illustrates the creation and treatment of an acute myocardial infarction (AMI) model. Panel A and B are fluoroscopic angiograms showing the left anterior descending (LAD) artery before (A) and during (B) balloon catheter occlusion, indicated by red arrows. Panel C is a clinical photograph of an open-heart surgical procedure where a hypodermic needle is used for direct intramyocardial injection into the exposed heart surface. Surgical retractors and sutures are visible within the thoracic cavity. Panel D is a schematic anatomical diagram of the heart depicting the coronary anatomy and post-infarct zones. It labels the LAD, its diagonal branches (D1, D2), and the distal occlusion site. The diagram highlights the three functional territories: the Infarct Zone (IZ, grey), the Border Zone (BZ, light pink), and the Remote Zone (RZ, red dot). This visual set demonstrates the methodology for translational cardiology research, specifically modeling ischemic injury and subsequent therapeutic cell delivery.
"myocardial infarction"[MeSH Terms] AND "management"[MeSH Terms]
"myocardial infarction"[MeSH Terms] AND "reperfusion"[MeSH Terms]
STEMI ECG changes ST elevation myocardial infarction electrocardiogram
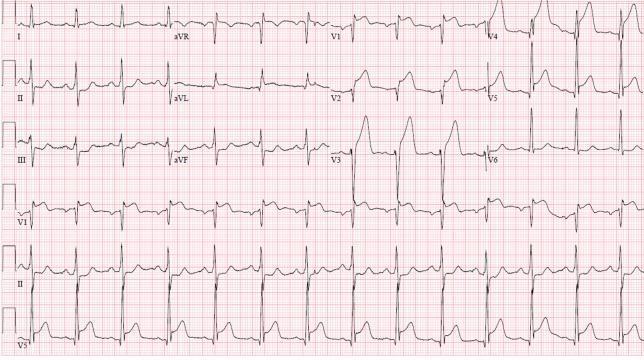
A 12-lead electrocardiogram (ECG) demonstrating an acute anterolateral ST-elevation myocardial infarction (STEMI). The tracing shows significant, convex-upward ST-segment elevation in the precordial leads (V1–V6), consistent with an anterior wall injury. Leads I and aVL also display ST-elevation, indicating lateral involvement. These changes are accompanied by hyperacute, peaked T-waves most prominent in V2 through V4. There is evidence of reciprocal ST-segment depression in the inferior leads (II, III, and aVF). The QRS complexes appear widened in the leads with maximal ST elevation. The heart rhythm is sinus. This ECG pattern is clinically significant for proximal left anterior descending (LAD) artery occlusion, necessitating urgent reperfusion therapy. The visual presentation focuses on teachable hallmarks of cardiac ischemia, including the relationship between anatomical lead distribution and corresponding vascular territories, as well as the identification of reciprocal changes in opposing leads.
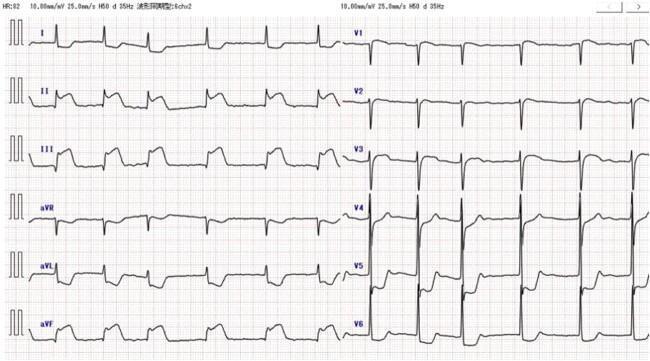
A standard 12-lead electrocardiogram (ECG) demonstrating an acute inferior ST-elevation myocardial infarction (STEMI). The tracing shows significant, convex ST-segment elevation in the inferior leads (II, III, and aVF), consistent with an acute transmural injury in the distribution of the right coronary artery or left circumflex artery. Reciprocal changes are evident as ST-segment depression in the high lateral leads (I and aVL) and the precordial leads (V4 through V6). The rhythm appears to be sinus, and the diagnostic imaging is presented on standard grid paper for the assessment of cardiac electrical activity. This visual is highly relevant for medical education concerning cardiovascular emergencies, acute coronary syndromes (ACS), and the interpretation of reciprocal ECG changes.
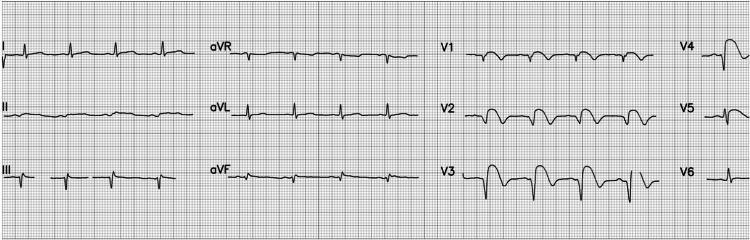
A 12-lead electrocardiogram (ECG) demonstrating an acute ST-elevation myocardial infarction (STEMI) with characteristic anterior and anterolateral findings. The tracing displays a normal sinus rhythm with a heart rate of approximately 84 beats per minute and normal P wave morphology. Significant pathology is localized to the precordial leads, specifically V2 through V5, which exhibit pronounced ST-segment elevation. This elevation presents with a convex 'tombstoning' morphology, a high-risk indicator of extensive myocardial injury. Additionally, evolving QS waves are visible in leads V2 and V3, indicating necrotic changes or transmural infarction. These findings are clinically consistent with an acute occlusion of the left anterior descending (LAD) coronary artery. The limb leads (I, II, III, aVR, aVL, aVF) show relatively stable baselines, though mild reciprocal changes or secondary ST-T wave abnormalities may be present in the inferior leads. This diagnostic image serves as a classic educational example of early-stage STEMI progression and the visual identification of localized ischemic injury on electrocardiography.
myocardial infarction histology coagulative necrosis neutrophil infiltration
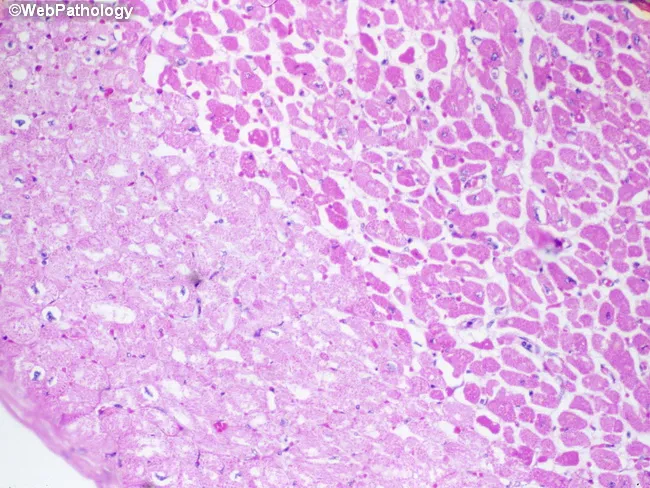
Imaging modality: Light microscopy of hematoxylin-eosin (H&E) stained cardiac tissue. Specimen is paraffin-embedded myocardial section, 5 micron thick, imaged with bright-field optics at high magnification. Anatomic region: left ventricular myocardium with an infarct in the left half of the field. The histology demonstrates pallor of necrotic cardiomyocytes (myocytolysis) produced by sarcolemmal disruption with influx of salt and water and cytoplasmic swelling. In this early post-ischemic stage, fibers lose cross-striations and display increased eosinophilia; nuclei are often absent or pyknotic. The infarct border may show waviness of fibers and mild edema; contraction bands may be present at the margin. Neutrophilic infiltration is typically minimal during the first 24 hours but may begin to appear around this window. The combination of coagulative necrosis, myocytolysis, and pallor indicates an acute myocardial infarction approximately one day old. This histologic pattern correlates with ischemia from coronary occlusion, clinical presentation of acute coronary syndrome, and aligns with diagnostic timelines (0-24 h). Clinically the image supports timing of infarct and helps distinguish acute infarction from myocarditis or chronic scar, serving as an educational reference for pathology, medical education, and research on myocardial injury dynamics. Further confirmed by clinical correlation and education.
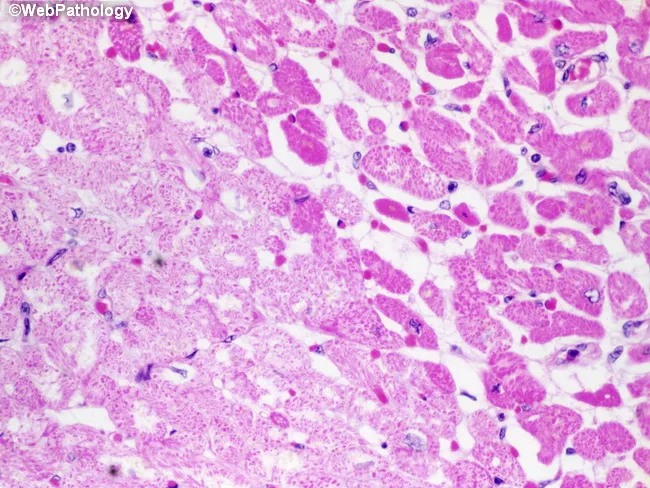
Imaging modality and tissue: light microscopy of hematoxylin and eosin stained myocardial tissue from the left ventricle showing acute infarct with myocytolysis. The left half of the field demonstrates pallor of necrotic cardiac myocytes, consistent with early ischemic injury about one day old. Disruption of the sarcolemma and loss of cytoplasmic integrity produce osmotic swelling as salt and water accumulate within myocytes, yielding pale, swollen, eosinophilic cells. Nuclei are pyknotic or obscured, and cross‑striations are variably preserved in some fibers while others show early coagulative necrosis. The surrounding myocardium exhibits preserved architecture with clear demarcation between infarcted and viable tissue. This stage precedes substantial neutrophilic infiltration and precedes macrophage clearance. The histologic features correlate with an acute coronary syndrome of short duration, typically anterior or lateral wall involvement depending on infarct territory, and predict ongoing impairment of contractility in the affected region. Clinically, this finding supports acute myocardial infarction (AMI) within 24 hours, ischemic necrosis, and myocytolysis as a pathologic correlate of severe ischemia. Differential considerations include early myocarditis, reperfusion injury, or artifact; however, the combination of pallor, sarcolemmal disruption, and myocytolysis most strongly supports early infarction. The image is diagnostic for early infarct with histologic confirmation.
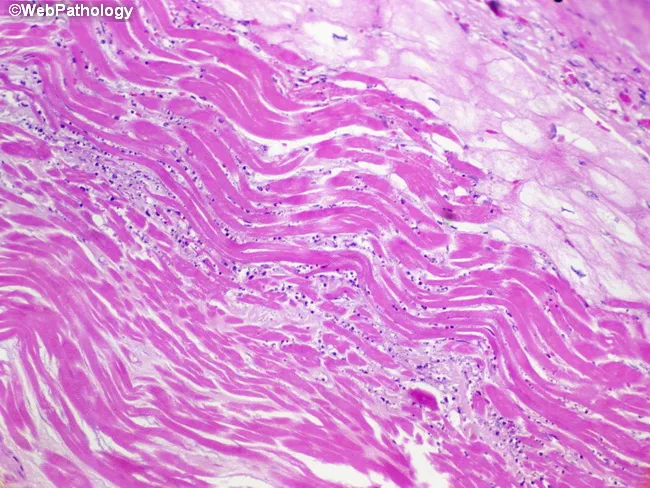
Imaging modality: light microscopy of a cardiac tissue section stained with hematoxylin and eosin reveals infarct border-zone myocardium from the left ventricle. The tissue shows parallel, wavy myocardial fibers along the border between viable and necrotic tissue—a hallmark of early coagulative necrosis in myocardial infarction. The fibers appear elongated and noncontractile, with eosinophilic (pink) cytoplasm and loss of distinctive cross-striations; nuclei are scarce or absent in necrotic cells. In the periphery, viable myocytes tug on adjacent fibers during systole, producing the characteristic waviness. The infarct core is hypo-cellular with meshy eosinophilic areas and early inflammatory cells beginning to infiltrate, consistent with the 6–12 hour window after ischemic onset. These histologic changes reflect irreversible injury, rapid necrosis, and initiation of repair processes. Clinically, recognition of wavy fibers and coagulative necrosis supports an acute MI diagnosis and helps estimate timing, guiding anti-ischemic therapy, reperfusion decisions, and prognostic assessment. This image is representative in education and research contexts for teaching infarct evolution, distinguishing acute from subacute tissue changes, and illustrating the border zone pathophysiology in cardiology and pathology education. This micrograph serves as a teaching tool for students, residents, and researchers studying ischemic injury timelines, scar formation, and therapeutic windows in infarcted myocardium.
cardiac troponin release biomarkers myocardial infarction timeline graph
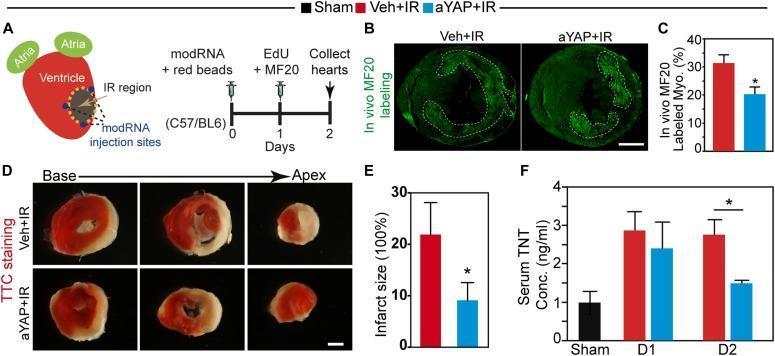
This composite educational image details a preclinical study on myocardial ischemia-reperfusion (IR) injury and the cardioprotective effects of active YAP (aYAP) modified RNA (modRNA). Panel A illustrates the experimental design: LAD ligation followed by modRNA and red bead injection, with subsequent histological collection. Panel B presents fluorescence microscopy of heart cross-sections with in vivo MF20 labeling (green), a marker for necrotic cardiomyocytes. The vehicle control (Veh+IR) shows significantly more extensive green fluorescence compared to the aYAP+IR group, which is quantified in Panel C as a reduced percentage of MF20-labeled myocardium. Panel D shows Triphenyltetrazolium chloride (TTC) staining of heart slices from base to apex. Viable tissue stains red, while infarcted tissue appears pale/white. The aYAP+IR group demonstrates visibly smaller infarct zones across all levels compared to the Veh+IR group. This is quantified in Panel E, showing a significant reduction in infarct size. Panel F displays a bar graph of serum cardiac Troponin T (cTnT) concentrations, indicating lower levels in the aYAP-treated group at Day 2, reflecting reduced myocardial damage. The content demonstrates pathophysiology, therapeutic intervention, and diagnostic biomarkers of myocardial infarction.
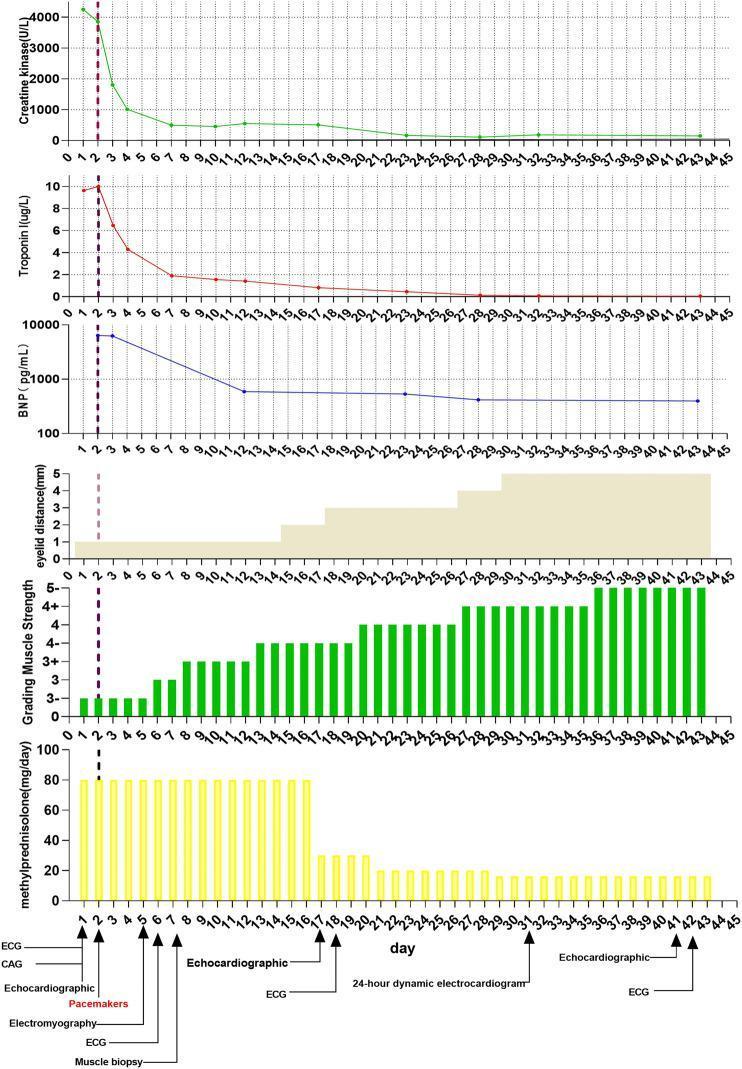
A multi-panel timeline chart illustrating the clinical and biochemical progression of a patient with immune-checkpoint inhibitor (ICI)-induced multiorgan failure, including myocarditis and myasthenia gravis. The top three line graphs track cardiac and muscle biomarkers: Creatine Kinase (U/L), Troponin I (ug/L), and Brain Natriuretic Peptide (BNP, pg/mL). All markers show a sharp peak followed by a rapid decline toward normalization following the initiation of treatment on day 1 (marked by a vertical dashed line). Middle panels consist of a shaded area graph showing an increase in eyelid distance (mm) from 0 to 4mm and a bar chart demonstrating a steady improvement in Grading Muscle Strength from 2 to 5+. The bottom bar chart detail the methylprednisolone dosage (mg/day), starting at 80 mg/day with a gradual taper after day 17. A timeline footer indicates the timing of diagnostic interventions, including electrocardiography (ECG), coronary angiography (CAG), echocardiography, muscle biopsy, electromyography, and pacemaker implantation. This visual data correlates high-dose corticosteroid therapy with the resolution of biochemical markers and clinical improvement in myopathic and cardiac symptoms.
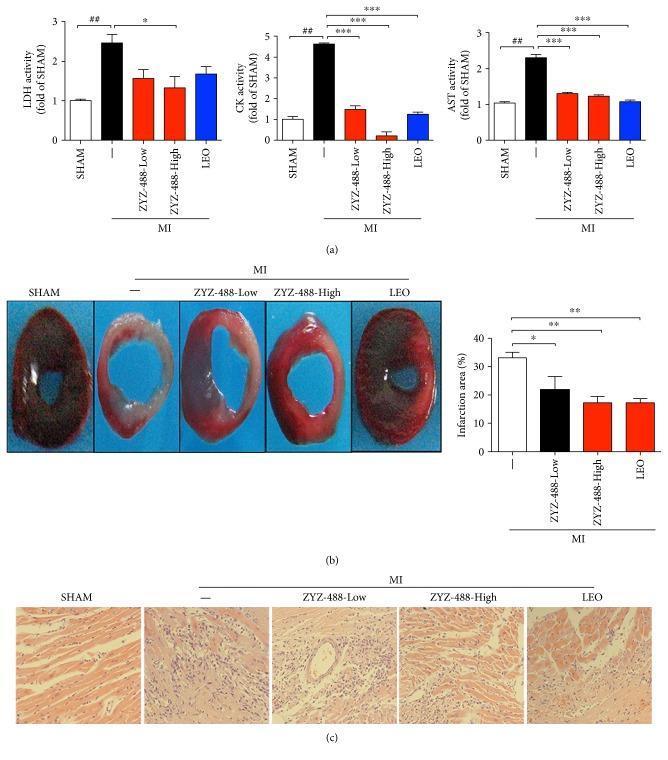
Educational panel illustrating the cardioprotective effects of ZYZ-488 in a murine model of acute myocardial infarction (MI). Section (a) contains three bar graphs showing serum levels of cardiac biomarkers LDH, CK, and AST, which significantly increase post-MI and decrease with ZYZ-488 treatment. Section (b) displays cross-sections of murine hearts stained with triphenyltetrazolium chloride (TTC); viable tissue appears dark red, while infarcted tissue is pale/white. The MI group shows a large infarct, which is reduced in the ZYZ-488 (Low/High) and LEO (positive control) groups. An accompanying bar graph quantifies the infarct area percentage. Section (c) shows H&E-stained histological microphotographs (200x) of the myocardial border zone. The SHAM group exhibits organized myofibers, while the MI group shows significant tissue disruption and inflammatory infiltration. Treatment groups (ZYZ-488 and LEO) show preserved cardiomyocyte arrangement and reduced inflammatory cell presence, indicating therapeutic attenuation of ischemic injury and preservation of myocardial structural integrity.
myocardial infarction complications cardiac rupture mural thrombus ventricular aneurysm
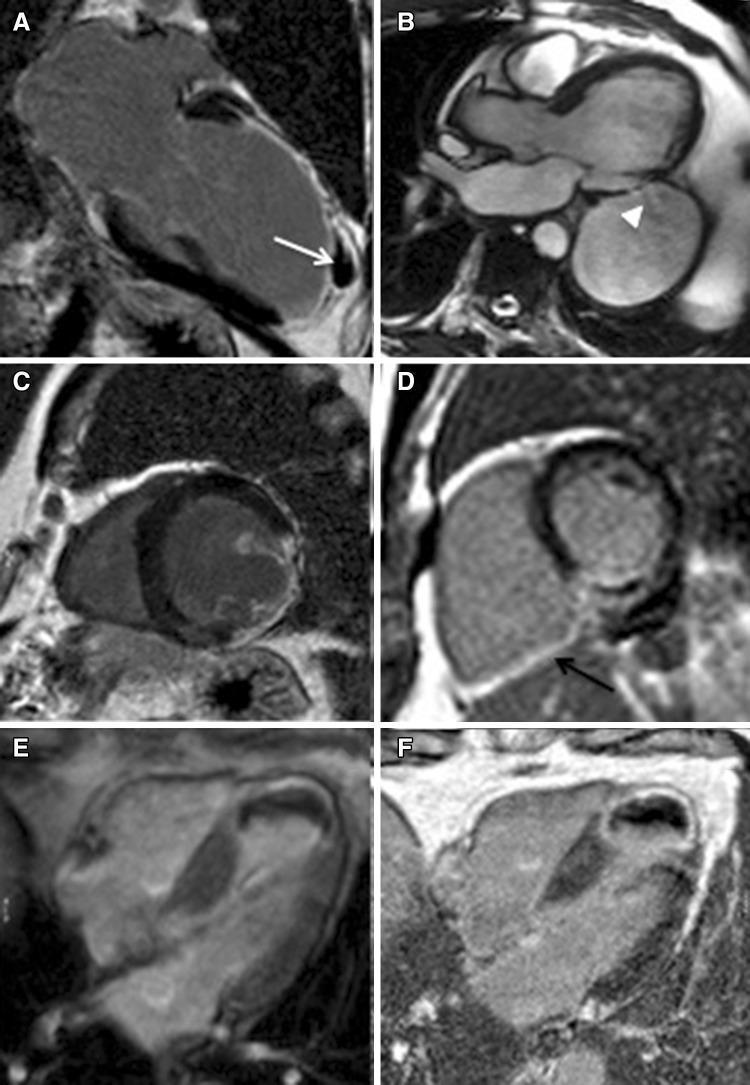
This composite of cardiac magnetic resonance (CMR) images illustrates various mechanical and ischemic complications following acute myocardial infarction. (A) Two-chamber long-axis post-contrast view showing a contained chronic rupture of the anterior left ventricular (LV) wall (white arrow). (B) Three-chamber long-axis cine frame demonstrating a large pseudo-aneurysm of the mid-cavity inferolateral wall with a narrow 'tunnel-like' connection (white arrowhead) showing active flow. (C) Short-axis post-contrast image identifying myocardial infarction within the papillary muscles. (D) Short-axis post-contrast sequence highlighting right ventricular (RV) inferior wall involvement (black arrow) associated with basal inferior LV infarction. (E, F) Four-chamber long-axis views in early and late gadolinium enhancement phases, respectively, depicting a large apical thrombus. The thrombus is characterized by a persistent low-signal (dark) intensity in both phases due to its avascular nature. These diagnostic images are essential for characterizing structural damage, identifying myocardium at risk, and distinguishing between true and pseudo-aneurysms in the setting of coronary artery disease.
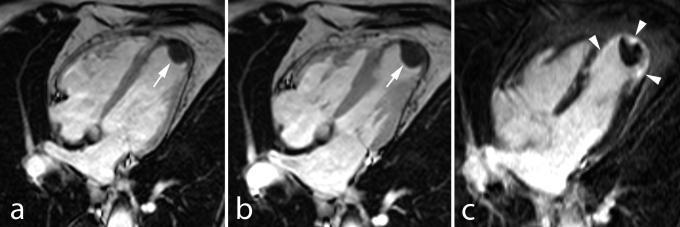
This set of three cardiac MRI (CMR) images in the horizontal long-axis (four-chamber) view illustrates the complications of an old anterior myocardial infarction in a patient with heart failure. Panel (a) is a cine MRI frame and panel (b) is an early contrast-enhanced MRI (ce-MRI), both demonstrating an apical aneurysm of the left ventricle containing a large, hypoenhanced, non-vascularized mural thrombus (indicated by arrows). Panel (c) shows late gadolinium enhancement (LGE) imaging in the same plane, which highlights transmural hyperenhancement of the apical wall (indicated by arrowheads), characteristic of replacement fibrosis and myocardial scarring. The diagnostic images provide a clinical comparison between early post-contrast sequences used to detect intracavitary thrombi and late enhancement sequences used to assess myocardial viability and infarct size. Key educational concepts include ventricular remodeling, post-infarct aneurysm formation, and the imaging characteristics of mural thrombi versus scarred myocardium.
MYOCARDIAL INFARCTION - Complete Reference
1. DEFINITION
2. EPIDEMIOLOGY & RISK FACTORS
- Leading cause of morbidity and mortality worldwide
- ~10% of MIs occur before age 40; ~45% before age 65
- Men > women (gap narrows post-menopause; declining estrogen accelerates atherosclerosis)
- Risk factors mirror atherosclerosis: hypertension, hyperlipidemia, diabetes mellitus, smoking, obesity, family history, sedentary lifestyle
3. ETIOLOGY - CAUSES OF MI
| Type | Mechanism |
|---|---|
| Type 1 | Spontaneous - atherosclerotic plaque rupture/erosion with thrombosis (most common) |
| Type 2 | Supply-demand mismatch (coronary spasm, tachycardia, anemia, hypotension) without plaque rupture |
| Type 3 | Sudden cardiac death before biomarkers obtainable |
| Type 4a/b | PCI-related or stent thrombosis |
| Type 5 | CABG-related |
4. PATHOGENESIS - STEP BY STEP
The Coronary Occlusion Sequence
- Plaque disruption: An atheromatous plaque is eroded or suddenly disrupted by endothelial injury, intraplaque hemorrhage, or mechanical forces - exposing subendothelial collagen and necrotic plaque core to circulating blood
- Platelet adhesion and aggregation: Platelets adhere, aggregate, and release thromboxane A2, ADP, and serotonin - causing further platelet aggregation and vasospasm
- Coagulation cascade activation: Exposure of tissue factor adds to the growing thrombus
- Complete occlusion: The enlarging thrombus may completely occlude the lumen within minutes
Angiography performed within 4 hours of MI onset demonstrates coronary thrombosis in ~90% of cases. By 12-24 hours, thrombosis is detectable in only 60% (some occlusions clear spontaneously via fibrinolysis or spasm release). - Robbins Basic Pathology
5. PATHOPHYSIOLOGY OF ISCHEMIA
Cellular Sequence After Occlusion
| Time | Event |
|---|---|
| Seconds | Aerobic metabolism ceases; ATP drops; lactic acid accumulates |
| Minutes | Contractile failure (reversible) |
| 20-40 min | Point of no return - irreversible injury begins; coagulative necrosis starts |
| Hours | Sarcolemmal disruption; intracellular macromolecules leak; cardiac troponins detectable |
- Cardiac muscle requires ~1.3 mL O2/100g/min to remain alive; the normal resting LV receives ~8 mL O2/100g/min. If even 15-30% of normal coronary flow is maintained, muscle will survive. - Guyton & Hall
- The infarcted area becomes bluish-brown (deoxygenated blood stagnates), vessels appear engorged, edema develops, and cells begin to swell due to failed cellular metabolism
Wavefront Phenomenon
Why Subendocardium is Most Vulnerable
- Most distal from epicardial vessels
- Highest oxygen consumption
- Vessels intensely compressed during systole (impeding inflow)
- Any hypoperfusion causes damage here first, then spreads epicardially
6. TYPES OF MI BY ANATOMY
| Type | Description |
|---|---|
| Transmural (STEMI) | Full-thickness LV involvement; epicardial vessel occlusion via atherosclerosis + thrombosis |
| Subendocardial (NSTEMI) | Inner 1/3 of myocardium; thrombus lysed before necrosis becomes transmural |
| Microscopic infarcts | Small-vessel disease; vasculitis; emboli; no diagnostic ECG changes |
- Nearly all transmural infarcts affect the left ventricle and/or interventricular septum
- ~15-30% of posterior/posteroseptal MIs extend into the right ventricle
- Isolated RV infarcts = 1-3% of IHD cases - Robbins Basic Pathology
7. MORPHOLOGY & HISTOPATHOLOGY (Temporal Evolution)
| Time | Gross Appearance | Microscopic Features |
|---|---|---|
| <12 hours | Usually not grossly visible | Early coagulative necrosis; wavy fiber pattern at border; myocytolysis; loss of cross-striations |
| 12-24 hours | Pale/dark mottling begins; TTC staining shows non-staining infarcted area (LDH leaks out) | Coagulative necrosis; pyknotic nuclei; minimal neutrophilic infiltrate beginning |
| 1-3 days | Pallor with yellow-tan center | Dense neutrophilic infiltrate (peak) |
| 3-7 days | Yellow-tan, soft; most vulnerable to rupture | Neutrophil dissolution; early macrophage infiltration; lysis of necrotic myocytes |
| 7-10 days | Maximally soft, yellow-tan | Phagocytic macrophage clearance of necrotic debris |
| 2-8 weeks | Red-gray, scar forming at edges | Granulation tissue (loose connective tissue + abundant capillaries) |
| >2 months | White firm fibrous scar | Dense collagenous scar (Masson trichrome: blue); few residual cardiac muscle cells |
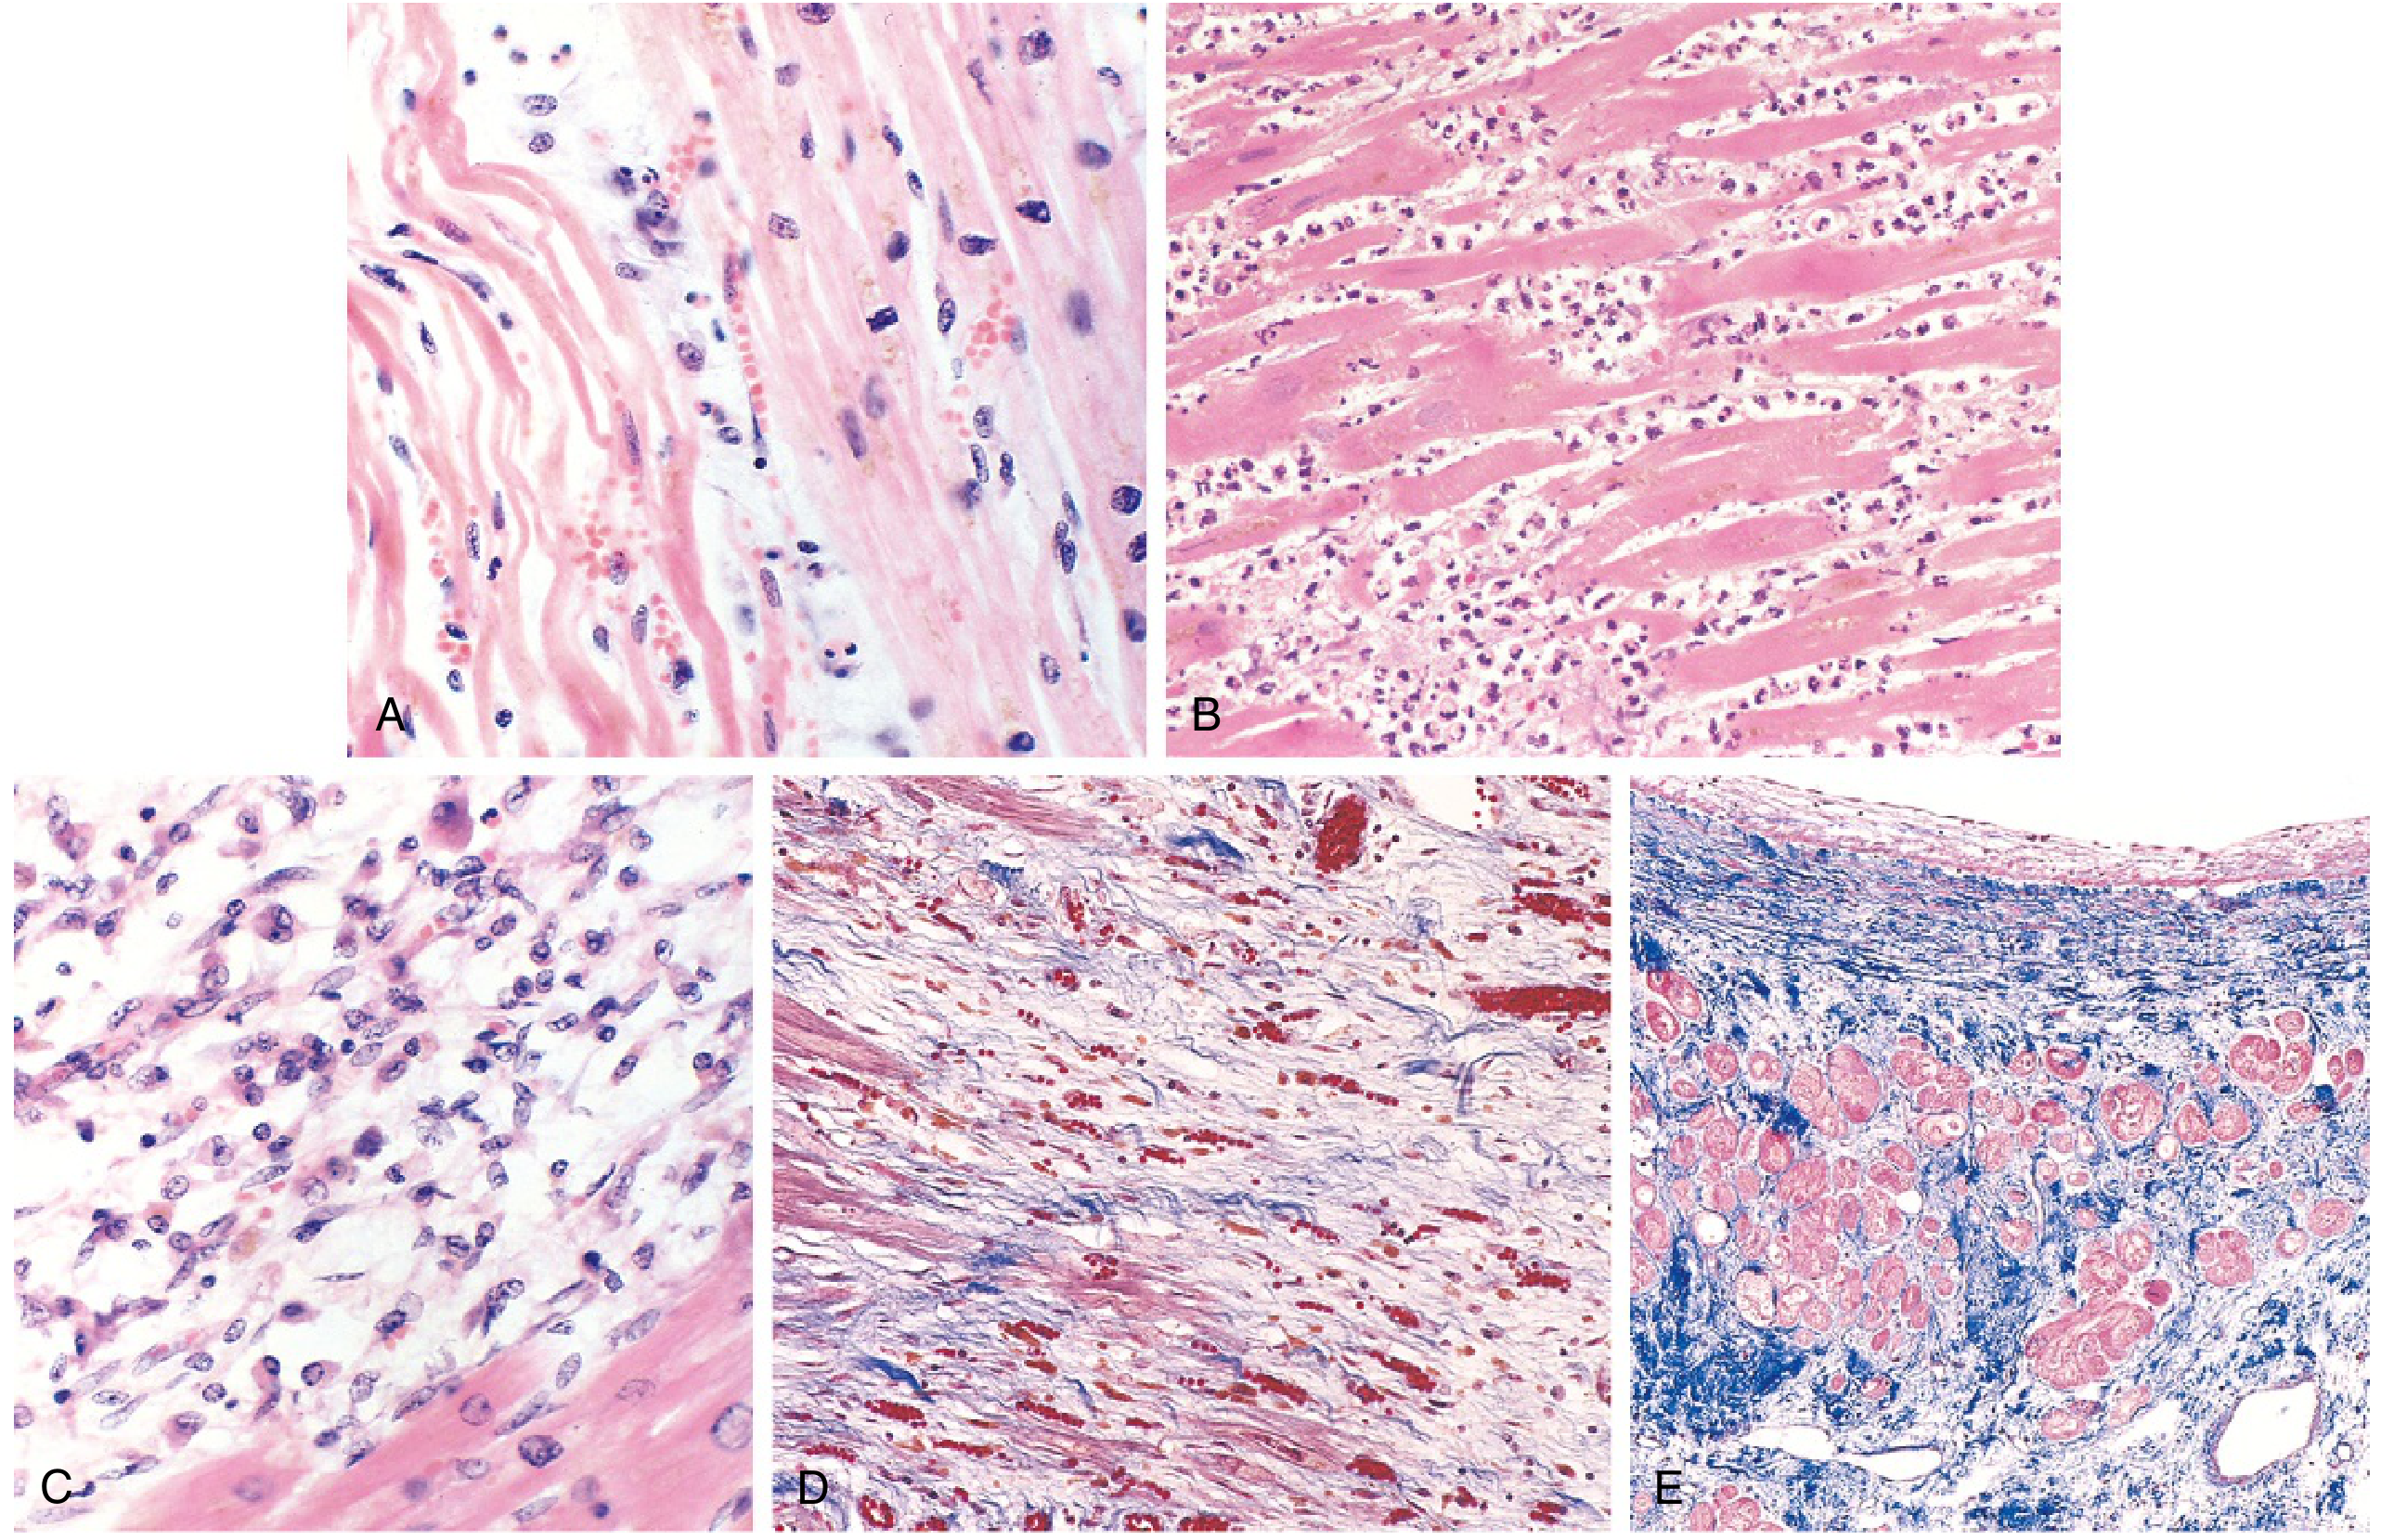
8. REPERFUSION INJURY
- Calcium overload: Ca²+ influx through damaged plasma membrane and intracellular store release → uncontrolled myofibril contractions → cell death
- Reactive oxygen species (ROS): Superoxide, H₂O₂, hydroxyl radicals produced within minutes of reperfusion; damage membrane proteins and phospholipids
- "No-reflow" phenomenon: Leukocyte aggregation occludes microvasculature; mediated by phospholipase A2 activation, arachidonic acid metabolites, platelet and complement activation; complement causes endothelial injury and swelling
9. CLINICAL FEATURES
Symptoms
- Classic: Severe, crushing substernal chest pain/pressure, radiating to neck, jaw, epigastrium, or left arm; lasts minutes to hours; NOT relieved by nitroglycerin or rest
- Associated: Diaphoresis, nausea (especially posterior wall MIs), dyspnea, weakness, anxiety
- Silent MI (~25%): Entirely asymptomatic - especially common in diabetics (autonomic neuropathy) and the elderly
- Pulse is rapid and weak; patient appears diaphoretic
Examination Findings
- Tachycardia (compensatory), or bradycardia (inferior MI/vagal)
- Hypotension (cardiogenic shock if large infarct)
- S3 or S4 gallop (LV dysfunction)
- New murmur (papillary muscle dysfunction, VSD)
- Signs of pulmonary edema (impaired contractility + mitral valve apparatus dysfunction)
10. ELECTROCARDIOGRAPHY
| Defect in Infarcted Cells | Current Flow | ECG Change |
|---|---|---|
| Rapid repolarization (K+ channel opening) | Out of infarct | ST segment elevation |
| Decreased resting membrane potential (K+ loss) | Into infarct | TQ segment depression (recorded as ST elevation) |
| Delayed depolarization | Out of infarct | ST segment elevation |
- Hyperacute T waves (first minutes-hours): tall, peaked T waves
- ST elevation (hours): hallmark of STEMI; leads opposite the infarct show reciprocal ST depression
- Q waves (days-weeks): dead muscle is electrically silent; Q waves appear in leads over the infarct (transmural infarcts)
- T wave inversion (weeks): evolves as injury phase resolves
- Non-Q wave infarcts (NSTEMI) tend to be less severe but carry a high risk of subsequent reinfarction
ECG Localization of Infarction
| Lead Changes | Territory | Artery |
|---|---|---|
| V1-V4 | Anterior | LAD |
| I, aVL, V5-V6 | Lateral | LCx or Diagonal |
| II, III, aVF | Inferior | RCA (or LCx) |
| V1-V2 (tall R, ST depression) | Posterior | RCA/LCx |

11. BIOMARKERS (CARDIAC ENZYMES)
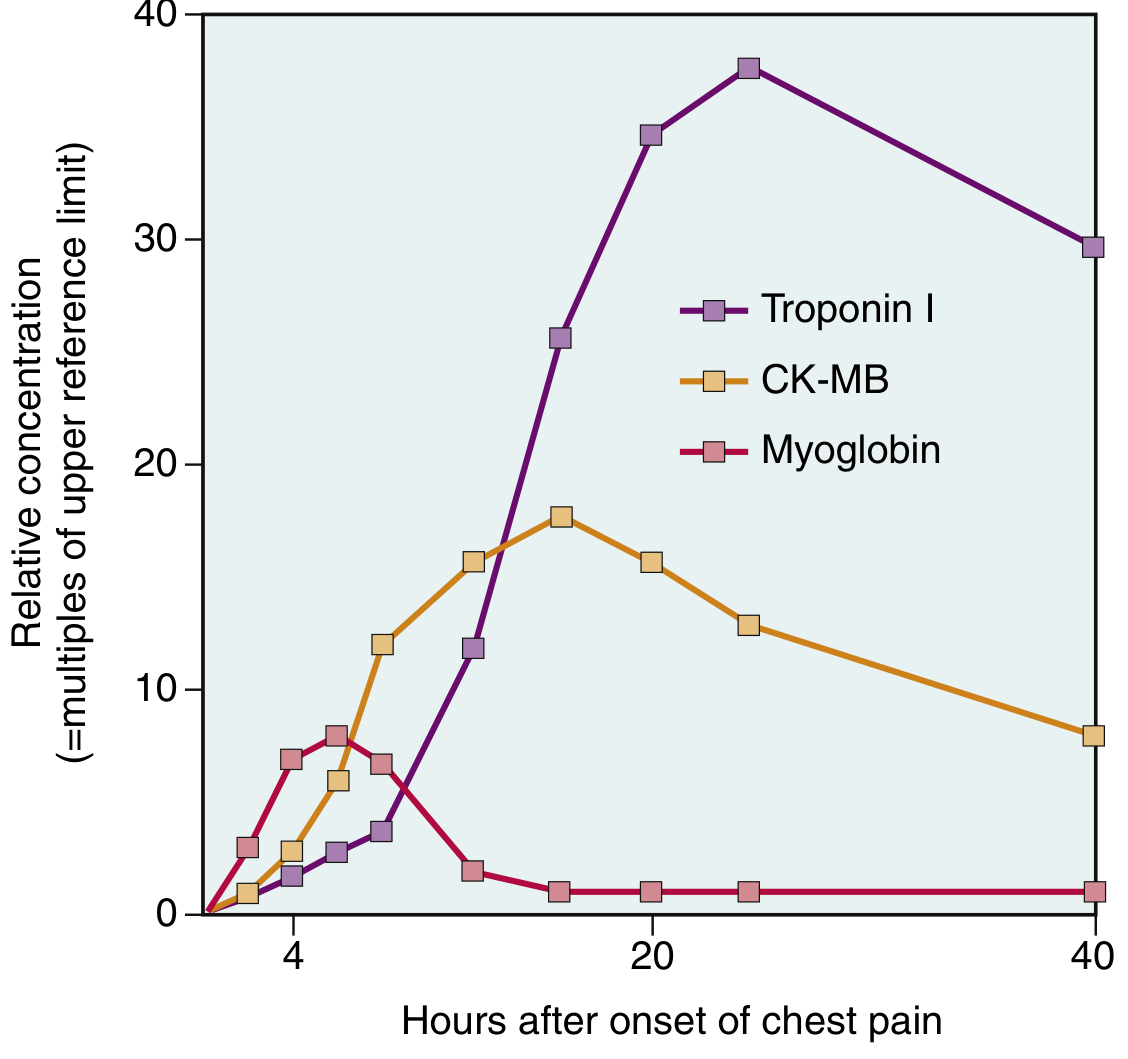
| Marker | Rises | Peaks | Returns to Normal | Notes |
|---|---|---|---|---|
| High-sensitivity Troponin I/T | 2-4 h | 24-48 h | 7-10 days | Gold standard; high sensitivity and specificity; stays elevated longest |
| CK-MB | 2-4 h | 24-48 h | ~72 h | Useful for detecting reinfarction (re-elevation); less used now |
| Myoglobin | 1-2 h | 6-8 h | 24 h | Rises earliest, least specific |
- With reperfusion, both troponin and CK-MB may peak earlier ("washout" phenomenon) - useful as a marker of successful reperfusion
- TnI and TnT are normally undetectable in circulation
- High-sensitivity troponin assays allow earlier rule-in/rule-out with serial measurements at 0h and 1-3h intervals - Goldman-Cecil Medicine
12. DIAGNOSIS
Fourth Universal Definition Criteria
- Symptoms of myocardial ischemia
- New ischemic ECG changes
- New pathological Q waves
- Imaging evidence of new loss of viable myocardium or new regional wall motion abnormality
- Angiographic/autopsy evidence of culprit lesion
Additional Investigations
- 12-lead ECG: First and most important test (within 10 minutes of presentation)
- Echocardiography: Detects regional wall motion abnormalities; assesses LV function, pericardial effusion, mechanical complications
- Coronary angiography: Defines coronary anatomy; guides revascularization
- Chest X-ray: Pulmonary edema, cardiomegaly, aortic dissection exclusion
- CBC, metabolic panel, coagulation studies
13. MANAGEMENT
A. Acute STEMI - Reperfusion Strategy
"Early restoration of coronary perfusion limits infarct size, preserves LV function, and reduces mortality. All other therapies are secondary and should not delay the timely goal of achieving coronary reperfusion." - Washington Manual of Medical Therapeutics
- Superior vessel patency (TIMI 3 flow)
- Less reinfarction
- Less intracranial hemorrhage
- Improved survival regardless of lesion location or patient age - Washington Manual
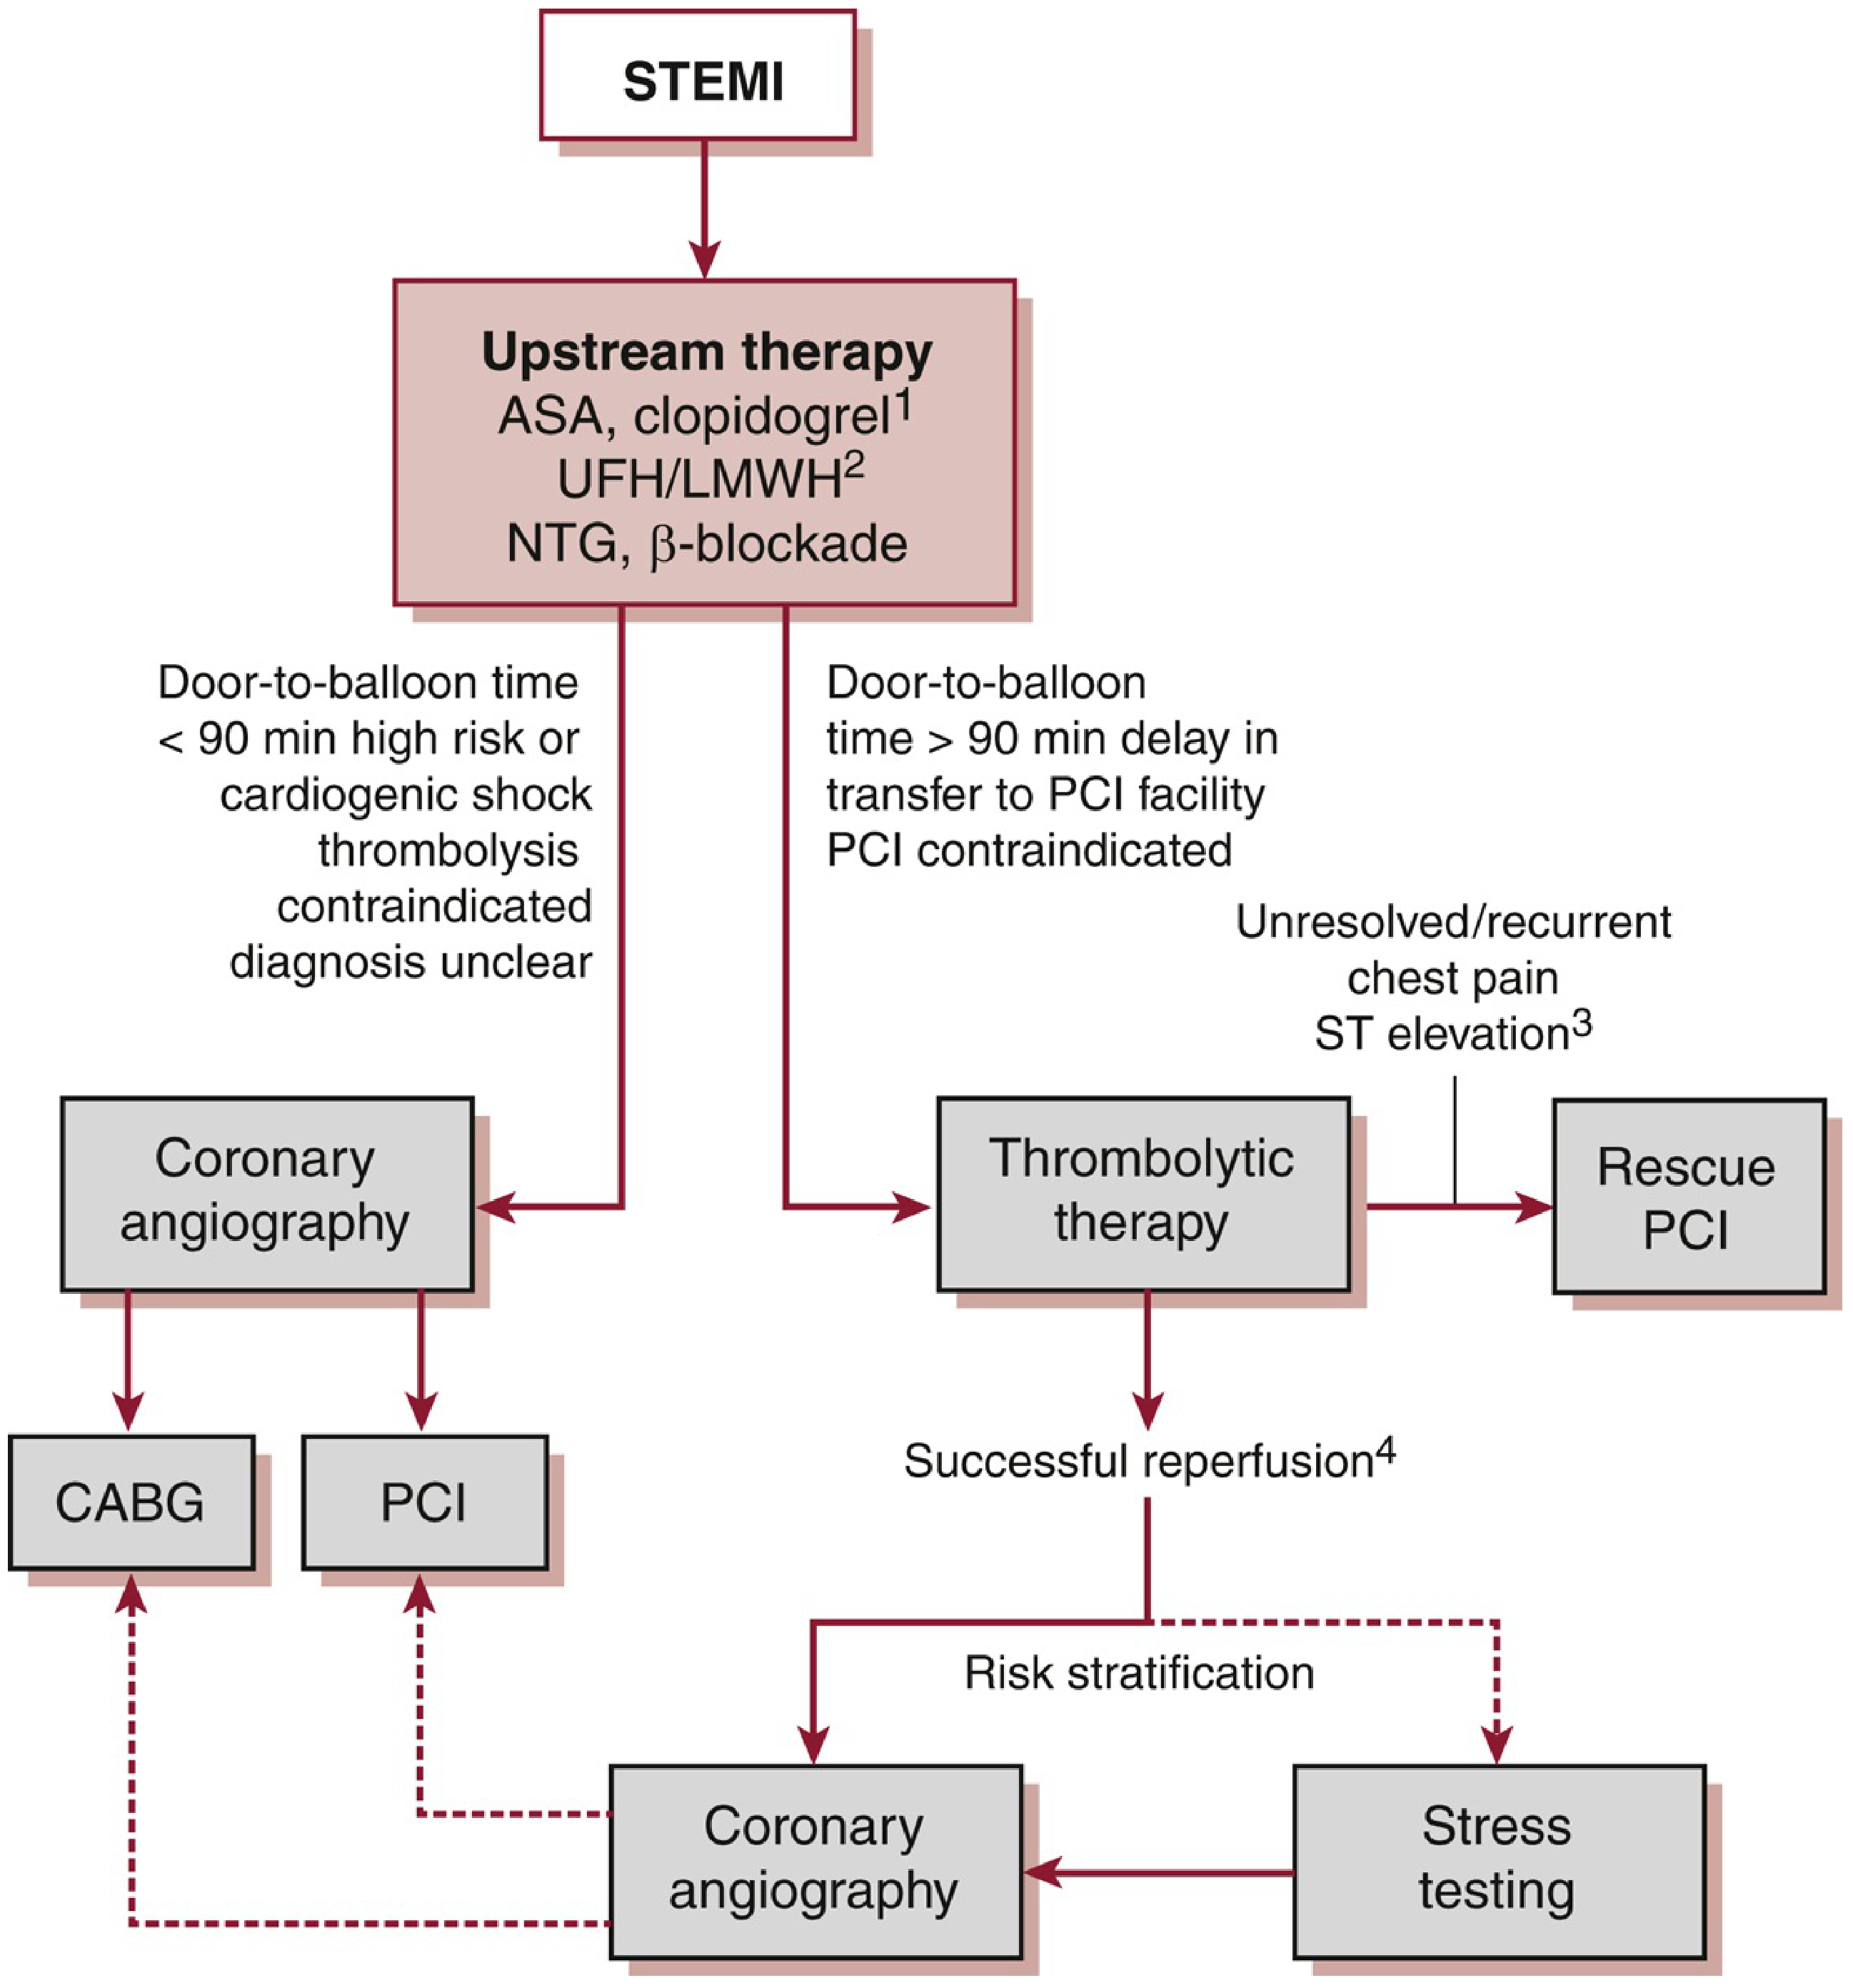
B. Acute Pharmacologic Management (MONA-BASH + Dual Antiplatelet)
| Drug | Dose/Details |
|---|---|
| Morphine | 2-4 mg IV q5min; for pain relief; beware bradycardia (vagotonic), hypotension (venous pooling), GI absorption slowing of orals |
| Oxygen | Only if SpO2 <90%; supplemental O2 not recommended if saturation is normal |
| Nitroglycerin | Sublingual 0.4 mg q5min x 3; IV for ongoing ischemia; CONTRAINDICATED if SBP <90 mmHg, RV infarction, or PDE-5 inhibitor use within 24h |
| Aspirin | 160-325 mg chewed immediately; reduces TXA2 via COX-1 inhibition; then 75-162 mg/day maintenance |
- Ticagrelor (preferred over clopidogrel for STEMI/NSTEMI): 180 mg loading dose, then 90 mg BID
- Prasugrel (with PCI): 60 mg loading, 10 mg daily; contraindicated if prior stroke/TIA
- Clopidogrel: 300-600 mg loading; use if fibrinolytics given (not ticagrelor/prasugrel with fibrinolytics)
- Unfractionated heparin (UFH): with PCI or thrombolytics
- LMWH (enoxaparin): validated with fibrinolytics; preferred over UFH with fibrinolytics
- Fondaparinux: preferred with fibrinolytics (lower bleeding risk)
- Bivalirudin: studied only with PCI
- Metoprolol IV 5 mg q2-5min x 3 doses (if HR >60, SBP >100, PR interval <240ms, no contraindications)
- Reduce reinfarction risk and ventricular fibrillation
- CONTRAINDICATED in: pulmonary edema, bradycardia, heart block, active bronchospasm, cardiogenic shock
C. Secondary Prevention / Post-MI Medications
| Drug Class | Indication | Drug/Notes |
|---|---|---|
| DAPT | All ACS patients | 12 months minimum with DES |
| ACE inhibitor/ARB | All MI patients (especially if EF <40%) | Prevent adverse LV remodeling |
| Beta-blocker | All MI patients | Long-term cardioprotective |
| Statin (high-intensity) | All MI patients | Atorvastatin 40-80 mg or Rosuvastatin 20-40 mg |
| Aldosterone antagonist | EF <40% + HF or diabetes | Eplerenone/spironolactone |
| Anticoagulation | If LV thrombus, AF, or large anterior MI | Warfarin or NOAC |
D. NSTEMI/UA Management
- Same initial stabilization as STEMI
- No emergency fibrinolysis
- Risk stratify with TIMI or GRACE score
- High-risk features (ongoing ischemia, hemodynamic instability, new ST changes): early invasive strategy (<24h)
- Low-risk: Medical management, stress test before discharge
E. Revascularization - PCI vs CABG
| Factor | Favors PCI | Favors CABG |
|---|---|---|
| Disease extent | Single or double vessel | 3-vessel, left main |
| Diabetes | Equal in less severe disease | Better for multivessel |
| Anatomy | Simple, proximal lesions | Chronic total occlusions, complex anatomy |
| SYNTAX score | Low | High |
14. COMPLICATIONS
Potentially Lethal Mechanical Complications
- Ventricular septal rupture (most common type): Creates a VSD; acute biventricular failure
- Papillary muscle rupture: Severe acute mitral regurgitation; pulmonary edema
- Free wall rupture (least common, most serious): Hemopericardium → cardiac tamponade → sudden death
- Ventricular fibrillation: major cause of out-of-hospital death (1/3 of STEMI patients die of arrhythmia within 1 hour, before reaching hospital)
- Accelerated idioventricular rhythm: benign reperfusion arrhythmia
- Heart block: especially inferior MI (RCA supplies AV node); atropine ± pacemaker
- VT: due to re-entry circuits in peri-infarct zone
- AF: in 10-15%; thromboembolism risk
- Decreased cardiac output → systolic stretch (ischemic area balloons outward during systole instead of contracting)
- Mortality >50% without mechanical support; IABP, Impella, ECMO
- Requires emergent PCI
- Acute LV failure: pulmonary edema (crackles, elevated BNP)
- Killip classification (Class I-IV predicts mortality)
Other Complications
- Early (1-3 days): fibrinous pericarditis from inflammation overlying infarct
- Dressler's syndrome (1-8 weeks): Autoimmune pericarditis with fever, pleuritis, pleural effusion; treat with NSAIDs/colchicine
- Forms in akinetic/dyskinetic areas (especially large anterior MI with apical involvement)
- Risk of systemic embolism (stroke); treat with anticoagulation
- Late complication from large transmural anteroseptal infarct
- Thinned, dyskinetic scar wall
- Causes mural thrombi, arrhythmias, heart failure
- Does NOT rupture (mature scar, unlike pseudoaneurysm)
- Complicates inferior MI (RCA occlusion)
- Classic triad: hypotension + elevated JVP + clear lungs
- Nitrates contraindicated; manage with IV fluid loading
15. PROGNOSIS AND MORTALITY
- Overall in-hospital death rate: 7-8% (STEMI ~10%, NSTEMI ~6%)
- Out-of-hospital: 1/3 of STEMI patients die within 1 hour of symptom onset (arrhythmia) before receiving care
- Long-term prognosis depends primarily on:
- Quality of left ventricular function (ejection fraction)
- Severity of residual coronary atherosclerosis
- With reperfusion therapy and optimal medical management, 30-day mortality for STEMI has fallen to ~5% in high-volume PCI centers
- Recent meta-analysis (PMID 40854299) shows smartphone-based systems reduce door-to-balloon times in STEMI, improving outcomes
- Prehospital P2Y12 inhibitor administration before primary PCI improves coronary reperfusion - systematic review 2024
16. SPECIAL SITUATIONS
Silent MI (Type 2 / No-pain)
- ~25% of MIs are asymptomatic
- More common in diabetics (autonomic neuropathy) and elderly
- Often detected incidentally on ECG or echo
MI in Women
- More atypical presentation (jaw pain, back pain, fatigue, nausea without chest pain)
- More likely to have non-obstructive CAD (MINOCA: MI with Non-Obstructive Coronary Arteries)
- Higher procedural complications and in-hospital mortality historically
MINOCA (MI with Non-Obstructive Coronary Arteries)
- Coronary stenosis <50% on angiography
- Mechanisms: vasospasm, microvascular disease, plaque erosion, spontaneous dissection, Takotsubo
- ~5-10% of all MI
Takotsubo (Stress) Cardiomyopathy
- Transient apical ballooning; triggered by emotional/physical stress; mimics anterior STEMI
- Catecholamine surge; usually in post-menopausal women
- Generally recovers fully within weeks
17. SUMMARY TABLE - Quick Reference
| Feature | STEMI | NSTEMI/UA |
|---|---|---|
| Coronary occlusion | Complete (total) | Partial |
| ECG | ST elevation / new LBBB | ST depression, T-wave inversion, or normal |
| Troponin | Markedly elevated | Elevated (NSTEMI) or normal (UA) |
| Infarct depth | Transmural | Subendocardial |
| Reperfusion | Emergency PCI/fibrinolysis | Risk stratify; early invasive if high-risk |
| Mortality | Higher (~10%) | Lower (~6%) |
- Robbins & Kumar Basic Pathology (Robbins Pathology), Chapter 9 - Ischemic Heart Disease
- Braunwald's Heart Disease, 2 Vol Set - Chapter 101
- Harrison's Principles of Internal Medicine 22E (2025) - Chapter 286
- Goldman-Cecil Medicine - Chapter 58
- Guyton and Hall Textbook of Medical Physiology - Chapter 21
- Ganong's Review of Medical Physiology, 26th Edition - Chapter 29
- Washington Manual of Medical Therapeutics - Chapter 4
- Fuster and Hurst's The Heart, 15th Edition