
DM
Diabetes
What aspect of diabetes are you interested in? · Which type of diabetes?
Type 1 diabetes mellitus pathophysiology autoimmune beta cell destruction
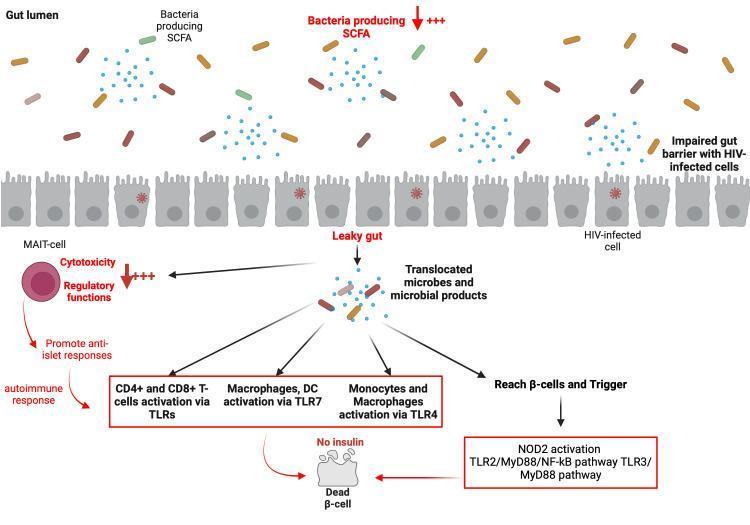
This pathophysiology diagram illustrates the link between HIV-associated gut dysbiosis and the development of Type 1 Diabetes Mellitus (T1DM). The upper section shows the gut lumen with decreased short-chain fatty acid (SCFA)-producing bacteria. An impaired gut barrier is depicted with HIV-infected epithelial cells, leading to a 'leaky gut' and the translocation of microbes and microbial products into the systemic circulation. This translocation triggers two primary pathways: 1) Systemic immune activation via Toll-like receptors (TLRs), involving CD4+/CD8+ T-cells, macrophages, dendritic cells (DCs), and monocytes, which promotes an autoimmune anti-islet response. 2) Direct interaction of microbial products with pancreatic beta cells, triggering intracellular signaling pathways including NOD2, TLR2/MyD88/NF-kB, and TLR3/MyD88. The diagram further highlights the role of Mucosal-Associated Invariant T (MAIT)-cells, which exhibit altered cytotoxicity and regulatory functions under these conditions. The final outcome is pancreatic beta-cell destruction (dead beta-cell) and the cessation of insulin production, illustrating a proposed mechanism for secondary autoimmune diabetes in people living with HIV (PLWH).
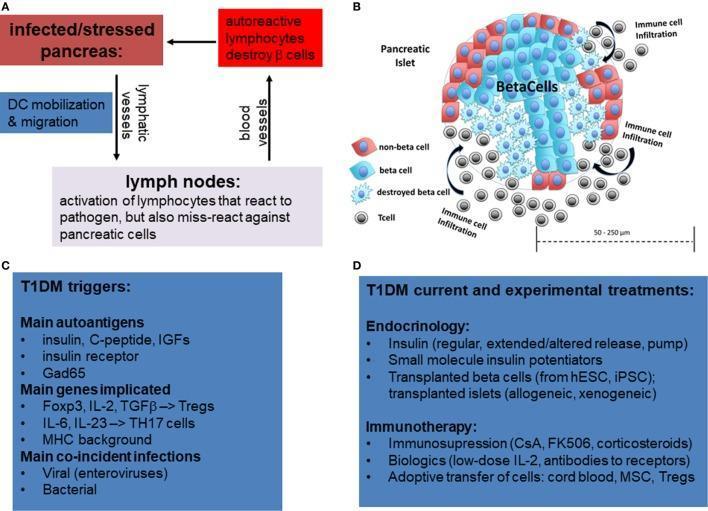
A multi-panel educational graphic illustrating the pathophysiology, triggers, and treatments for Type 1 Diabetes Mellitus (T1DM). Panel A is a flowchart showing the immunological pathway from pancreatic stress to autoreactive lymphocyte-mediated beta cell destruction via dendritic cell (DC) migration to lymph nodes. Panel B provides a pathophysiology diagram of a pancreatic islet (50-250 µm). It depicts immune cell infiltration (insulitis) by T cells (gray), leading to the destruction of central beta cells (blue) while non-beta cells (red) remain at the periphery. Panel C summarizes T1DM triggers, including autoantigens (insulin, GAD65), genetic factors (Foxp3, MHC background), and co-incident infections (enteroviruses). Panel D lists current and experimental treatments, categorizing endocrinology approaches (insulin pumps, islet transplantation from hESCs/iPSCs) and immunotherapy strategies (corticosteroids, biologics like IL-2, and adoptive cell transfers including Tregs and MSCs). The graphic serves as a comprehensive overview of T1DM etiology and clinical management.
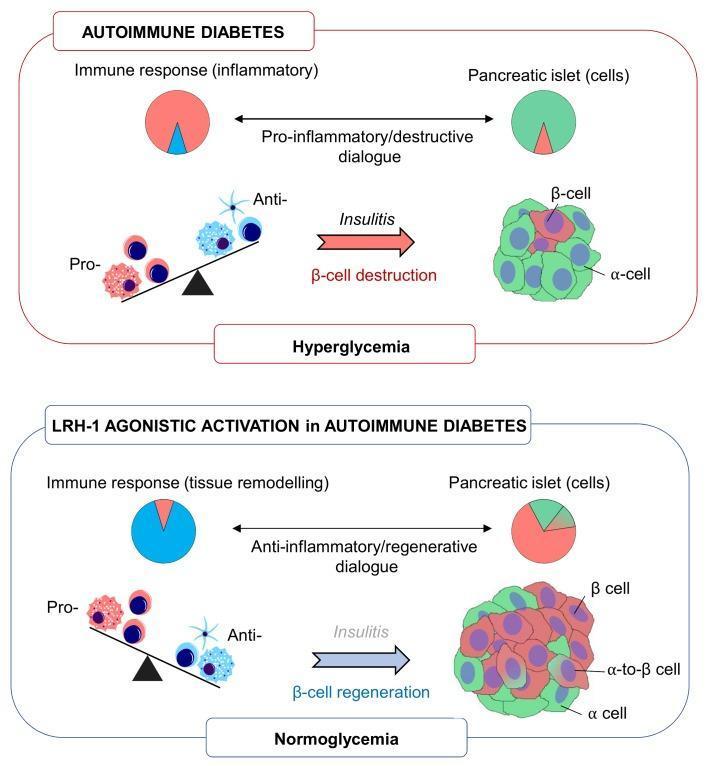
This pathophysiology diagram compares the disease state of autoimmune diabetes against the therapeutic intervention of LRH-1 agonistic activation. The top panel depicts autoimmune diabetes characterized by a pro-inflammatory immune response (red-dominant pie chart) interacting via a destructive dialogue with pancreatic islets. This results in a shift toward pro-inflammatory factors on a cellular balance scale, leading to insulitis, severe beta-cell destruction, reduced beta-cell mass, and clinical hyperglycemia. The bottom panel illustrates the effects of LRH-1 agonistic activation, which promotes tissue remodeling and an anti-inflammatory/regenerative immune response (blue-dominant pie chart). This intervention shifts the cellular balance toward anti-inflammatory factors, mitigating insulitis and stimulating beta-cell regeneration, specifically via alpha-to-beta cell transdifferentiation. The resulting pancreatic islet shows restored beta-cell mass, leading to a state of normoglycemia. Key educational concepts include the modulation of immune-islet crosstalk and the potential for regenerative medicine in type 1 diabetes mellitus through nuclear receptor signaling.
Type 1 Diabetes Mellitus (T1DM) - Overview
Definition
- Textbook of Family Medicine 9e, p. 985
Pathophysiology
| Autoantibody | Target |
|---|---|
| ICA | Islet cell antigen |
| IAA | Insulin |
| GAD65 | Glutamic acid decarboxylase |
| ICA512 / IA-2 & IA-2β | Insulinoma-associated antigen / Tyrosine phosphatases |
- Textbook of Family Medicine 9e, p. 985
Rate of β-Cell Destruction
- Infants and children: Rapid β-cell death - may present acutely with DKA as the first manifestation
- Adults: Slow, protracted course - residual β-cell function preserved for years - this is called Latent Autoimmune Diabetes of Adulthood (LADA)
- Residual β-cell function (C-peptide positive) is associated with lower hypoglycemia risk, reduced insulin requirement, and better glycemic control
Key Subtypes
| Subtype | Features |
|---|---|
| T1A (Immune-mediated) | Autoantibody positive; most common |
| T1B (Idiopathic) | Antibody negative; more common in African or Asian ancestry |
| LADA | Adult-onset, slow progression, often initially misdiagnosed as T2DM |
Clinical Presentation
- Polyuria - osmotic diuresis from glucosuria
- Polydipsia - compensatory thirst
- Polyphagia - cellular starvation despite high blood glucose
- Unintentional weight loss - catabolism of fat and muscle
- Fatigue
- Diabetic Ketoacidosis (DKA) in severe or acute presentations (especially children)
Associated Autoimmune Conditions
| Condition | Prevalence in T1DM |
|---|---|
| Autoimmune thyroid disease (Hashimoto's / Graves') | 15-30% |
| Celiac disease | 4-9% |
| Addison's disease | ~0.5% |
- Textbook of Family Medicine 9e, p. 985-986
Diagnosis
- Fasting plasma glucose ≥ 126 mg/dL (7.0 mmol/L)
- 2-hour plasma glucose ≥ 200 mg/dL on OGTT
- HbA1c ≥ 6.5%
- Random glucose ≥ 200 mg/dL with classic symptoms
Management (Overview)
| Preparation | Onset | Peak | Duration |
|---|---|---|---|
| Rapid-acting (Aspart, Lispro, Glulisine) | <15 min | 0.5-1.5 h | 3-5 h |
| Short-acting (Regular) | 0.5-1 h | 2-3 h | 4-8 h |
| Inhaled insulin | <15 min | 1-2 h | 3 h |
| Intermediate (NPH) | 2-4 h | 4-10 h | 10-16 h |
| Long-acting (Degludec, Glargine) | 1-9 h | Peakless | 24+ h |
-
Multiple Daily Injections (MDI)
-
Continuous Subcutaneous Insulin Infusion (CSII / insulin pump)
-
Sensor-Augmented Pump (SAP) - pump + CGM
-
Automated Insulin Delivery (AID) / "closed-loop" or "artificial pancreas" systems
-
Harrison's Principles of Internal Medicine 22E, 2025
Stages of T1DM
| Stage | Features |
|---|---|
| Stage 1 | Multiple autoantibodies present; normoglycemia; no symptoms |
| Stage 2 | Autoantibodies + dysglycemia; no symptoms |
| Stage 3 | Clinical diabetes with hyperglycemia and symptoms |
Key Points Summary
- T1DM = autoimmune β-cell destruction → absolute insulin deficiency
- Autoantibodies (GAD65, IAA, ICA512) are diagnostic markers
- Rate of progression varies: rapid in children, slow (LADA) in adults
- Associated with other autoimmune conditions - screen at diagnosis
- Treatment requires lifelong insulin; modern AID systems significantly improve glycemic control
- HbA1c target: typically <7% for most adults; individualized in children/elderly
How does Type 1 differ from Type 2 diabetes mechanistically?
type 1 vs type 2 diabetes comparison mechanism insulin resistance beta cell
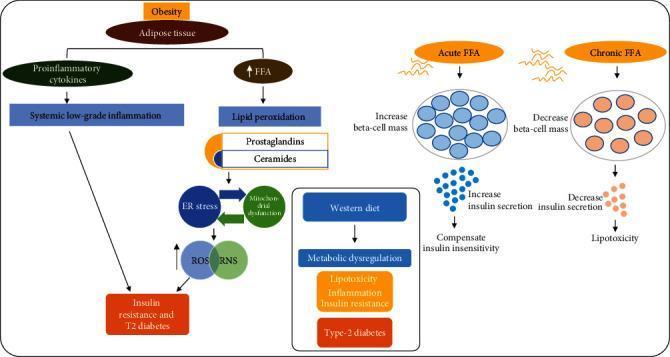
This pathophysiology diagram illustrates the metabolic pathways linking obesity, adipose tissue, and free fatty acids (FFAs) to insulin resistance and Type 2 diabetes (T2D). The flow is divided into several interconnected mechanisms. On the left, obesity-driven adipose tissue expansion releases proinflammatory cytokines leading to systemic low-grade inflammation, while elevated FFAs induce lipid peroxidation and the accumulation of prostaglandins and ceramides. These metabolites trigger a cycle of endoplasmic reticulum (ER) stress and mitochondrial dysfunction, resulting in elevated reactive oxygen species (ROS) and reactive nitrosative stress (RNS). Together, inflammation and oxidative stress culminate in insulin resistance and T2D. On the right, a comparison chart shows the differential effects of FFA exposure on pancreatic beta-cells: acute FFA exposure increases beta-cell mass and insulin secretion to compensate for insulin insensitivity, whereas chronic FFA exposure decreases beta-cell mass and insulin secretion, leading to lipotoxicity. A central inset further links a Western diet to metabolic dysregulation, encompassing lipotoxicity, inflammation, and insulin resistance as drivers of Type 2 diabetes.
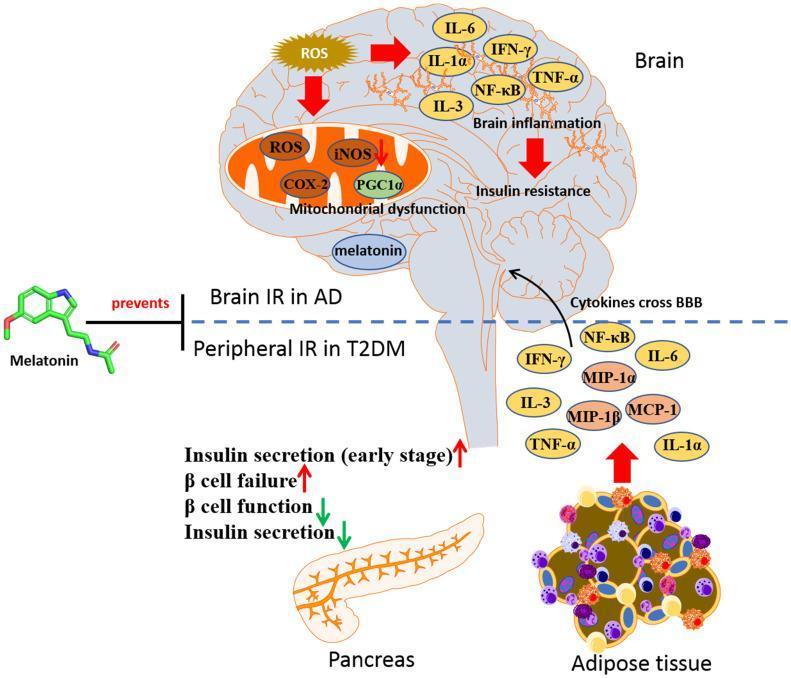
A medical pathophysiology diagram illustrating the link between peripheral insulin resistance (IR) in Type 2 Diabetes Mellitus (T2DM) and brain insulin resistance in Alzheimer's Disease (AD), highlighting the protective role of melatonin. The diagram is split into two sections by a dotted line representing the blood-brain barrier (BBB). The lower section depicts peripheral mechanisms including adipose tissue releasing pro-inflammatory cytokines (IL-1α, TNF-α, IL-3, IFN-γ, MCP-1, MIP-1α, MIP-1β, and NF-κB) and pancreatic alterations (early stage hyperinsulinemia followed by beta-cell failure and decreased insulin secretion). These peripheral cytokines are shown crossing the BBB into the brain. The upper section illustrates central effects: neuroinflammation characterized by IL-6 and TNF-α, mitochondrial dysfunction involving ROS, iNOS, COX-2, and PGC1α, and subsequent brain IR. A molecular structure of melatonin is shown on the left, indicated as an agent that 'prevents' the progression from peripheral IR to central neurodegeneration by targeting insulin signaling pathways.
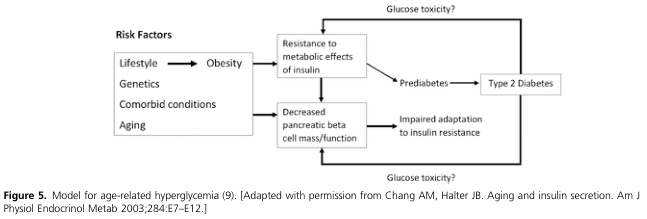
Summary : This flowchart presents a model for age-related hyperglycemia, illustrating how various risk factors contribute to insulin resistance, decreased pancreatic beta cell function, and ultimately the development of prediabetes and type 2 diabetes. flowchart: # Risk Factors : • Lifestyle • Genetics • Comorbid conditions • Aging • Obesity (resulting from lifestyle) # Nodes : • Resistance to metabolic effects of insulin (rectangle) • Decreased pancreatic beta cell mass/function (rectangle) • Prediabetes (rectangle) • Impaired adaptation to insulin resistance (rectangle) • Type 2 Diabetes (rectangle) # Connectors : • Risk factors (lifestyle, genetics, comorbid conditions, aging) point to both "Resistance to metabolic effects of insulin" and "Decreased pancreatic beta cell mass/function". • "Obesity" (from lifestyle) also points to "Resistance to metabolic effects of insulin". • "Resistance to metabolic effects of insulin" leads to "Prediabetes". • "Decreased pancreatic beta cell mass/function" leads to "Impaired adaptation to insulin resistance". • "Impaired adaptation to insulin resistance" leads to "Prediabetes". • "Prediabetes" leads to "Type 2 Diabetes". • "Type 2 Diabetes" has arrows looping back to both "Resistance to metabolic effects of insulin" and "Decreased pancreatic beta cell mass/function", labeled "Glucose toxicity?". # Layout : • Left column: Risk factors listed in a box. • Middle column: Two parallel nodes ("Resistance to metabolic effects of insulin" and "Decreased pancreatic beta cell mass/function"). • Right column: "Prediabetes" leading to "Type 2 Diabetes". • Lower middle: "Impaired adaptation to insulin resistance" connects "Decreased pancreatic beta cell mass/function" to "Prediabetes". • Feedback loops from "Type 2 Diabetes" to both upstream nodes. # Analysis : • The diagram shows a cyclical and progressive pathway: risk factors increase insulin resistance and decrease beta cell function, leading to prediabetes and type 2 diabetes. • Feedback loops suggest that glucose toxicity from diabetes can further worsen insulin resistance and beta cell dysfunction, creating a vicious cycle. • The model highlights the multifactorial nature of age-related hyperglycemia, with both genetic and lifestyle components, and the central role of impaired insulin adaptation.
Type 1 vs Type 2 Diabetes - Mechanistic Differences
The Core Distinction at a Glance
| Feature | Type 1 DM | Type 2 DM |
|---|---|---|
| Primary defect | Autoimmune β-cell destruction | Insulin resistance + β-cell dysfunction |
| Insulin level | Absolute deficiency (near-zero) | Initially high (compensatory), then relative deficiency |
| Immune involvement | Yes - T-cell mediated | No direct autoimmunity (but systemic inflammation present) |
| Body habitus | Typically lean | >80% obese / overweight |
| Onset | Typically acute (weeks) | Insidious over years-decades |
| DKA risk | High | Low (except specific populations) |
| C-peptide | Absent / very low | Normal or elevated early; reduced late |
Type 1 DM - The Autoimmune Mechanism
- Genetic trigger: HLA-DR3 and HLA-DR4 haplotypes confer susceptibility; HLA-DR2 is protective
- Environmental trigger: Viruses (coxsackievirus, enterovirus, rubella), bovine milk proteins, vitamin D deficiency, gut microbiome changes initiate the process
- Immune activation: Autoreactive CD4+ and CD8+ T-cells attack β-cells (insulitis); autoantibodies (GAD65, IAA, ICA512, IA-2) appear in the blood
- Progressive β-cell loss: Over months to years, β-cell mass falls; once ~80-90% is destroyed, clinical hyperglycemia appears
- End result: Absolute insulin deficiency - basal and prandial insulin both absent
- No insulin = unchecked glucagon activity, lipolysis, ketogenesis → risk of DKA
- Harrison's Principles of Internal Medicine 22E, p. 3243-3244
Type 2 DM - The Resistance + Exhaustion Mechanism
Defect 1 - Insulin Resistance
- Definition: A decreased biological response to normal concentrations of circulating insulin
- Sites: Skeletal muscle (primary site - reduced glucose uptake), liver (excess glucose output), and adipose tissue
- Mechanisms:
- Obesity (especially visceral/central fat) releases pro-inflammatory cytokines (TNF-α, IL-6), which impair insulin signaling via IRS-1 phosphorylation
- Free fatty acids (FFAs) from adipose tissue cause lipotoxicity and impair GLUT4 translocation in muscle
- ER stress and mitochondrial dysfunction from excess lipid accumulation amplify resistance
- Hepatic effect: Increased hepatic glucose output (gluconeogenesis + glycogenolysis) raises fasting plasma glucose
- Peripheral effect: Decreased skeletal muscle glucose uptake raises postprandial glucose
Defect 2 - β-Cell Dysfunction (Progressive)
- Initially, the pancreas compensates for insulin resistance by secreting more insulin (hyperinsulinemia) - glucose tolerance stays normal
- Over time, glucotoxicity (chronic hyperglycemia renders β-cells unresponsive) and lipotoxicity (FFAs) damage β-cells
- The normal pulsatile pattern of insulin secretion is disrupted
- The proinsulin:insulin ratio increases (marker of β-cell stress)
- β-cell mass is reduced in T2DM (apoptosis > regeneration)
- Eventually: relative, then absolute, insulin deficiency (late T2DM)
"A relative deficiency of insulin occurs early in the disease and absolute insulin deficiency late in the disease." - Tietz Textbook of Laboratory Medicine, 7th Ed.
The Progression Contrast - Visualized
Genetic susceptibility + Environmental trigger
        ↓
Autoimmune activation (T-cells, autoantibodies)
        ↓
Progressive β-cell destruction (months to years)
        ↓
>80% β-cell loss → clinical hyperglycemia
        ↓
Absolute insulin deficiency → DKA risk
Obesity + Genetics + Lifestyle
        ↓
Insulin resistance (precedes diagnosis by ~20 years)
        ↓
Compensatory hyperinsulinemia (glucose normal)
        ↓
Glucotoxicity + Lipotoxicity → β-cell exhaustion
        ↓
Relative insulin deficiency → hyperglycemia
        ↓
Progressive β-cell loss → late absolute deficiency
- Harrison's Principles of Internal Medicine 22E, p. 3244-3246
Why T1 Gets DKA but T2 Usually Doesn't
- Glucagon is completely unopposed
- Unrestrained lipolysis → free fatty acids flood the liver
- Hepatic ketogenesis is maximal → DKA
Genetics - Different Architectures
| T1DM | T2DM | |
|---|---|---|
| Concordance in identical twins | 50% | 70-90% |
| Key genes | HLA-DR3, HLA-DR4 (MHC class II) | >600 loci (TCF7L2 most prominent) |
| Mechanism | Immune gene variants affecting T-cell tolerance | Non-coding loci altering islet function/insulin secretion |
| Heritability | Moderate | High |
- Harrison's Principles of Internal Medicine 22E, p. 3244-3245
Summary: The One-Line Mechanistic Difference
Medicine with doses in both type
Medications & Doses - Type 1 and Type 2 Diabetes
TYPE 1 DIABETES - Treatment
Total Daily Dose (TDD) of Insulin
| Patient | TDD |
|---|---|
| Newly diagnosed / initial | 0.4 units/kg/day (conservative start) |
| Average non-obese adult | 0.5-0.8 units/kg/day |
| Early T1DM (honeymoon phase) | 0.3-0.4 units/kg/day |
| Obese, insulin-resistant, adolescent, late pregnancy | Higher (>1 unit/kg/day) |
- Washington Manual of Medical Therapeutics
Basal-Bolus Breakdown
- Basal insulin = 40-50% of TDD (keeps glucose stable overnight and between meals)
- Bolus (prandial) insulin = remaining 50-60%, split across 3 meals
- Correction doses added on top if BG is above target
Insulin Preparations & Doses
Basal Insulins
| Drug | Route | Dose | Frequency |
|---|---|---|---|
| Insulin Glargine (Lantus, Basaglar) | SC | 0.2-0.4 units/kg | Once (or twice) daily |
| Insulin Degludec (Tresiba) | SC | 0.2-0.4 units/kg | Once daily |
| Insulin Detemir (Levemir) | SC | 0.2-0.4 units/kg | Once or twice daily |
| NPH (Humulin N) | SC | 0.2-0.3 units/kg | Twice daily |
Rapid-Acting (Prandial) Insulins - Given 0-15 min before meals
| Drug | Onset | Peak | Duration |
|---|---|---|---|
| Insulin Aspart (NovoLog) | <15 min | 0.5-1.5 h | 3-5 h |
| Insulin Lispro (Humalog) | <15 min | 0.5-1.5 h | 3-5 h |
| Insulin Glulisine (Apidra) | <15 min | 0.5-1.5 h | 3-5 h |
| Inhaled Insulin (Afrezza) | <15 min | 1-2 h | 3 h |
Short-Acting
| Drug | Onset | Peak | Duration |
|---|---|---|---|
| Regular Insulin (Humulin R) | 0.5-1 h | 2-3 h | 4-8 h |
- Harrison's Principles of Internal Medicine 22E, 2025; Washington Manual of Medical Therapeutics
Adjuncts in T1DM (add-on to insulin)
- Pramlintide (amylin analogue): given before meals; reduces postprandial glucose, weight, and insulin needs
- SGLT2 inhibitors (off-label/investigational in T1DM): may reduce insulin dose and improve time-in-range
TYPE 2 DIABETES - Treatment (Step-Up Approach)
Step 1 - Lifestyle (all patients)
- Diet modification + ≥150 min/week moderate exercise
- Target 5-10% weight loss
Step 2 - First-Line Drug: Metformin
| Parameter | Details |
|---|---|
| Mechanism | Inhibits hepatic gluconeogenesis; improves peripheral insulin sensitivity |
| Starting dose | 500 mg twice daily (with meals) |
| Target dose | 1000-2000 mg/day (in divided doses) |
| Maximum dose | 2550 mg/day (therapeutic benefit plateaus at 2000 mg) |
| Extended-release | 500 mg once daily, titrate to 2000 mg/day |
| Renal dose reduction | Reduce to 500 mg twice daily if eGFR 30-45 mL/min |
| Contraindicated | eGFR <30 mL/min; cardiogenic shock; severe hepatic disease |
| Key side effects | GI (nausea, diarrhea) in 20-30%; B12 deficiency; rarely lactic acidosis |
- Goodman & Gilman's Pharmacological Basis of Therapeutics
Step 3 - Add-On Agents for T2DM
SGLT2 Inhibitors (preferred if cardiovascular or renal disease present)
| Drug | Starting Dose | Max Dose | Notes |
|---|---|---|---|
| Canagliflozin (Invokana) | 100 mg once daily | 300 mg once daily | Avoid if eGFR <30 |
| Dapagliflozin (Farxiga) | 5 mg once daily | 10 mg once daily | Heart failure + T2DM benefit |
| Empagliflozin (Jardiance) | 10 mg once daily | 25 mg once daily | Best CV mortality data |
| Ertugliflozin (Steglatro) | 5 mg once daily | 15 mg once daily | - |
GLP-1 Receptor Agonists (preferred if obesity or cardiovascular disease)
| Drug | Dose | Frequency |
|---|---|---|
| Exenatide (Byetta) | Start 5 mcg; increase to 10 mcg | Twice daily SC (before meals) |
| Exenatide XR (Bydureon) | 2 mg | Once weekly SC |
| Liraglutide (Victoza) | Start 0.6 mg → 1.2 mg → 1.8 mg | Once daily SC |
| Semaglutide SC (Ozempic) | Start 0.25 mg/week → up to 2 mg/week | Once weekly SC |
| Semaglutide oral (Rybelsus) | 3 mg → 7 mg → 14 mg | Once daily oral |
| Dulaglutide (Trulicity) | 0.75-1.5 mg | Once weekly SC |
- Goodman & Gilman's Pharmacological Basis of Therapeutics
DPP-4 Inhibitors ("Gliptins") - weight neutral
| Drug | Dose |
|---|---|
| Sitagliptin (Januvia) | 100 mg once daily (50 mg if eGFR 30-50; 25 mg if <30) |
| Saxagliptin (Onglyza) | 2.5-5 mg once daily |
| Linagliptin (Tradjenta) | 5 mg once daily (no renal adjustment needed) |
| Alogliptin (Nesina) | 25 mg once daily |
Sulfonylureas (cheap, effective; risk of hypoglycemia + weight gain)
| Drug | Starting Dose | Max Dose |
|---|---|---|
| Glipizide | 5 mg once daily | 20-40 mg/day |
| Glyburide | 2.5-5 mg once daily | 20 mg/day |
| Glimepiride | 1-2 mg once daily | 8 mg/day |
Thiazolidinediones (TZDs) - insulin sensitizers
| Drug | Starting Dose | Max Dose |
|---|---|---|
| Pioglitazone (Actos) | 15-30 mg once daily | 45 mg once daily |
Step 4 - Insulin in T2DM
-
Starting basal insulin: 10 units/day OR 0.1-0.2 units/kg/day SC at bedtime
-
Adjust by 5-10% every few days targeting fasting glucose <130 mg/dL
-
May add prandial insulin using same rapid-acting agents as T1DM once basal is optimized
-
Current Surgical Therapy 14e; Washington Manual of Medical Therapeutics
Quick Reference Summary
| T1DM | T2DM | |
|---|---|---|
| 1st line | Insulin (basal + bolus) | Metformin 500 mg BD → up to 2000 mg/day |
| Total insulin need | 0.5-0.8 units/kg/day | 0.1-0.2 units/kg/day (if needed) |
| Adjuncts | Pramlintide, SGLT2i (off-label) | SGLT2i, GLP-1 RA, DPP4i, sulfonylurea, TZD, insulin |
| Hypoglycemia risk | High (strict insulin titration required) | Low (except sulfonylureas + insulin) |
| Weight effect | Insulin causes weight gain | GLP-1 RA and SGLT2i cause weight loss |
Note: All doses shown are standard adult doses. Always individualize based on renal function (eGFR), hepatic function, age, body weight, and comorbidities. Doses in elderly patients and those with renal impairment are typically lower.