
Why is calcium gluconate given for hyperkalemia
Why Calcium Gluconate is Given in Hyperkalemia
The Core Problem: What High K+ Does to the Heart
How Calcium Fixes It: Membrane Stabilization
"Calcium raises the action potential threshold to a less negative value, without changing the resting membrane potential; by restoring the usual 15-mV difference between resting and threshold potentials, myocyte excitability is reduced."
- Calcium raises the threshold for firing (makes it harder to trigger an action potential)
- This restores the normal 15 mV gap between RMP and threshold
- The net effect: the cardiac membrane is stabilized - cells stop being dangerously hyperexcitable
Key Points to Remember
| Feature | Detail |
|---|---|
| Mechanism | Raises action potential threshold - "membrane stabilization" |
| Effect on K+ levels | None - does NOT lower serum potassium |
| Onset | 1-3 minutes |
| Duration | 30-60 minutes |
| Dose | 10 mL of 10% calcium gluconate IV over 2-3 min |
| When to give | ECG changes present, or K+ ≥6.5 mEq/L |
Why Calcium Gluconate Specifically?
- Calcium chloride contains ~3x more elemental calcium per mL (0.68 mmol/mL vs 0.22 mmol/mL)
- Calcium gluconate is preferred peripherally because it is less irritating to veins and does NOT cause tissue necrosis if it extravasates
- Calcium chloride requires a central line due to its caustic nature
- Efficacy and onset are equivalent when appropriate volumes are used
Critical Caution: Digoxin Toxicity
The Three-Step Treatment Framework
- Calcium gluconate - membrane stabilization (immediate, minutes)
- Insulin + dextrose, albuterol, sodium bicarbonate - shift K+ into cells (minutes to hours)
- Kayexalate, furosemide, dialysis - remove K+ from the body (hours)
Ecg changes on hyperkalemia
ECG changes hyperkalemia peaked T waves widened QRS sine wave
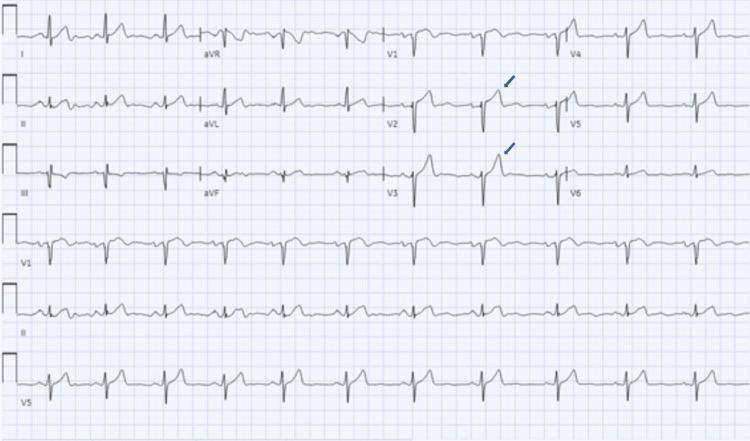
A 12-lead electrocardiogram (ECG) demonstrating a normal sinus rhythm with significant morphologic changes secondary to hyperkalemia (serum potassium 7.3 mmol/L). The tracing shows visible P waves and a consistent PR interval with narrow QRS complexes. The most prominent finding is the presence of tall, 'tented' or peaked T waves, most notably in the precordial leads V2 and V3 (indicated by blue arrows) and V4. These T waves exhibit a high amplitude and narrow base, which is a classic early electrocardiographic manifestation of elevated serum potassium. No ST-segment depression, P-wave flattening, or widened QRS (sine wave pattern) is currently visible, indicating an intermediate stage of hyperkalemic cardiotoxicity. This diagnostic image is an essential educational tool for identifying electrolyte imbalances and their impact on cardiac electrical activity, specifically for medical students and clinicians monitoring patients with acute kidney injury or metabolic disturbances.
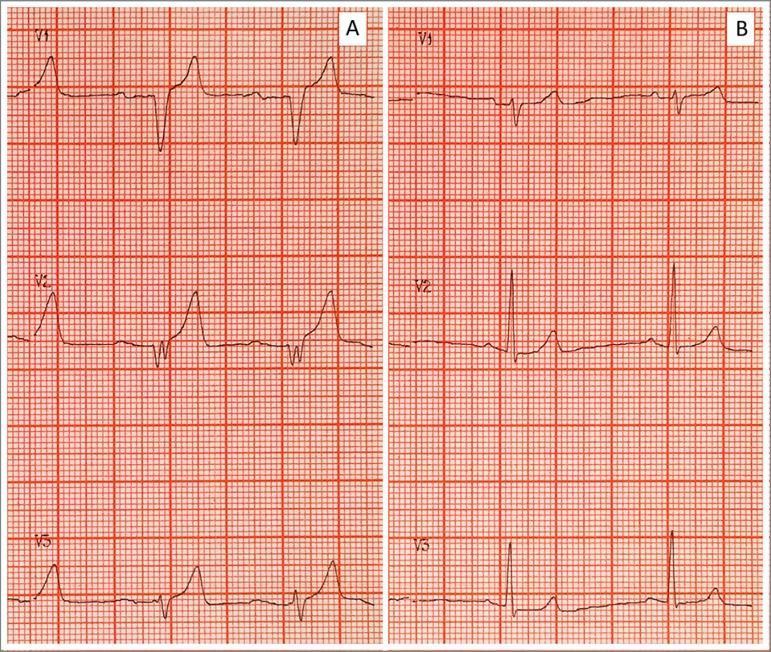
Side-by-side comparison of two electrocardiogram (ECG) tracings (A and B) demonstrating the classic cardiotoxic evolution and subsequent resolution of severe hyperkalemia. Panel A (Pretreatment) displays several pathognomonic findings including prominent, tall, tented, or 'peaked' T-waves; significant flattening and widening of the P-waves; a prolonged PR interval; and a widened QRS complex with a 'sine-wave' appearance in certain leads. These features reflect impaired atrial and ventricular conduction and delayed repolarization associated with elevated serum potassium (e.g., 9.25 mEq/L). Panel B (Post-treatment) shows the results of medical intervention (such as calcium gluconate, insulin/glucose, and bicarbonate), characterized by the normalization of the ECG morphology. Key changes in Panel B include the return of distinct P-waves, narrowing of the QRS complex to normal duration, and a reduction in T-wave amplitude to a typical physiological morphology. The images are shown on standard ECG grid paper, facilitating the assessment of interval and complex durations.
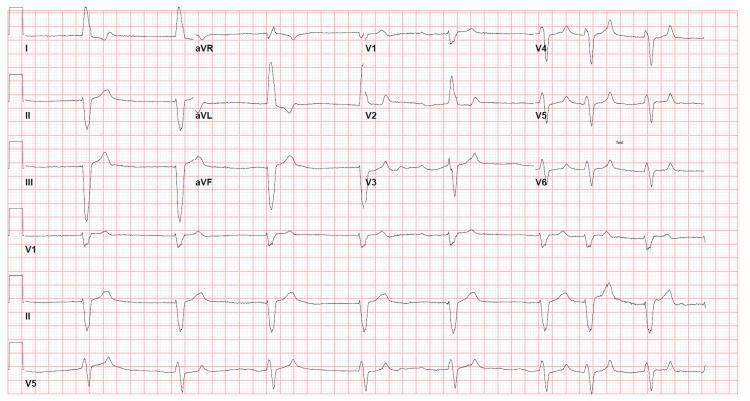
This diagnostic image is a 12-lead electrocardiogram (ECG) printed on standard grid paper, demonstrating key findings associated with severe hyperkalemia in a clinical setting. The rhythm is irregularly irregular with a notable absence of discrete P waves, replaced by fibrillatory activity, characteristic of atrial fibrillation. There is a slow ventricular response (bradycardia). The QRS complexes are significantly widened (exceeding 120 ms), showing a diffuse intraventricular conduction delay. In the limb leads, a left axis deviation is present. Notably, the T waves in multiple leads, particularly the precordial leads V2-V6, appear peaked or 'tented,' which is a classic electrophysiological sign of electrolyte imbalance, specifically hyperkalemia. The combination of bradyarrhythmia, widened QRS, and peaked T waves suggests a high risk for progression to sine wave pattern or ventricular asystole. This ECG serves as a critical educational example of the metabolic effects on cardiac conduction and is relevant for emergency medicine, nephrology, and cardiology specialties.
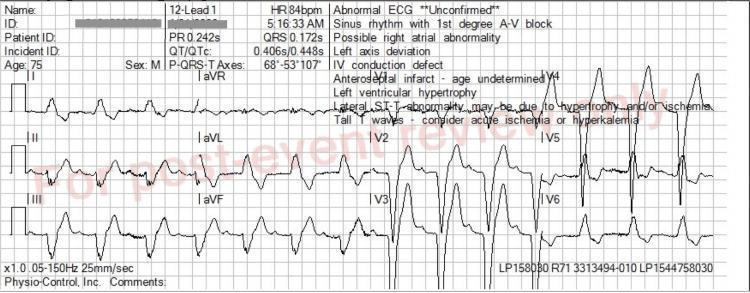
This diagnostic image is a 12-lead electrocardiogram (ECG) demonstrating multiple conduction and metabolic abnormalities. The tracing shows a sinus rhythm with a prolonged PR interval (0.242s), indicating first-degree atrioventricular (AV) block. The QRS complex is significantly widened (0.172s) with a morphology consistent with a left bundle branch block (LBBB) pattern, characterized by deep S waves in V1-V3 and broad, notched R waves in lateral leads such as V6 and aVL. Notably, the T waves are disproportionately tall, peaked, and 'tented,' particularly visible in the precordial leads V2-V5. These peaked T waves, when combined with QRS widening, are classic electrocardiographic manifestations of hyperkalemia. The image also displays left axis deviation and secondary ST-T wave discordance typical of LBBB. This ECG serves as a critical educational example of how metabolic disturbances like hyperkalemia can overlay and exacerbate underlying conduction system disease in a clinical emergency setting.
ECG Changes in Hyperkalemia
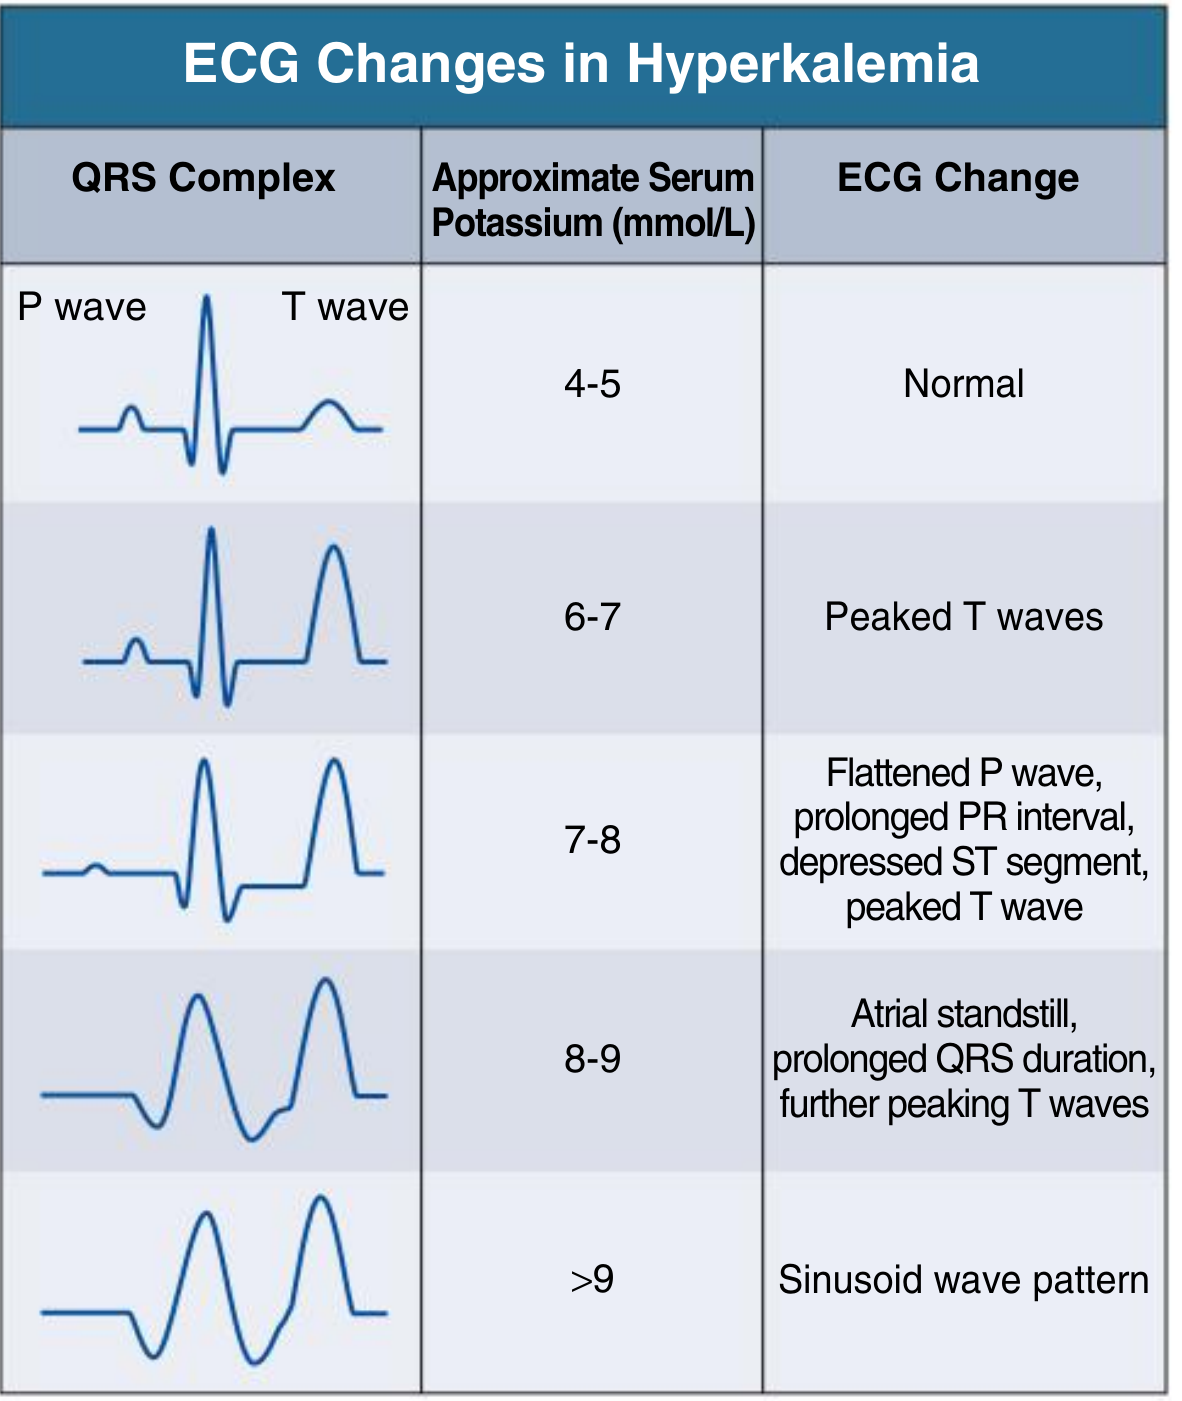
Stage-by-Stage Progression
| Serum K+ (mEq/L) | ECG Change | Mechanism |
|---|---|---|
| 4-5 | Normal | Normal range |
| 5.5-6.5 | Peaked (tented) T waves | Accelerated repolarization |
| 6.5-7.5 | Flattened P waves, prolonged PR interval, ST depression | Slowed atrial conduction |
| 7-8 | Widened QRS complex | Slowed ventricular conduction |
| 8-9 | Atrial standstill (P waves disappear), further QRS widening | Atria cease to conduct |
| >9 | Sine wave pattern | QRS merges with T wave |
| Critical | Ventricular fibrillation / asystole | Complete conduction failure |
Each Change Explained
- Tall, narrow, symmetric, with a narrow base - classically described as "tent-shaped"
- Most prominent in precordial leads (V2-V5)
- Due to accelerated ventricular repolarization - the high extracellular K+ speeds up phase 3 of the action potential
- As K+ rises, atrial muscle becomes progressively depolarized and less able to generate a normal action potential
- P waves become low-amplitude, then flat, then disappear entirely
- "Atrial standstill" occurs when the atria stop conducting altogether
- Reflects slowed AV nodal conduction
- Occurs alongside P wave flattening as conduction through the AV node slows
- The hallmark of dangerous hyperkalemia
- Reflects generalized slowing of ventricular conduction (intraventricular conduction delay)
- QRS may develop LBBB-like or RBBB-like morphology
- This is when calcium gluconate becomes most urgent
- Accompanies the widened QRS in moderate-severe hyperkalemia
- Part of the global conduction/repolarization disruption
- The widened QRS eventually merges with the T wave, creating a smooth undulating sine wave
- Represents pre-terminal cardiac rhythm
- At any point in this progression, ventricular fibrillation can occur without warning
Real ECG Examples
Important Clinical Caveat
"Although the ECG findings correlate generally with the degree of hyperkalemia, the rate of progression from mild to severe cardiac effects can be unpredictable and may not correlate well with changes in the serum potassium concentration."
- A patient with K+ = 6.5 mEq/L may have no ECG changes yet still be at risk
- A patient can jump from peaked T waves directly to VF
- K+ ≥6.5 mEq/L requires aggressive management even without ECG changes (Harrison's 22e)
Memory Aid
"P Waves Disappear, QRS Widens, Then Sine"
- P - Peaked T waves first
- PR - PR prolongation + P flattening
- QRS - Widening
- S - Sine wave
- VF/Asystole - Death