
Growth chart
Asking for Preferences
What kind of growth chart are you looking for?
Asking for Preferences
What would you like to know about pediatric growth charts?
I'll give you a comprehensive overview of pediatric growth charts from the medical library.
Searching sources...
Reading File
Finding Sources
Searching the Web
pediatric growth charts WHO CDC percentiles interpretation 2024
Reading File
Reading File
Finding Sources
Reading File
Finding Sources
I now have strong content from Park's Preventive Medicine plus the textbook image. Let me fetch the image and compile the full answer.
Loading Image
Here is a comprehensive guide to pediatric growth charts:
Pediatric Growth Charts
What Is a Growth Chart?
A growth chart (also called the "road-to-health" chart, first designed by David Morley and later modified by WHO) is a visible display of a child's physical growth and development. It is designed primarily for longitudinal follow-up - tracking how a child changes over time rather than providing a single snapshot.
Weight is used as the primary measure because it is the most sensitive indicator of growth. A child can lose weight but cannot lose height, making weight-for-age the earliest detector of growth faltering.
Standard Growth Chart Systems
WHO Child Growth Standards (2006) - Birth to 5 years
- Developed from the Multicentre Growth Reference Study (MGRS), conducted 1997-2003 in Brazil, Ghana, India, Norway, Oman, and the USA
- Data collected from 9,440 healthy breastfed infants from diverse ethnic backgrounds
- Mothers were non-smokers and followed recommended infant feeding practices
- Covers boys and girls aged 0-60 months
- Provides both percentile and Z-score curves for:
- Length/height-for-age
- Weight-for-age
- Weight-for-length/height
- BMI-for-age (new addition vs. old NCHS reference)
- India adopted WHO 2006 standards in February 2009 for use under the National Rural Health Mission (NRHM) and ICDS
CDC Growth Charts - Ages 2 to 20 years
- Recommended for children in the US from age 2 onward
- Based on nationally representative US population data
- For children under 2 years, the CDC recommends WHO standards
How to Read a Growth Chart
Z-Scores (Standard Deviations)
The chart below shows WHO vs. NCHS weight-for-age Z-scores for girls (0-60 months):
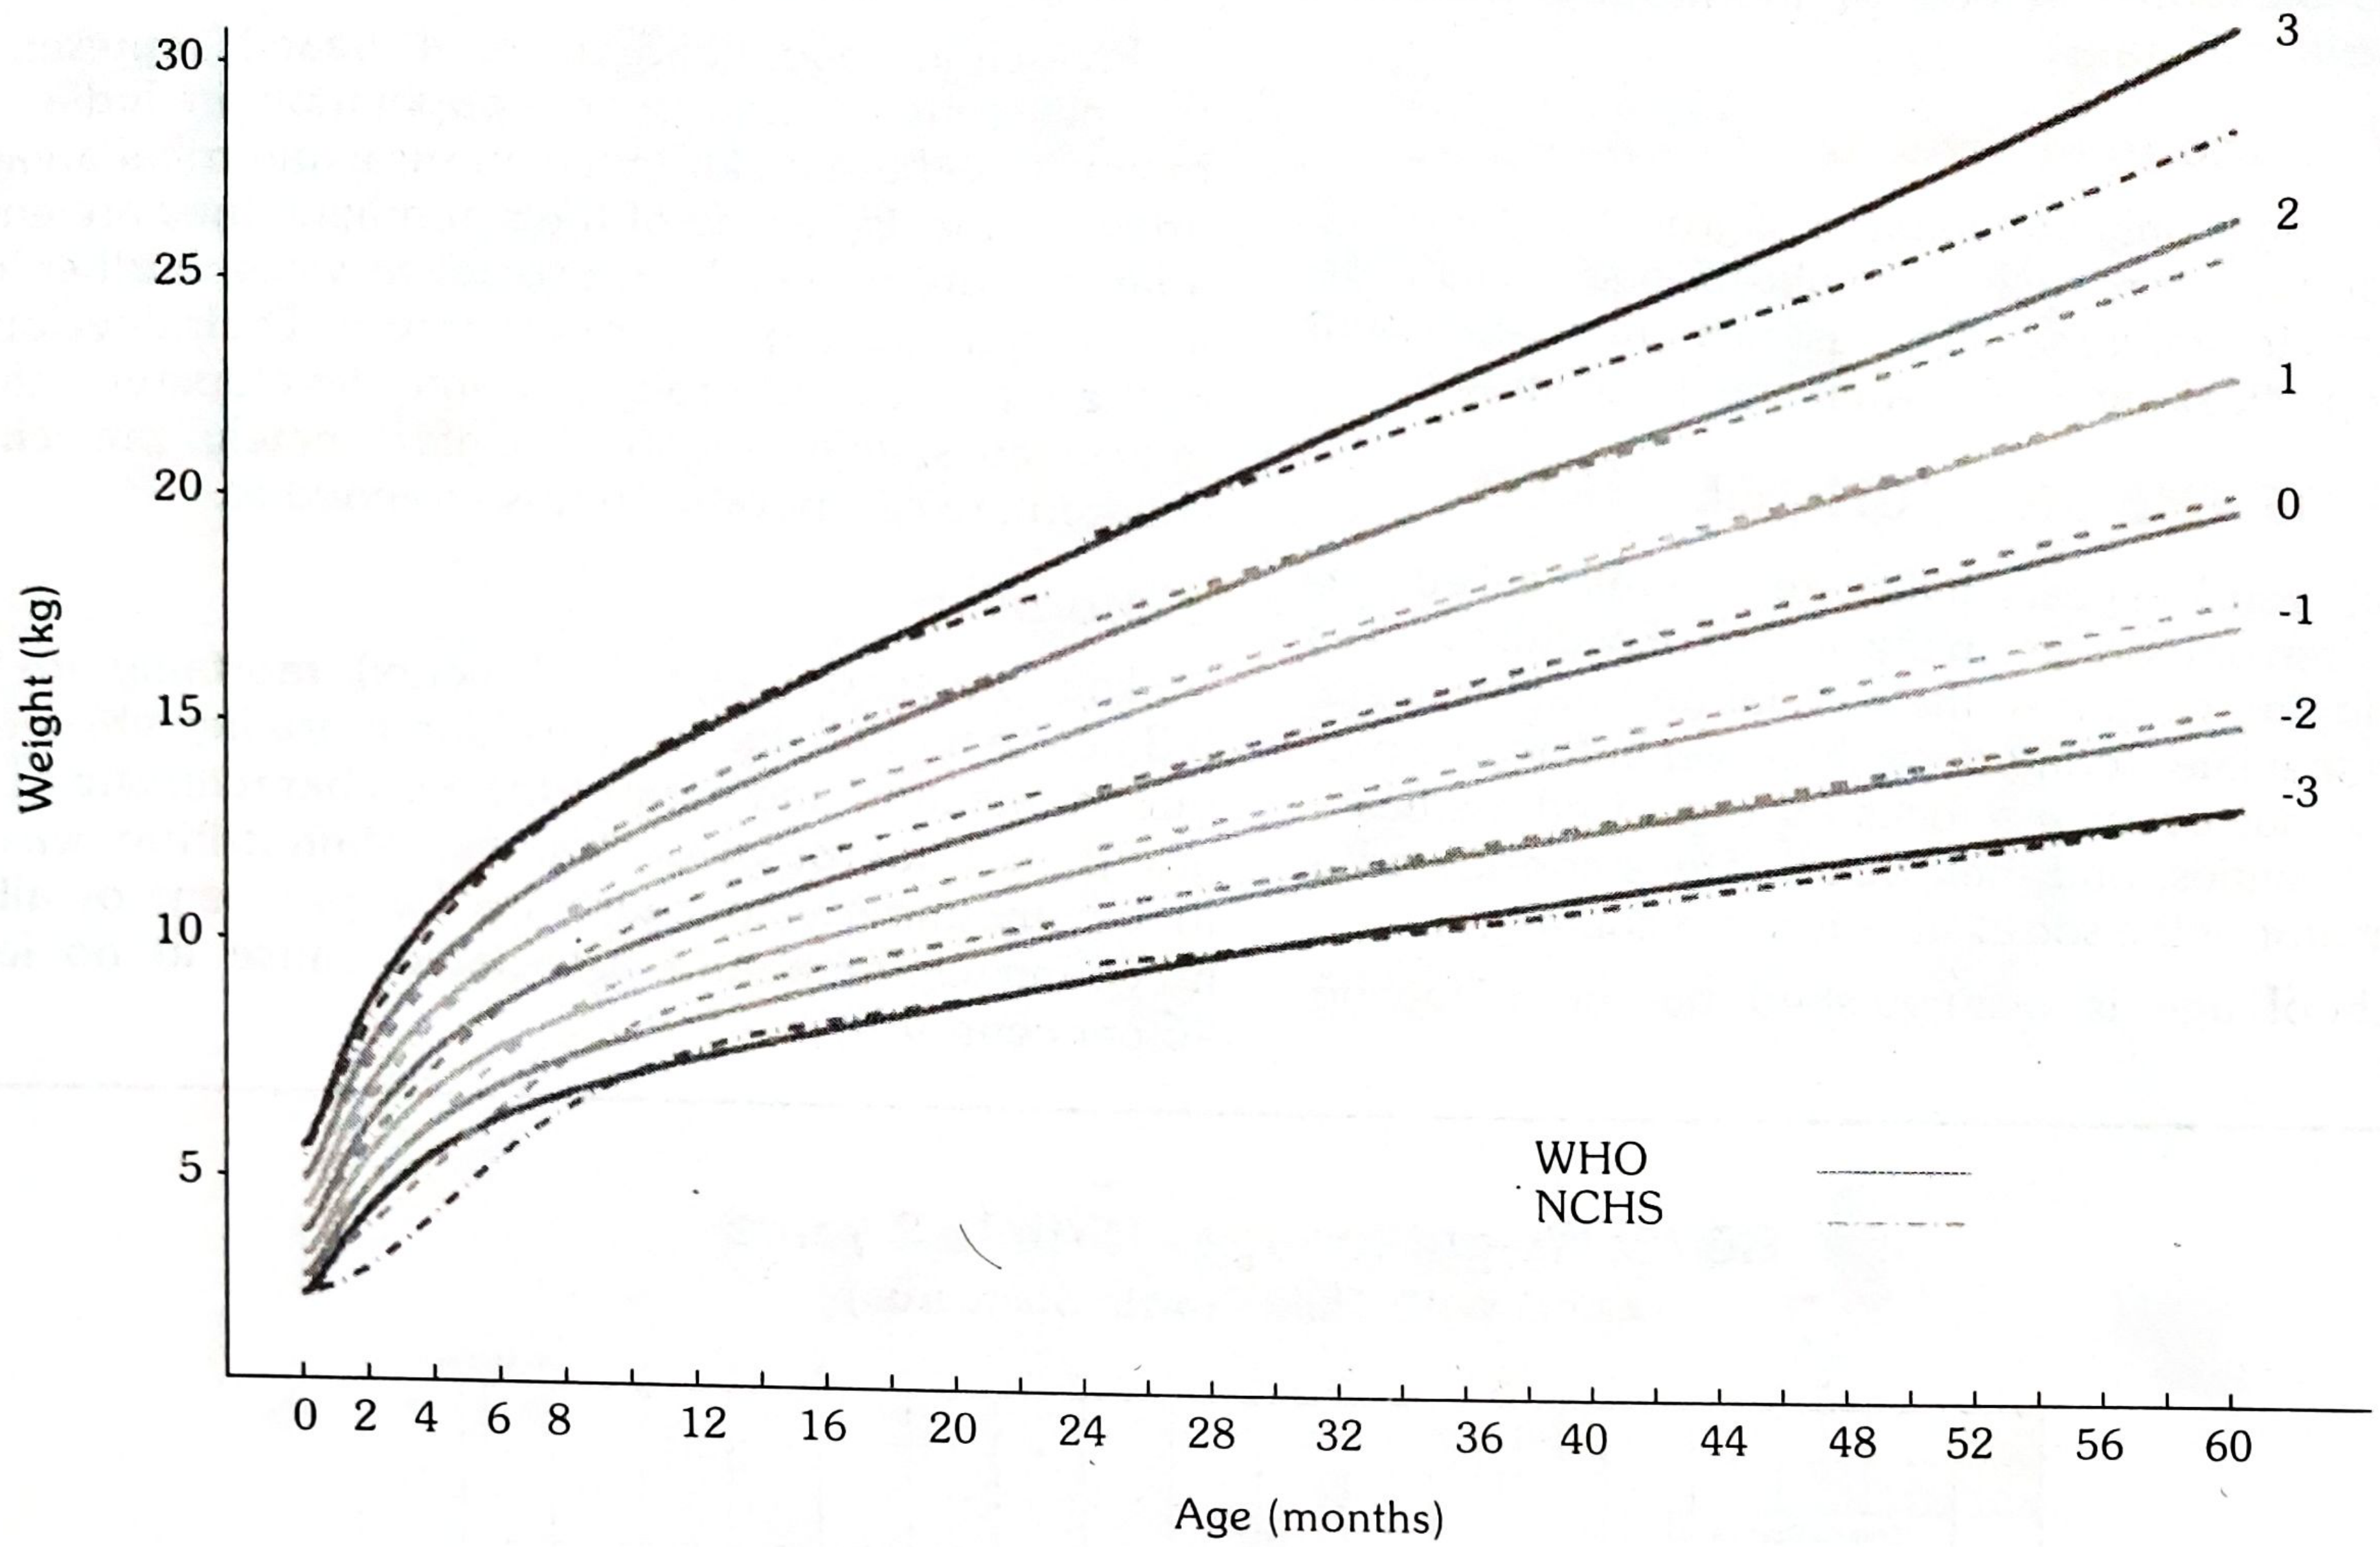
Each line represents a Z-score (standard deviation from the median):
| Z-score | Interpretation |
|---|---|
| 0 | Median (50th percentile) - average for age and sex |
| +1, +2, +3 | Above average |
| -1 | Mildly below average (not yet concerning) |
| -2 | Undernutrition threshold (below 2nd percentile) |
| -3 | Severe undernutrition (severely underweight zone) |
Percentile Lines (CDC Charts)
- 3rd to 97th percentile = normal range
- Below 3rd or above 97th warrants clinical attention
- A child crossing two major percentile lines up or down is a red flag for growth deviation (per Kaplan & Sadock's Psychiatry textbook, even medication-related growth changes follow this rule)
The Golden Rule: Direction Matters More Than Position
"It is the direction of growth that is more important than the position of dots on the line."
- Park's Textbook of Preventive and Social Medicine
- A child consistently at the 5th percentile but tracking parallel to reference lines is not concerning
- A child dropping from the 50th to the 10th percentile over several visits requires investigation
- Flattening or falling of the weight curve = growth failure = earliest sign of protein-energy malnutrition (PEM), which can precede clinical signs by weeks to months
Zones on the Growth Chart
| Zone | Meaning | Action |
|---|---|---|
| Normal zone | Weight within expected range | Continue monitoring |
| Below -2 SD | Undernutrition | Nutritional counselling, investigate cause |
| Below -3 SD | Severely underweight | Urgent intervention needed |
(Some Indian states like Maharashtra also grade undernutrition into Grades 1-4 within the chart.)
Uses of the Growth Chart
- Growth monitoring - longitudinal tracking of child health
- Diagnostic tool - identify "high-risk" children; detect malnutrition before clinical signs appear
- Planning and policy - provides objective basis for nutrition programs at local/national level
- Educational tool - the visual format helps mothers understand their child's progress and participate in care
- Tool for action - guides health workers to intervene early
- Research tool - epidemiological surveillance of child health in populations
India's Mother and Child Protection Card
India uses a joint Mother and Child Protection (MCP) Card that incorporates the growth chart alongside:
- Immunization records
- Breastfeeding milestones
- Developmental milestones
- Pregnancy and delivery records
The card is kept by the mother and brought to every health visit - making it both a clinical tool and a community health record.
Key Differences: WHO vs. NCHS (Old Reference)
The 2006 WHO standards produce notably different estimates than the older NCHS/WHO reference, especially in infancy:
- Stunting rates are higher throughout childhood using WHO 2006
- Wasting rates are substantially higher in infancy
- Underweight rates increase in the first 6 months of life (due to the breastfed growth pattern used as reference) then decrease thereafter
This reflects the fact that WHO 2006 describes how children should grow under optimal conditions, rather than how they do grow in a general population.
Source: Park's Textbook of Preventive and Social Medicine, pp. 636-638
This is a shared conversation. Sign in to Orris to start your own chat.