
GMR in community medicine
growth monitoring road to health chart child malnutrition community medicine
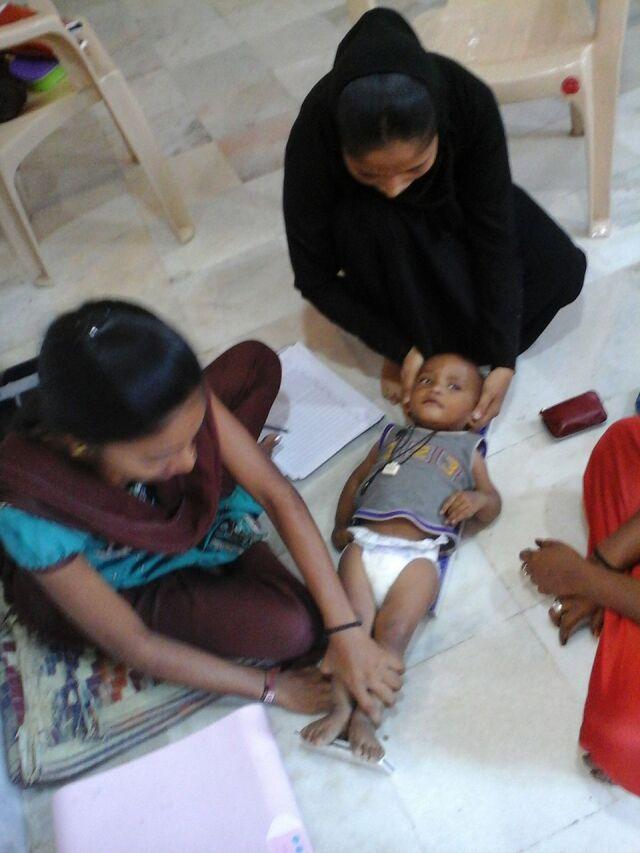
A clinical photograph depicting growth monitoring and anthropometric assessment of an infant by frontline health workers in a community health setting. The infant is positioned supine on a floor surface for length measurement. One health worker is situated at the head, ensuring proper alignment and stabilization of the infant's crown against a headboard. A second health worker is positioned at the infant's feet, extending the legs and ensuring the feet are flexed against a footboard to obtain an accurate recumbent length measurement. Essential medical equipment and documentation tools are visible, including a pink infant weighing scale, a notebook for data recording, and a pen. This image illustrates the standardized procedures for screening and monitoring pediatric nutritional status, specifically as part of a Community-Based Management of Acute Malnutrition (CMAM) program. The educational focus is on the clinical technique for infant anthropometry and the role of community-based health interventions in pediatric primary care.
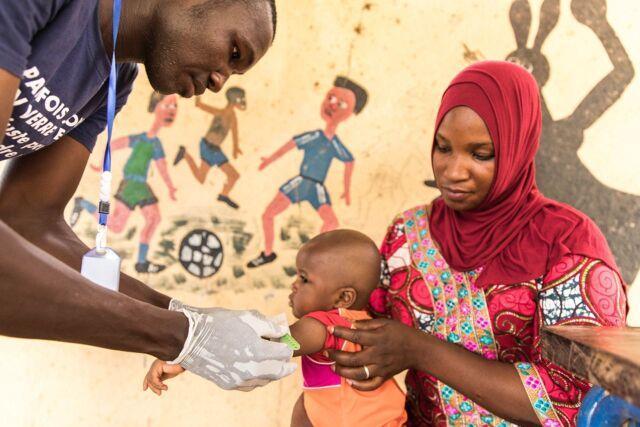
This clinical photograph depicts a Community Health Worker (CHW) in Mali performing a pediatric nutritional assessment. The healthcare worker, wearing protective gloves and a blue identification lanyard, is utilizing a Mid-Upper Arm Circumference (MUAC) tape—a color-coded screening tool—to measure the arm of an infant. The infant is being held by a caregiver, a woman dressed in a red hijab and patterned garment. This visual demonstrates primary healthcare delivery and growth monitoring in a resource-limited setting. The educational focus of the image is on the practical application of anthropometric measurements to screen for childhood malnutrition (wasting) at the community level. The setting is likely a village health post or mobile clinic, indicated by the hand-painted educational murals in the background. This image illustrates concepts related to global health, community-based primary care, and public health nutrition initiatives targeting rural populations.
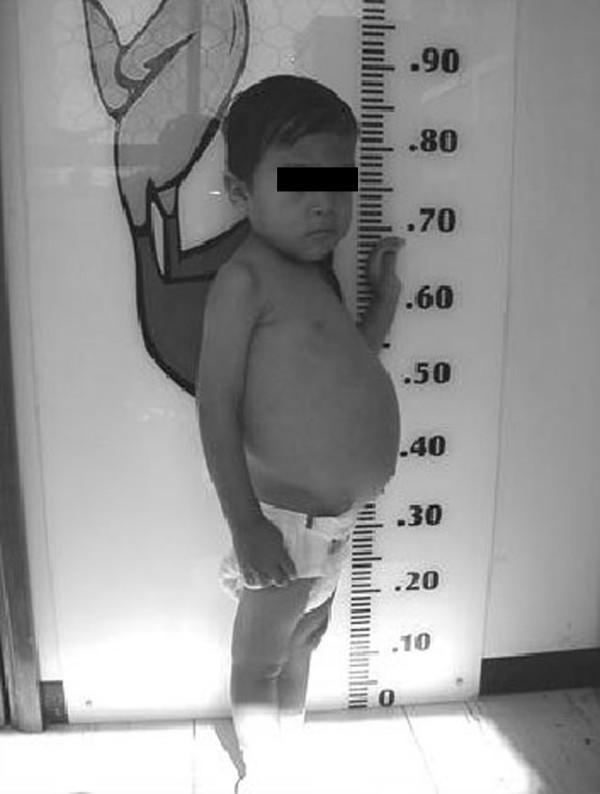
This clinical photograph shows a toddler-aged child in a lateral-oblique view, positioned against a height measurement chart to demonstrate growth parameters. The image illustrates classic clinical manifestations of severe malabsorption or untreated celiac disease. Significant features include marked abdominal distention (protuberant abdomen) contrasting with hypotrophic upper and lower limbs, which exhibit visible muscle wasting and loss of subcutaneous fat. This body composition is indicative of failure to thrive and chronic malnutrition in a pediatric patient. The child's height is shown relative to the metric scale, supporting a clinical assessment of growth retardation or being below the fifth percentile for age. The image serves as an educational example of the physical signs associated with gastrointestinal malabsorptive disorders and their impact on pediatric development.
GMR - Growth Monitoring in Community Medicine
What is Growth Monitoring?
"Growth monitoring is a low cost technology available for reducing infant mortality. All infants should be weighed periodically (at least once a month) and their growth charts maintained." - Park's Textbook of Preventive and Social Medicine
The Road-to-Health (Growth) Chart
- Shows weight-for-age over time (0-3 or 0-5 years)
- Contains a normal zone, an undernutrition zone (below -2 SD), and a severely underweight zone (below -3 SD)
- Direction of growth is more important than the actual position on the chart
- Flattening or falling of the weight curve = growth faltering - the earliest sign of Protein-Energy Malnutrition (PEM), preceding clinical signs by weeks to months
- Maintained by the mother and brought to the health centre at each visit
WHO Child Growth Standards (2006)
- Length/height-for-age
- Weight-for-age
- Weight-for-length/height
- BMI-for-age
- (All as percentile and Z-score curves for 0-60 months)
Uses of the Growth Chart (7 Uses)
| # | Use |
|---|---|
| 1 | Growth monitoring - longitudinal follow-up of child health |
| 2 | Diagnostic tool - identifies "high-risk" children; detects malnutrition before clinical signs appear |
| 3 | Planning and policy making - grading malnutrition provides objective basis for programme planning at local/national level |
| 4 | Educational tool - visual character helps educate the mother in child care and motivates her participation |
| 5 | Tool for action - guides health worker on type of intervention; facilitates referrals |
| 6 | Evaluation - assesses effectiveness of corrective measures and impact of programmes |
| 7 | Teaching tool - demonstrates importance of adequate feeding and deleterious effects of diarrhoea |
"The growth chart has been described as a passport to child health care." - Park's Textbook
Alternative Methods of Growth Monitoring
- Height-for-age (reflects chronic malnutrition/stunting)
- Weight-for-height (reflects acute malnutrition/wasting) - independent of age
- Mid-Upper Arm Circumference (MUAC) - independent of age; useful when age is unknown
Growth Monitoring vs. Nutritional Surveillance (Table 35, Park's)
| Factor | Growth Monitoring | Nutritional Surveillance |
|---|---|---|
| Strategy | Preservation of normal growth | Detection of undernutrition |
| Approach | Educational-motivational | Diagnostic-interventional |
| Enrolment | All infants | Representative sample only |
| Age | Start before 6 months; monthly | Representative ages at longer intervals |
| Group size | Small (10-20) | Any size; 50-100 most efficient |
| Weigher | Mothers guided by worker | Trained worker |
| Weight card | Simple; emphasis on growth | Precise; nutritional status |
| Nutritional emphasis | Maintaining good nutrition | Detecting malnutrition |
| Response time | Brief - resumption of normal growth | Long - regain of good nutrition in community |
| Interventions | ORT, vaccines, Vit A, deworming, contraceptives, chloroquine | Food supplements; community-wide food subsidy |
| Referral | Health system for check-up ± brief supplements | Malnutrition rehabilitation centre |
GMR in the Context of GOBI-FFF
- G - Growth monitoring
- O - Oral rehydration therapy
- B - Breast-feeding
- I - Immunization
- F - Female education
- F - Family planning
- F - Food supplementation
Role in Reducing Infant Mortality
Context within ICDS
How to calculate GMR
GMR = (Number of children weighed / Number of children enrolled) × 100
GMR growth monitoring rate formula calculation community medicine ICDS
GMR "growth monitoring rate" formula "number of children weighed" divided ICDS programme indicator
https://documents1.worldbank.org/curated/en/7216015199119166…
How to Calculate GMR (Growth Monitoring Rate)
The SKDN Framework
| Letter | What it represents |
|---|---|
| S | Total number of children under 5 in the community (the universe/denominator) |
| K | Number of children registered (with a growth card/enrolled) |
| D | Number of children weighed that month |
| N | Number of children who gained weight (N from the Dutch word "naik" = up) |
If the programme is running well, ideally: S = K = D = N
GMR Formula
| Component | Meaning |
|---|---|
| D | Number of children weighed in the given month/period |
| K | Number of children registered/enrolled (with growth cards) |
Other Derived Rates from SKDN
| Rate | Formula | What it measures |
|---|---|---|
| Coverage rate | (K/S) × 100 | % of all under-5s enrolled in programme |
| GMR (Participation rate) | (D/K) × 100 | % of enrolled children actually weighed |
| Growth rate / Weight gain rate | (N/D) × 100 | % of weighed children who gained weight |
| Overall effectiveness | (N/S) × 100 | % of all under-5s in community who gained weight |
DHS / Survey-based GMR Calculation
- Numerator: Children 0-59 months whose weight was measured by a healthcare provider in the past 3 months
- Denominator: All children 0-59 months in the survey population
- Multiply by 100 to express as a percentage
Interpreting GMR
| GMR Value | Interpretation |
|---|---|
| ≥ 80% | Good - programme functioning well |
| 60-79% | Moderate - needs improvement |
| < 60% | Poor - significant gaps in coverage |
Practical Example
- Total under-5 children in the area (S) = 80
- Children registered/enrolled with growth cards (K) = 70
- Children weighed this month (D) = 56
- Children who gained weight (N) = 42
| Calculation | Result |
|---|---|
| Coverage rate = (K/S) × 100 = (70/80) × 100 | 87.5% |
| GMR = (D/K) × 100 = (56/70) × 100 | 80% |
| Weight gain rate = (N/D) × 100 = (42/56) × 100 | 75% |
| Programme effectiveness = (N/S) × 100 = (42/80) × 100 | 52.5% |