
Power of muscle definition
Reading File
"Power of muscle" is a broad anatomical/physiological topic. Let me search the medical library and web in parallel.
Searching sources...
Finding Sources
Finding Sources
Searching the Web
muscle power definition physiology force velocity strength
Now let me pull the relevant textbook content on muscle power and the myosin power stroke:
Reading File
Finding Sources
Reading File
Reading File
Now let me fetch the power stroke diagram to include it visually:
Loading Image
Reading File
Excellent - I now have rich, authoritative content from multiple textbooks. Here is a full, well-structured answer:
Power of Muscle - Definition and Physiology
What Is Muscle Power?
Muscle power is distinct from strength and endurance. The formal definition:
Power = Force × Velocity (or equivalently, Power = Work / Time)
- Muscle strength = the maximal force a muscle can produce at a given joint angle, contraction type, and speed
- Muscle power = the rate at which a muscle does work - an interaction between the force of contraction and the speed of contraction, measured in watts (W) or kg-m/min
- Muscle endurance = the ability to sustain repeated contractions over time
A muscle can be very strong (high force) yet produce modest power if contraction velocity is low - and vice versa.
The Molecular Basis: The Myosin Power Stroke
At the nanoscale, muscle power is generated by the cross-bridge cycle - repeated "power strokes" of myosin heads pulling on actin thin filaments.
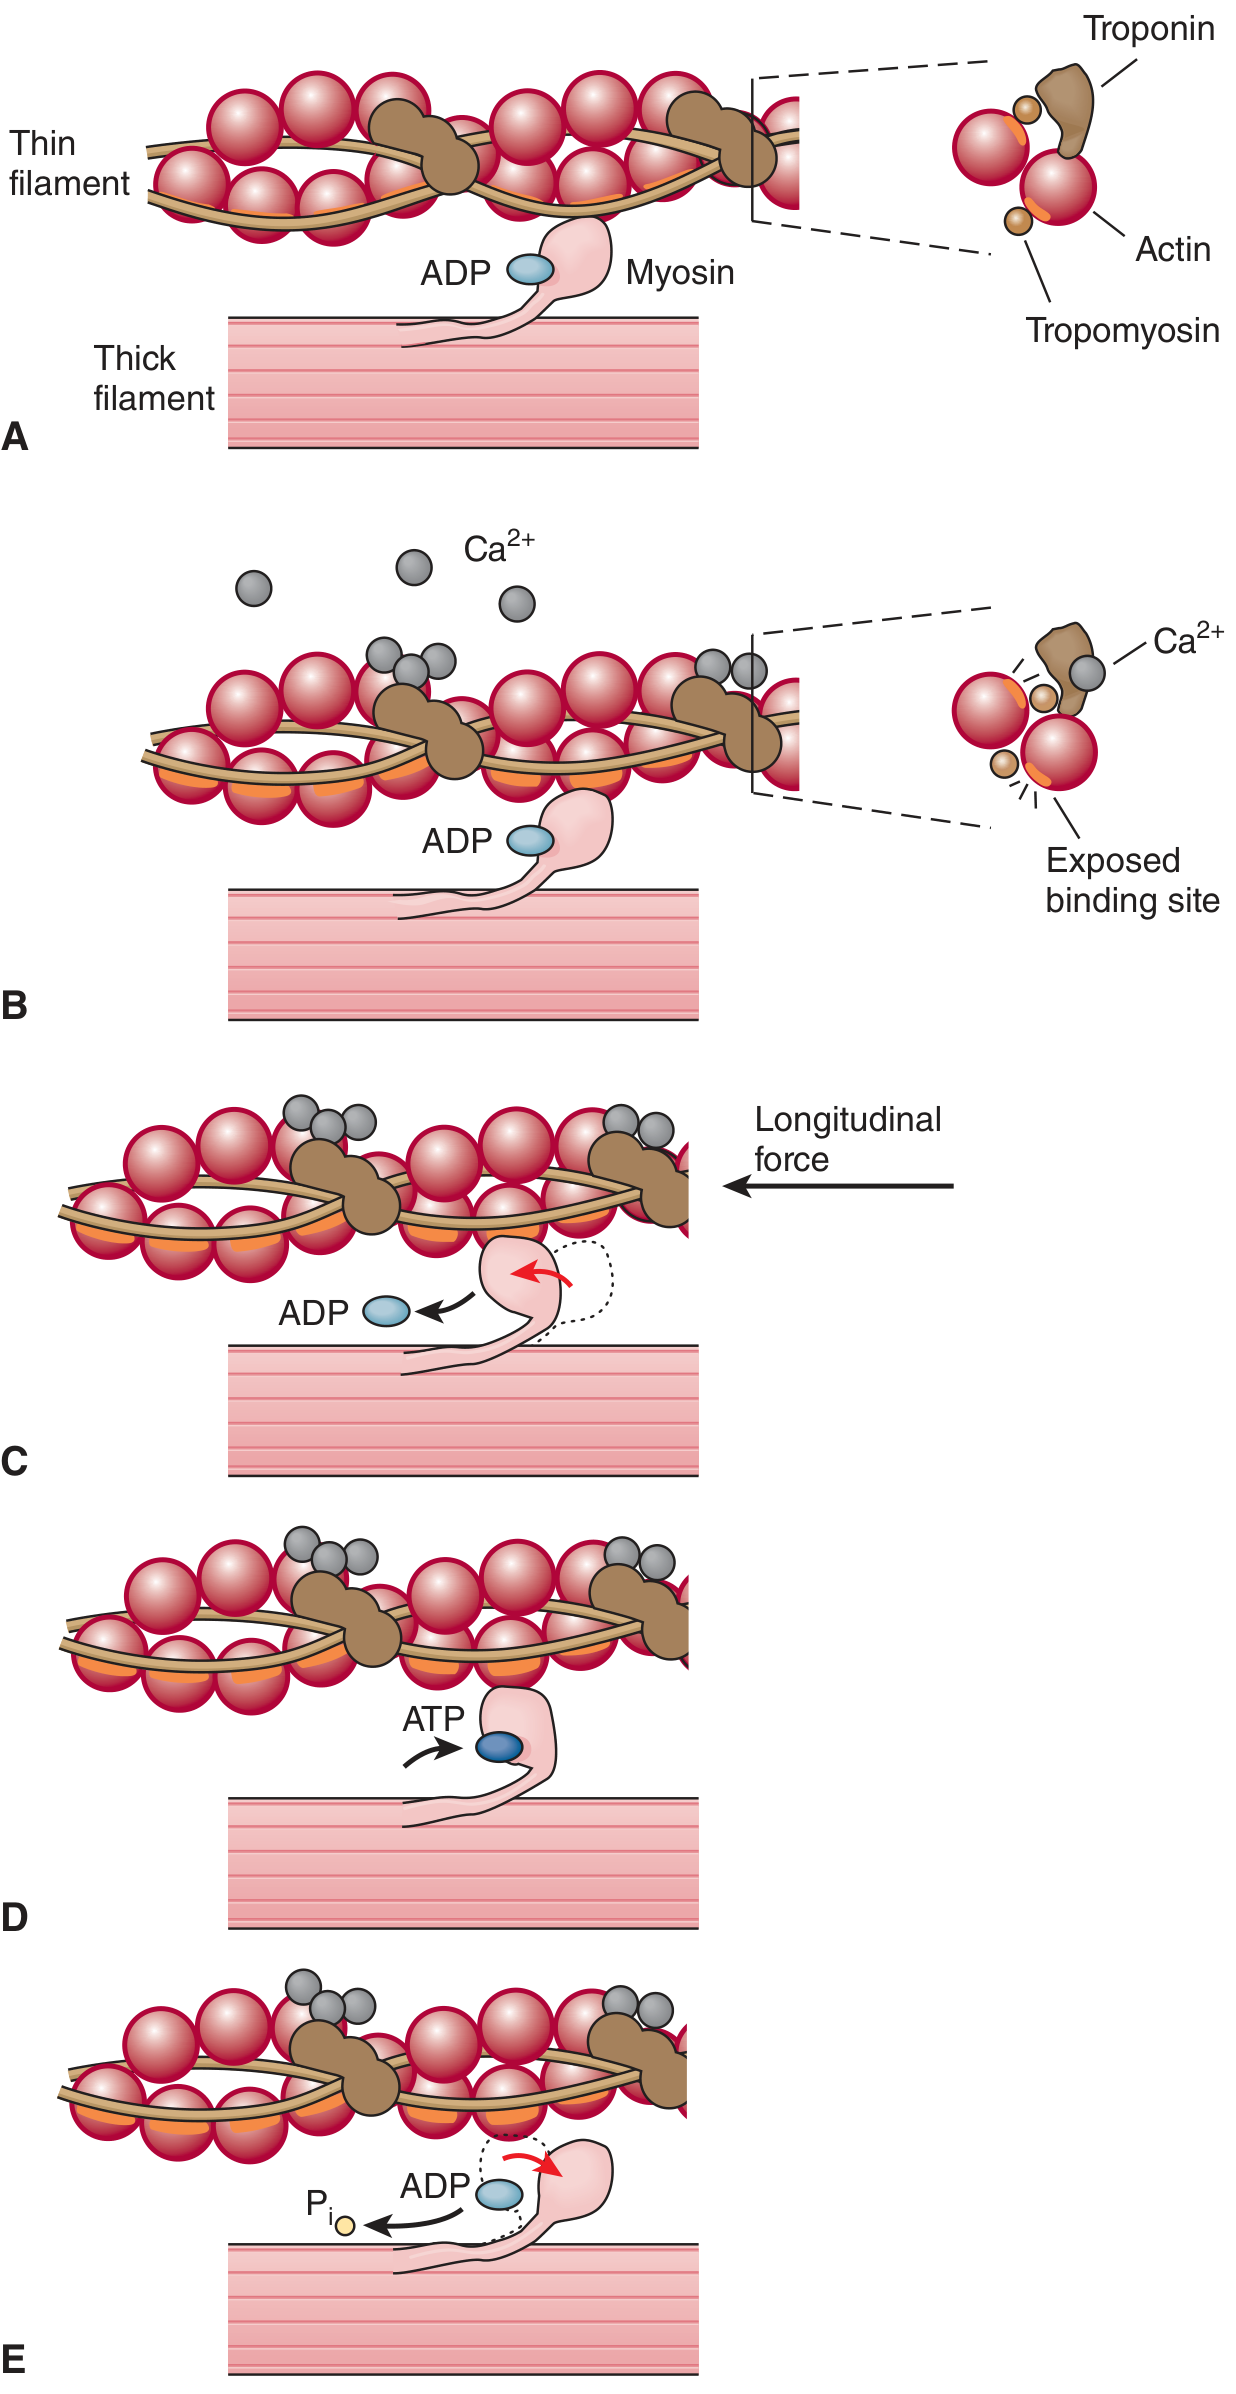
Five steps of the power stroke (Ganong's Review of Medical Physiology, 26e, p. 116):
| Step | Event |
|---|---|
| A - Rest (cocked) | Myosin head holds ADP + Pi in a "cocked" position; tropomyosin covers actin binding sites |
| B - Ca²+ release | Action potential triggers Ca²+ release from the sarcoplasmic reticulum; Ca²+ binds troponin C, exposing actin binding sites |
| C - Power stroke | Myosin head binds actin, ADP is released - this triggers a conformational change (rotation) that pulls the thin filament ~10 nm, shortening the sarcomere |
| D - Detachment | ATP binds to the free site on myosin, causing detachment from actin |
| E - Re-cocking | ATP is hydrolyzed to ADP + Pi, restoring the cocked position |
Each thick filament has ~500 myosin heads, each cycling ~5 times per second during rapid contraction. As long as Ca²+ remains elevated and ATP is available, the cycle repeats - generating gross muscle contraction.
The Force-Velocity Relationship and Power
The force-velocity curve is the key to understanding muscle power:
- At zero velocity (isometric contraction): force is maximal but no work is done - so power = 0
- As shortening velocity increases, force decreases (fewer cross-bridges can attach; heads spend more time in the low-force phase of their power stroke)
- At maximum velocity (Vmax): force = 0, so power = 0 again
- Peak power occurs at an intermediate point: approximately 30-40% of maximum isometric force and 30-40% of Vmax
"The muscle achieves peak power at relatively moderate loads (30% to 40% of isometric tension) and velocities (30% to 40% of maximum shortening velocity). The capacity of a muscle to perform positive work determines physical performance." - Medical Physiology (Boron & Boulpaep)
The reason force drops with speed: at higher shortening velocities, myosin heads spend more time near the end of their power stroke (low force phase) and more time detaching and re-cocking (zero force). During lengthening (eccentric) contractions, the opposite occurs - force actually exceeds isometric values because heads are pulled beyond their attachment angle without needing to re-cock.
Determinants of Whole-Muscle Power
From Principles of Neural Science (Kandel, 6e) and Miller's Review of Orthopaedics:
- Fiber cross-sectional area - determines force capacity (sarcomeres in parallel)
- Fiber length - determines range of motion and maximal shortening velocity (sarcomeres in series)
- Fiber type
- Type I (slow-twitch): fatigue-resistant, low power output
- Type IIa / IIx (fast-twitch): higher power, faster shortening velocity (Vmax), fatigue faster
- Motor unit recruitment - well-conditioned muscle can activate >90% of fibers simultaneously
- Pennation angle - pennate muscles (fibers angled to the line of pull) pack more fibers into a given volume, increasing force at the cost of velocity
- Series elastic elements - tendons and connective tissue act as springs; during a stretch-shorten cycle (e.g., running), stored elastic energy is released to boost power output beyond what contractile elements alone could produce
Power Training vs. Strength Training
| Property | Strength Training | Power Training |
|---|---|---|
| Goal | Maximize force (Fmax) | Maximize force × velocity |
| Loads | Heavy (>85% 1RM) | Moderate-light (30-70% 1RM) |
| Velocity | Slow | As fast as possible |
| Examples | Heavy squats, deadlifts | Olympic lifts, plyometrics, jump squats |
| Adaptation | More cross-sectional area, motor unit recruitment | Increased maximal shortening velocity (Vmax), shift in fiber type toward IIa |
Power training is associated with an increase in the maximal shortening velocity of muscle fibers, linked to shifts in myosin heavy chain isoform expression.
Clinical Relevance - MRC Scale for Muscle Power
In clinical neurology, muscle power is graded using the Medical Research Council (MRC) scale (from Localization in Clinical Neurology, 8e):
| Grade | Description |
|---|---|
| 0 | No contraction |
| 1 | Flicker/trace of contraction |
| 2 | Active movement with gravity eliminated |
| 3 | Active movement against gravity |
| 4 | Active movement against resistance (reduced) |
| 5 | Normal power |
Fatigue and Power Decline
Muscle fatigue is defined as the inability to maintain a desired power output - resulting in concurrent decline of both force and velocity of shortening (Medical Physiology). This reflects ATP depletion, accumulation of inorganic phosphate (which inhibits cross-bridge force generation), and acidosis that slows the cross-bridge cycle.
Sources:
- Ganong's Review of Medical Physiology, 26e, p. 116
- Medical Physiology (Boron & Boulpaep), p. 1763-1764
- Principles of Neural Science (Kandel), 6e, pp. 797-799
- Miller's Review of Orthopaedics, 9e
This is a shared conversation. Sign in to Orris to start your own chat.