
Cardiology in detail from basics to advanced
Reading File
Cardiology spans the normal heart through emergency and specialist care. A useful learning path is:
-
Foundations
- Cardiac anatomy and embryology
- Electrophysiology and cardiac cycle
- Hemodynamics, blood pressure, preload, afterload, and cardiac output
- Coronary circulation and autonomic regulation
-
Clinical examination and investigations
- History, pulse, jugular venous pressure, heart sounds, and murmurs
- ECG from basic rhythm recognition to ischemia and conduction blocks
- Chest X-ray, echocardiography, stress testing, CT/MRI, and cardiac catheterization
- Cardiac biomarkers and lipid testing
-
Coronary artery disease
- Atherosclerosis and risk factors
- Stable angina, acute coronary syndromes, myocardial infarction
- Medical therapy, PCI, CABG, and secondary prevention
-
Heart failure and cardiomyopathies
- HFrEF, HFpEF, acute decompensated heart failure
- Dilated, hypertrophic, restrictive, arrhythmogenic, and stress cardiomyopathies
- Guideline-directed drug treatment and devices
-
Arrhythmias
- Sinus-node disease, atrial fibrillation/flutter, SVT, ventricular tachycardia/fibrillation
- Bradyarrhythmias, AV block, pacemakers, ICDs, and ablation
- Anticoagulation and stroke prevention
-
Valvular heart disease
- Aortic stenosis/regurgitation, mitral stenosis/regurgitation, tricuspid and pulmonary valve disease
- Murmur interpretation, echo assessment, repair/replacement, and TAVR
-
Hypertension and vascular disease
- Primary and secondary hypertension
- Aortic aneurysm/dissection
- Peripheral arterial disease, venous thromboembolism, pulmonary hypertension
-
Congenital and structural heart disease
- ASD, VSD, PDA, Tetralogy of Fallot, coarctation, cyanotic congenital disease
- Adult congenital heart disease and structural interventions
-
Pericardial, endocardial, and myocardial inflammation
- Pericarditis, tamponade, constrictive pericarditis
- Infective endocarditis
- Myocarditis and rheumatic heart disease
-
Advanced and critical cardiology
- Shock, cardiac arrest, ACLS principles
- Mechanical circulatory support, LVAD, transplantation
- Cardio-oncology, pregnancy and heart disease, preventive cardiology
At a high level, cardiology is built on four recurring questions: Is myocardial blood supply adequate? Is the pump working? Is the rhythm stable? Are the valves and vessels structurally normal? ECG and echocardiography are central tools because they quickly assess electrical activity and cardiac structure/function.
Which section should I teach in depth first?
- Foundations and hemodynamics
- ECG, examination, and investigations
- Coronary artery disease and MI
- Heart failure and cardiomyopathies
- Arrhythmias
- Valvular heart disease
- Start a structured course from Foundations
Foundation and hemodynamics
Reading File
Finding Sources
Finding Sources
Finding Sources
Finding Sources
Searching PubMed
cardiac hemodynamics AND physiology
Searching the Web
Merck Manual cardiac cycle preload afterload cardiac output physiology
Reading File
Reading File
Reading File
Finding Sources
Finding Sources
Searching Images
labeled left ventricular pressure volume loop cardiac cycle isovolumetric contraction ejection relaxation filling
Cardiology Foundations and Hemodynamics
Cardiology begins with one core purpose:
The cardiovascular system delivers oxygen and nutrients to tissues and removes carbon dioxide and metabolic waste.
For this to work, the heart must generate adequate flow, arteries must maintain adequate pressure, blood must carry adequate oxygen, and veins must return blood to the heart.
A practical framework:
- Pump: heart muscle and valves
- Pipes: arteries, veins, capillaries
- Flow: cardiac output
- Pressure: arterial blood pressure
- Load on the pump: preload and afterload
- Pump strength: contractility
- Oxygen transport: hemoglobin, saturation, and cardiac output
1. Basic cardiac anatomy and direction of flow
The heart has four chambers:
| Right heart | Main role |
|---|---|
| Right atrium (RA) | Receives deoxygenated systemic venous blood |
| Right ventricle (RV) | Pumps blood to lungs through pulmonary artery |
| Left heart | Main role |
|---|---|
| Left atrium (LA) | Receives oxygenated blood from pulmonary veins |
| Left ventricle (LV) | Pumps blood to the systemic circulation through the aorta |
Blood pathway
Body tissues → superior/inferior vena cava → RA → tricuspid valve → RV → pulmonary valve → pulmonary artery → lungs → pulmonary veins → LA → mitral valve → LV → aortic valve → aorta → body tissues
The right and left circulations are arranged in series. In the steady state:
[
\text{Right ventricular output} = \text{Left ventricular output}
]
If this equality is lost for a sustained period, blood accumulates upstream:
- RV output lower than LV output: reduced pulmonary blood flow and reduced LV filling
- LV output lower than RV output: pulmonary venous congestion and pulmonary edema
The valves
| Valve | Between | Opens when |
|---|---|---|
| Tricuspid | RA and RV | RA pressure exceeds RV pressure |
| Pulmonary | RV and pulmonary artery | RV pressure exceeds pulmonary arterial pressure |
| Mitral | LA and LV | LA pressure exceeds LV pressure |
| Aortic | LV and aorta | LV pressure exceeds aortic pressure |
Valves open and close passively, due to pressure gradients. They do not actively pull open.
2. Electrical activity and its mechanical consequence
Electrical activation normally follows this sequence:
- SA node fires
- Depolarization spreads across atria
- AV node delays conduction briefly
- Signal travels through the His bundle, bundle branches, and Purkinje fibers
- Ventricles depolarize and contract in a coordinated fashion
ECG and mechanical events
| ECG feature | Electrical event | Mechanical consequence |
|---|---|---|
| P wave | Atrial depolarization | Atrial contraction follows |
| PR interval | AV nodal conduction delay | Allows time for ventricular filling |
| QRS complex | Ventricular depolarization | Ventricular systole begins shortly afterward |
| T wave | Ventricular repolarization | Ventricular relaxation follows |
Atria contract first, then ventricles. The AV nodal delay makes this sequence possible.
3. Cardiac cycle
A cardiac cycle is one complete heartbeat. It consists of ventricular filling, contraction, ejection, and relaxation.
The left-sided events are usually emphasized, but the same principles apply to the right side at lower pressures.
The major phases
| Phase | Ventricular state | Valve status | Main event |
|---|---|---|---|
| 1. Atrial systole | Relaxed | Mitral open, aortic closed | Atria provide final ventricular filling |
| 2. Isovolumetric contraction | Contracting | All valves closed | LV pressure rises rapidly; volume does not change |
| 3. Rapid ejection | Contracting | Aortic open | Blood rapidly enters aorta |
| 4. Reduced ejection | Contracting, then relaxing | Aortic open | Ejection slows |
| 5. Isovolumetric relaxation | Relaxing | All valves closed | LV pressure falls rapidly; volume does not change |
| 6. Rapid filling | Relaxed | Mitral open | Blood rapidly enters LV from LA |
| 7. Reduced filling or diastasis | Relaxed | Mitral open | Slow passive ventricular filling |
Costanzo Physiology, 7th ed., pp. 160-161.
Heart sounds
| Sound | Cause | Timing |
|---|---|---|
| S1 | Closure of mitral and tricuspid valves | Beginning of ventricular systole |
| S2 | Closure of aortic and pulmonary valves | Beginning of ventricular diastole |
| S3 | Rapid filling into a dilated or volume-overloaded ventricle | Early diastole |
| S4 | Atrial contraction against a stiff ventricle | Late diastole |
Clinical interpretation:
- S3 may be normal in children, young adults, or pregnancy, but in older adults often suggests volume overload or heart failure.
- S4 suggests reduced ventricular compliance, such as LV hypertrophy, ischemia, or hypertrophic cardiomyopathy. It is generally absent in atrial fibrillation because there is no organized atrial contraction.
4. Pressure changes during the cardiac cycle
Blood flows from higher pressure to lower pressure.
Typical approximate pressures:
| Location | Pressure |
|---|---|
| Right atrium | 0-5 mmHg |
| Right ventricle | 15-30 / 0-8 mmHg |
| Pulmonary artery | about 25 / 10 mmHg |
| Left atrium | about 5-12 mmHg |
| Left ventricle | about 120 / 5-12 mmHg |
| Aorta | about 120 / 80 mmHg |
The LV develops much higher pressure than the RV because systemic vascular resistance is much greater than pulmonary vascular resistance.
Atrial pressure waves
The jugular venous pulse reflects right atrial pressure:
- a wave: right atrial contraction
- c wave: bulging of tricuspid valve into RA during early RV contraction
- v wave: venous filling of RA while tricuspid valve is closed
5. Cardiac output, stroke volume, and ejection fraction
Cardiac output
Cardiac output (CO) is the blood volume pumped by one ventricle each minute.
[
\text{CO} = \text{Heart rate} \times \text{Stroke volume}
]
Example:
[
70\ \text{beats/min} \times 70\ \text{mL/beat} = 4900\ \text{mL/min}
]
Thus, resting cardiac output is commonly around 5 L/min in an average adult.
Stroke volume
Stroke volume (SV) is the blood ejected by one ventricle in one beat.
[
\text{SV} = \text{End-diastolic volume} - \text{End-systolic volume}
]
- End-diastolic volume (EDV): LV volume immediately before contraction
- End-systolic volume (ESV): LV volume after ejection
Ejection fraction
[
\text{Ejection fraction (EF)} = \frac{\text{SV}}{\text{EDV}} \times 100
]
Example:
- EDV = 140 mL
- ESV = 70 mL
- SV = 70 mL
- EF = 70/140 = 50%
EF describes the fraction of filled ventricular blood ejected per beat. It is useful, but it is not identical to cardiac output or contractility.
A person may have:
- A normal EF but low output, for example with a very small LV cavity or severe tachycardia
- A reduced EF but acceptable output at rest through compensatory tachycardia or increased filling
Costanzo Physiology, 7th ed., pp. 154-155.
Cardiac index
Because body size affects output, cardiac output may be indexed to body surface area:
[
\text{Cardiac index} = \frac{\text{CO}}{\text{Body surface area}}
]
Typical resting cardiac index is approximately 2.5-4.0 L/min/m².
6. The three major determinants of stroke volume
Stroke volume is mainly determined by:
- Preload
- Afterload
- Contractility
A fourth clinically important property is lusitropy, the ability of the myocardium to relax.
7. Preload
Definition
Preload is ventricular myocardial fiber stretch immediately before contraction.
For the LV, it is most closely related to:
- LV end-diastolic volume
- LV end-diastolic pressure
- Venous return
In simple terms:
Preload is how full the ventricle is before it contracts.
Strictly, preload is a measure of myocardial fiber length or wall stress at end-diastole. EDV and filling pressure are practical clinical surrogates, but they are not always interchangeable.
Factors that increase preload
- Increased blood volume
- Venoconstriction
- Leg elevation
- Inspiration increasing right-sided venous return
- Slow heart rate, which increases filling time
- Mitral or aortic regurgitation, depending on the chamber considered
- Heart failure with fluid retention
Factors that reduce preload
- Hemorrhage
- Dehydration
- Venodilation, including nitrates
- Diuretics
- Positive-pressure ventilation
- Standing suddenly
- Tachycardia, when diastolic filling time becomes very short
8. Frank-Starling mechanism
The Frank-Starling law states:
Within physiological limits, increased ventricular filling produces a stronger contraction and greater stroke volume.
More venous return increases EDV, stretching myocardial fibers. This increases force generation and enhances ejection.
[
\uparrow \text{Venous return} \rightarrow \uparrow \text{EDV/preload} \rightarrow \uparrow \text{SV}
]
The mechanism helps the heart match its output to its input. In steady state:
[
\text{Cardiac output} = \text{Venous return}
]
This is why, if more blood returns to the heart, the heart normally pumps more blood forward. Costanzo Physiology, 7th ed., pp. 155-156.
Important limitation
The relationship is not unlimited. In a failing or severely dilated heart, further increases in filling pressure may cause little increase in stroke volume while markedly worsening pulmonary or systemic congestion.
Clinical example:
- A healthy person receiving a modest fluid load may increase stroke volume.
- A patient with advanced heart failure may instead develop rising pulmonary capillary pressure, dyspnea, and pulmonary edema.
9. Afterload
Definition
Afterload is the force or pressure the ventricle must overcome to eject blood.
For the LV, it is related primarily to:
- Aortic pressure
- Systemic vascular resistance
- Arterial stiffness
- LV wall stress
- Aortic valve obstruction
In simple terms:
Afterload is the resistance against which the ventricle pumps.
Conditions that increase LV afterload
- Systemic hypertension
- Aortic stenosis
- Vasoconstriction
- Increased systemic vascular resistance
- Increased arterial stiffness
Conditions that reduce LV afterload
- Arterial vasodilation
- Reduced systemic vascular resistance
- Drugs such as ACE inhibitors, ARBs, hydralazine, or nitroprusside in appropriate clinical settings
Effect of increased afterload
An acute rise in afterload makes ejection more difficult:
[
\uparrow \text{Afterload} \rightarrow \uparrow \text{ESV} \rightarrow \downarrow \text{SV}
]
The LV may initially compensate by increasing EDV through the Frank-Starling mechanism. Long-standing pressure overload can lead to concentric LV hypertrophy.
The physiology text identifies LV preload with LV end-diastolic volume and LV afterload with aortic pressure. Costanzo Physiology, 7th ed., p. 154. The clinical implication that cardiac output commonly falls as afterload rises is also summarized in NCBI's review of afterload reduction.
10. Contractility
Contractility, also called inotropy, is the intrinsic ability of myocardium to generate force at a given preload and afterload.
It is not simply “how hard the heart is working.” A ventricle can generate more pressure because it is better filled, but that is a preload effect, not necessarily increased contractility.
Increased contractility
Causes:
- Sympathetic stimulation via beta-1 receptors
- Catecholamines
- Positive inotropes, such as dobutamine
- Increased intracellular calcium availability
Effects:
[
\uparrow \text{Contractility} \rightarrow \downarrow \text{ESV} \rightarrow \uparrow \text{SV and EF}
]
Reduced contractility
Causes:
- Myocardial infarction or ischemia
- Dilated cardiomyopathy
- Myocarditis
- Severe acidosis
- Some drugs, including beta-blockers and non-dihydropyridine calcium channel blockers
Effects:
[
\downarrow \text{Contractility} \rightarrow \uparrow \text{ESV} \rightarrow \downarrow \text{SV and EF}
]
11. Lusitropy and diastolic function
Lusitropy means myocardial relaxation. Normal diastolic function requires:
- Active calcium reuptake into the sarcoplasmic reticulum
- Adequate ATP
- A compliant ventricle
- Adequate time for filling
Impaired relaxation or a stiff ventricle produces diastolic dysfunction. Filling pressure may rise even when EF is preserved.
Examples include:
- Long-standing hypertension with LV hypertrophy
- Hypertrophic cardiomyopathy
- Ischemia
- Aging-related myocardial stiffness
- Restrictive cardiomyopathy
This explains heart failure with preserved ejection fraction (HFpEF): the ventricle may contract reasonably well but cannot fill at normal pressures.
12. Pressure-volume loop
A pressure-volume loop integrates the mechanical events of one LV cardiac cycle.
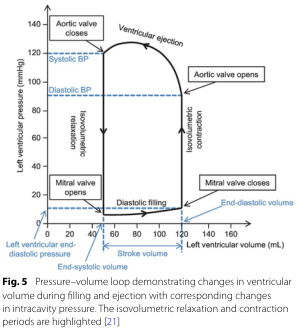
How to read it
Starting at the lower left:
-
Ventricular filling
- Mitral valve open
- Aortic valve closed
- Volume rises from ESV to EDV
- Pressure rises only slightly in a compliant ventricle
-
Isovolumetric contraction
- Mitral valve closes, producing S1
- Both valves closed
- Pressure rises sharply
- Volume remains constant at EDV
-
Ejection
- LV pressure exceeds aortic pressure
- Aortic valve opens
- Volume falls from EDV to ESV
- Stroke volume is the loop width
-
Isovolumetric relaxation
- Aortic valve closes, producing S2
- Both valves closed
- Pressure falls quickly
- Volume remains constant at ESV
-
When LV pressure becomes lower than LA pressure, the mitral valve opens and filling begins again.
Key relationships
| Change | PV-loop change | Result |
|---|---|---|
| Increased preload | Loop moves right, EDV rises | SV rises if contractility and afterload are unchanged |
| Increased afterload | Higher pressure and higher ESV | SV falls |
| Increased contractility | ESV decreases, end-systolic relationship shifts left/up | SV and EF rise |
| Reduced contractility | ESV rises, end-systolic relationship shifts right/down | SV and EF fall |
| Reduced compliance | Diastolic curve shifts up/left | Higher filling pressure for a given volume |
13. Blood pressure, flow, and resistance
The central relationship
[
\text{Flow} = \frac{\Delta P}{R}
]
Where:
- Flow is blood flow
- (\Delta P) is the pressure difference between two points
- (R) is vascular resistance
For the systemic circulation:
[
\text{CO} = \frac{\text{MAP} - \text{RAP}}{\text{SVR}}
]
Because right atrial pressure is usually much lower than mean arterial pressure, this is often simplified conceptually as:
[
\text{MAP} \approx \text{CO} \times \text{SVR}
]
Mean arterial pressure
[
\text{MAP} \approx \text{DBP} + \frac{1}{3}(\text{SBP} - \text{DBP})
]
Example for 120/80 mmHg:
[
\text{MAP} \approx 80 + \frac{1}{3}(40) \approx 93\ \text{mmHg}
]
The approximation is less accurate at high heart rates because diastole becomes proportionally shorter.
Systemic vascular resistance
[
\text{SVR} = \frac{\text{MAP} - \text{RAP}}{\text{CO}} \times 80
]
The factor 80 converts units to dyn·s/cm⁵.
What controls resistance?
Arterioles are the main resistance vessels. Resistance is exquisitely sensitive to radius:
[
R \propto \frac{1}{r^4}
]
Therefore, small changes in arteriolar radius cause major changes in resistance and flow.
- Vasoconstriction: resistance rises
- Vasodilation: resistance falls
14. Compliance and arterial pressure
Compliance is the change in volume produced by a change in pressure.
[
\text{Compliance} = \frac{\Delta V}{\Delta P}
]
Veins have high compliance, so they can store large blood volumes with small pressure changes. This is why veins are called capacitance vessels.
Arteries are less compliant. With aging or atherosclerotic stiffening:
- Systolic pressure rises
- Pulse pressure widens
- LV afterload rises
- Coronary perfusion may be impaired
Pulse pressure
[
\text{Pulse pressure} = \text{SBP} - \text{DBP}
]
Wide pulse pressure can occur in:
- Arterial stiffening
- Aortic regurgitation
- High-output states
Narrow pulse pressure can occur in:
- Low stroke volume
- Cardiogenic shock
- Severe heart failure
- Cardiac tamponade
15. Venous return
Venous return (VR) is blood flow returning to the right atrium.
At equilibrium:
[
\text{Venous return} = \text{Cardiac output}
]
The principal determinants of venous return include:
- Blood volume
- Venous tone
- Skeletal muscle pump
- Respiratory pump
- Right atrial pressure
- Resistance to venous return
Mean systemic filling pressure
If the heart stopped and blood redistributed until pressures equalized, the resulting pressure throughout the systemic circulation would be the mean systemic filling pressure.
It rises with:
- Increased blood volume
- Venoconstriction
It falls with:
- Hemorrhage
- Venodilation
A useful conceptual equation is:
[
\text{VR} = \frac{\text{Mean systemic filling pressure} - \text{Right atrial pressure}}{\text{Resistance to venous return}}
]
If right atrial pressure rises, the gradient driving venous return falls.
16. Autonomic control of hemodynamics
Sympathetic stimulation
Sympathetic activation increases:
- Heart rate: positive chronotropy
- AV nodal conduction: positive dromotropy
- Contractility: positive inotropy
- Relaxation rate: positive lusitropy
- Arteriolar tone: increased SVR
- Venous tone: increased venous return and preload
Net result: cardiac output and blood pressure tend to rise.
Parasympathetic stimulation
The vagus nerve primarily affects:
- SA node: reduces heart rate
- AV node: slows conduction
It has relatively limited direct effect on ventricular contractility.
17. Oxygen delivery: why cardiac output matters
The purpose of circulation is not merely to generate pressure. It is to deliver oxygen.
[
\text{DO}_2 = \text{CO} \times \text{CaO}_2
]
Where (\text{DO}_2) is oxygen delivery and (\text{CaO}_2) is arterial oxygen content.
[
\text{CaO}_2 = (1.34 \times \text{Hb} \times \text{SaO}_2) + (0.003 \times \text{PaO}_2)
]
Key point: most oxygen in blood is carried by hemoglobin, not dissolved in plasma.
Thus, a patient can have normal oxygen saturation but poor oxygen delivery if they have:
- Severe anemia
- Low cardiac output
- Both anemia and low output
18. Clinical patterns to recognize
| Situation | Preload | Afterload | Contractility | Typical result |
|---|---|---|---|---|
| Hemorrhage | Decreased | Often increased compensatorily | Usually normal initially | Low SV and low CO |
| Sepsis, early distributive shock | Often decreased or normal | Markedly decreased | May be increased early | Low SVR, often high CO initially |
| Acute LV myocardial infarction | Often increased secondarily | Variable | Decreased | Low SV, increased ESV, pulmonary congestion |
| Chronic hypertension | Often increased | Increased | Initially preserved | LV hypertrophy, later HFpEF or HFrEF |
| Aortic stenosis | Often increased | Markedly increased | May fall late | Pressure-overloaded LV |
| Aortic regurgitation | Increased | Variable | Initially increased compensatorily | High total SV, volume overload |
| HFrEF | Increased filling pressure | Often increased | Decreased | Low EF, high ESV, congestion |
| HFpEF | Filling pressure increased | Often increased | EF preserved | Stiff LV, dyspnea from high filling pressure |
High-yield summary
- CO = HR × SV.
- SV = EDV - ESV.
- EF = SV / EDV.
- Preload is ventricular filling/stretch before contraction.
- Afterload is the opposition to ventricular ejection.
- Contractility is intrinsic myocardial force generation at a given preload and afterload.
- Frank-Starling mechanism matches cardiac output to venous return.
- MAP is determined mainly by CO and SVR.
- Arterioles control resistance; veins store most blood volume.
- The PV loop unifies filling, contraction, ejection, relaxation, valve events, preload, afterload, and contractility.
- A normal EF does not guarantee normal cardiac output or normal diastolic function.
- Oxygen delivery requires both adequate cardiac output and adequate hemoglobin-bound oxygen content.
The recent systematic-review search did not identify evidence that changes these established physiology principles.
This is a shared conversation. Sign in to Orris to start your own chat.