
Visual pathway
visual pathway diagram optic nerve chiasm tract radiation cortex
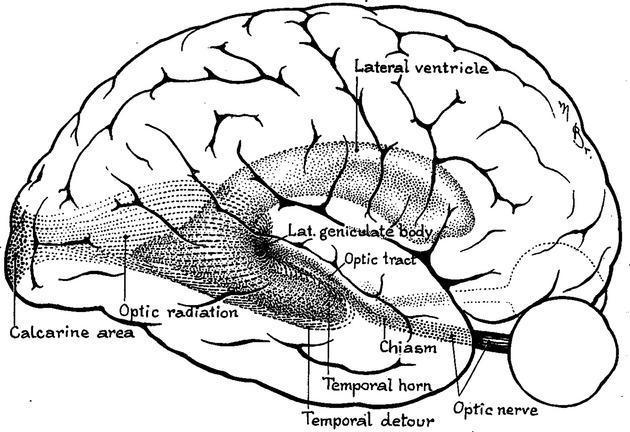
This anatomical diagram provides a lateral view of the human brain, specifically illustrating the visual pathway and the spatial distribution of the optic radiation. Based on Harvey Cushing's 1921 drawing, the illustration highlights the geniculocalcarine tract from its origin at the lateral geniculate body (LGB) to its termination in the primary visual cortex (calcarine area). A key educational focus is the 'temporal detour' or Meyer’s loop, where the ventral fibers of the optic radiation arc anteriorly around the temporal horn of the lateral ventricle before heading posteriorly toward the occipital lobe. Other labeled anatomical landmarks include the optic nerve, optic chiasm, optic tract, and the main body of the lateral ventricle. This diagram is significant for understanding neuroanatomy related to visual field deficits (e.g., quadrantanopia) that may arise from lesions or neurosurgical procedures in the temporal lobe, such as epilepsy surgery or tumor resection.
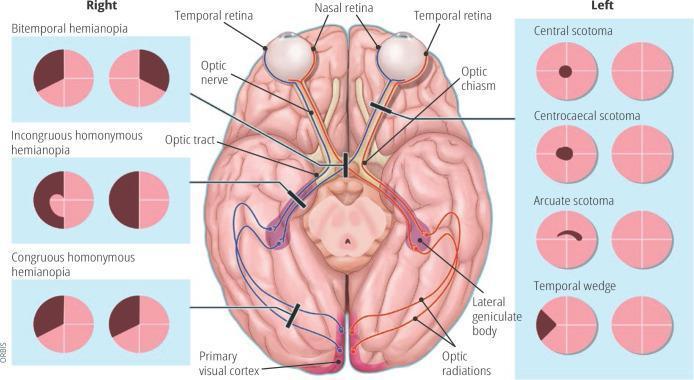
Anatomical diagram and educational infographic detailing the human visual pathway and associated visual field defects. The central illustration shows a superior (dorsal) view of the brain, highlighting the optic nerve, optic chiasm (decussation point), optic tract, lateral geniculate body, optic radiations, and the primary visual cortex in the occipital lobes. Pathways are color-coded (red and blue) to demonstrate the transition from nasal and temporal retinal fibers to the contralateral and ipsilateral hemispheres. Black lesion bars indicate specific sites of damage along this pathway. Flanking the central diagram are clinical representations of visual field loss patterns. The 'Right' panel displays bilateral defects including bitemporal hemianopia, incongruous homonymous hemianopia, and congruous homonymous hemianopia. The 'Left' panel displays unilateral or localized defects including central scotoma, centrocaecal scotoma, arcuate scotoma, and temporal wedge. This diagram serves as a neuro-ophthalmological guide for localizing lesions within the central nervous system based on perimetry findings.
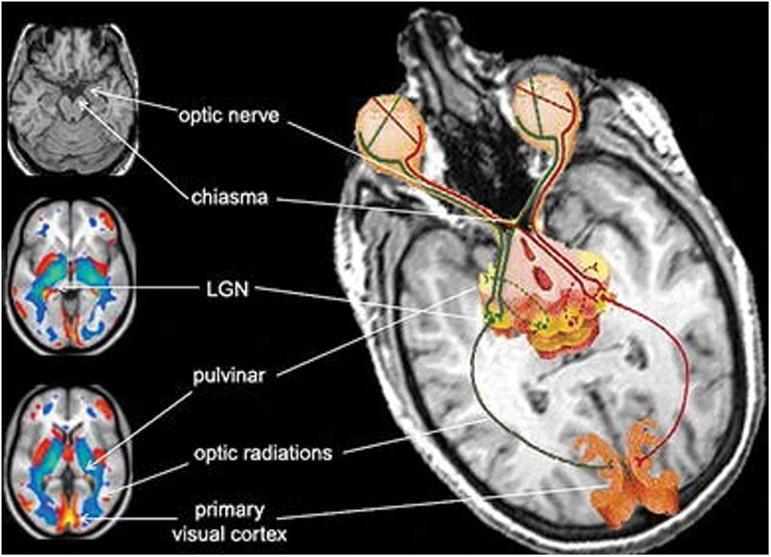
This composite diagnostic and pathophysiology diagram illustrates the anatomical structures and neuroplastic changes of the human visual pathway, specifically focusing on atrophy in congenitally blind individuals. The primary image is a transversal T1-weighted MRI slice with a superimposed schematic of the visual system. Key structures are labeled: the optic nerves originating from the globes, the optic chiasm, the lateral geniculate nucleus (LGN) and pulvinar of the thalamus, the optic radiations (geniculocalcarine tract), and the primary visual cortex in the occipital lobe. Three smaller axial brain scans on the left provide additional context. The top scan is a structural MRI identifying the optic nerve and chiasm. The middle and bottom scans are color-coded statistical parametric maps (likely VBM or PET) showing regional brain volume differences. Blue shading indicates areas of significant gray matter volume reduction (atrophy) in the thalamic relays and visual cortex, while red/yellow highlights show areas of metabolic or structural divergence. This visual is designed for advanced medical education regarding neuroanatomy and the effects of long-term sensory deprivation on the central nervous system.
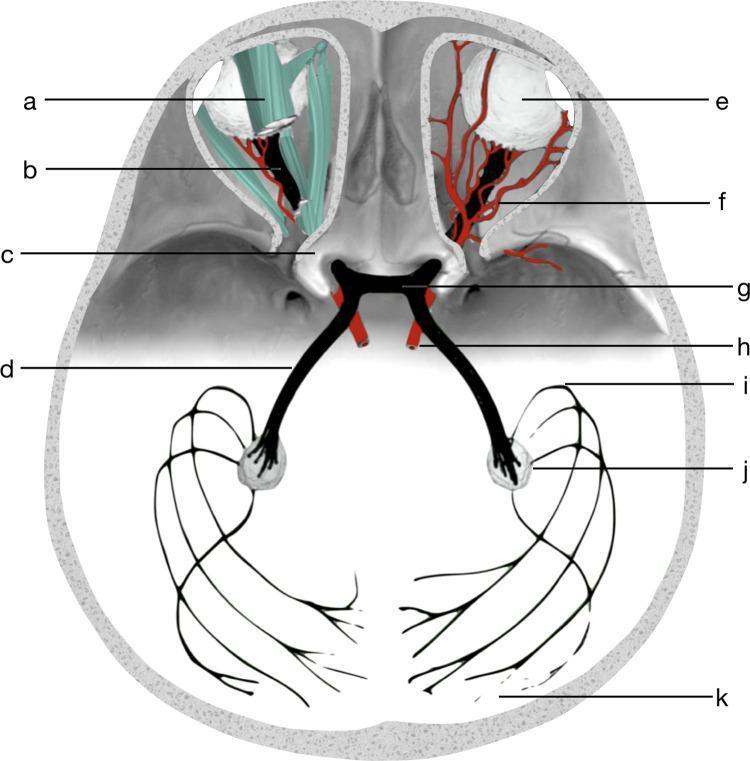
An anatomical diagram illustrating the human visual pathway and its surrounding cranial structures. The schematic highlights the progression from the anterior globes (eyeballs) to the posterior visual cortex. Key structures labeled include the optic nerves (b) extending from the eyeballs, passing through the bony optic canals (c) to converge at the central optic chiasm (g). The diagram demonstrates the decussation of fibers continuing as optic tracts (d) toward the lateral geniculate nuclei (j). The final segment depicts the optic radiation (k), including Meyer’s loop (i), projecting to the primary visual cortex. Surrounding clinical anatomy is integrated, showing the extraocular muscles and tendons (a), orbital blood vessels (f), and the ophthalmic artery (h) in close proximity to the neural structures. This visual summarizes the neuroanatomical relationships essential for understanding visual field defects and imaging diagnostics like CT and MRI tractography.
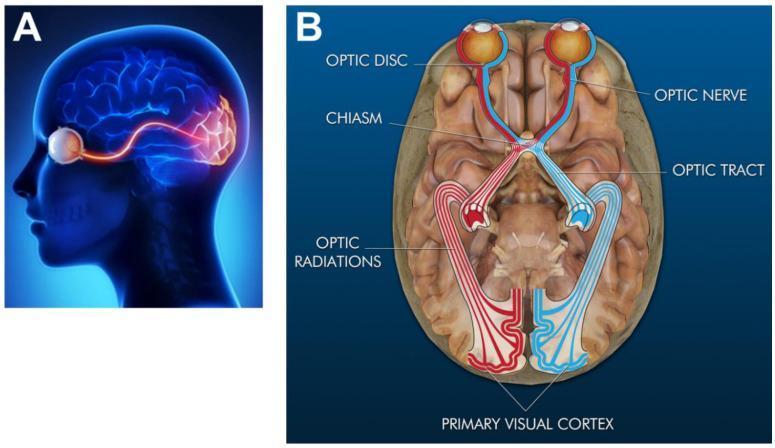
Educational anatomical diagrams illustrating the human visual system pathways across two planes. (A) Sagittal view showing the spatial arrangement of the eye sensing organ, the intracranial optic nerve pathway, and its termination at the primary visual cortex (highlighted in red) in the occipital lobe. (B) Transverse rendering providing a superior view of the visual pathway components overlaid on a brain model. Labeled structures include the eyes, optic discs, optic nerves, the X-shaped optic chiasm, optic tracts, and optic radiations (geniculocalcarine tracts). The diagram uses color-coding (red and blue) to demonstrate the partial decussation of nerve fibers at the optic chiasm, where information from each eye is distributed to both cerebral hemispheres, ultimately reaching the bilateral primary visual cortex. This visual aid is designed for teaching neuroanatomy and the physiological basis of binocular and stereoscopic vision.
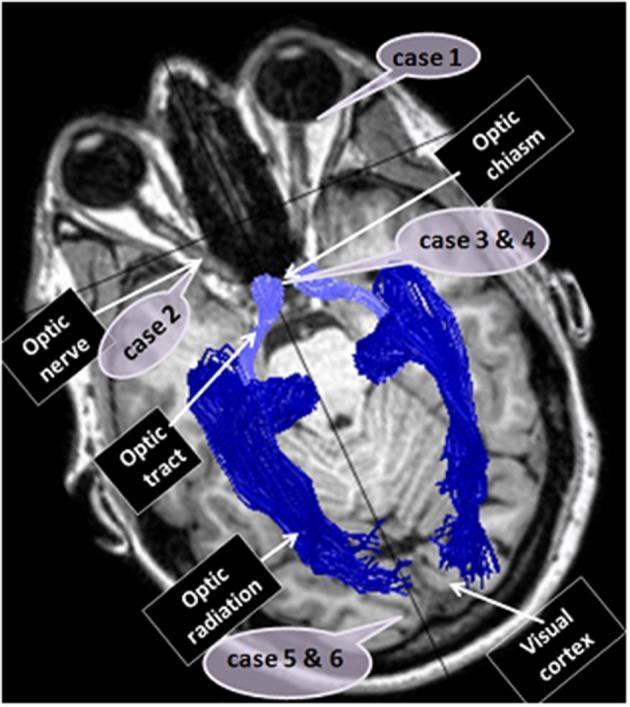
This diagnostic image features an axial T1-weighted Magnetic Resonance Imaging (MRI) scan of the human brain, integrated with blue Diffusion Tensor Imaging (DTI) fiber tractography to visualize the visual pathway. The illustration maps the neuroanatomical trajectory from the orbits to the occipital lobe. Key structures are labeled: the optic nerve (extending from the posterior eye), the optic chiasm (central decussation), the optic tract (posterior to the chiasm), and the optic radiation (projecting to the visual cortex). Additionally, the image serves as a clinical localization map for six case reports, identifying specific sites of dysfunction: Case 1 (eye), Case 2 (optic nerve), Cases 3 and 4 (optic chiasm), and Cases 5 and 6 (visual cortex). This combination of structural MRI and DTI tractography demonstrates the spatial relationship between clinical pathology and white matter pathways, supporting advanced neuro-ophthalmological education and radiological diagnosis.
The Visual Pathway
1. Retina
2. Optic Nerve (CN II)
3. Optic Chiasm
- Axons from the nasal hemiretina of each eye (which see the temporal visual field) cross to the contralateral optic tract.
- Axons from the temporal hemiretina (which see the nasal visual field) stay ipsilateral.
4. Optic Tract
- Temporal retinal fibers from the ipsilateral eye (ipsilateral temporal visual field)
- Nasal retinal fibers from the contralateral eye (contralateral temporal visual field)
5. Lateral Geniculate Nucleus (LGN) of the Thalamus
- Layers 1 & 2: Magnocellular layers - receive input from M-type (parasol) ganglion cells; process motion, depth, coarse form
- Layers 3-6: Parvocellular layers - receive input from P-type (midget) ganglion cells; process fine detail, color, and high spatial frequency
- Interlaminar zones: Koniocellular layers - receive input from bistratified ganglion cells; involved in color processing (blue-yellow)
6. Optic Radiations (Geniculocalcarine Tract)
| Division | Fibers | Path | Visual Field Represented |
|---|---|---|---|
| Upper (parietal) radiations | Superior retinal fibers (inferior visual field) | Pass through parietal lobe | Inferior visual field |
| Lower (temporal) radiations | Inferior retinal fibers (superior visual field) | Loop anteriorly into temporal lobe - Meyer's loop - before heading posteriorly | Superior visual field |
7. Primary Visual Cortex (V1, Striate Cortex)
- Upper radiations terminate on the upper lip of the calcarine fissure (inferior visual field)
- Lower radiations terminate on the lower lip (superior visual field)
- The macula (central vision) has disproportionately large representation at the occipital pole - cortical magnification
- V1 is organized into orientation columns, ocular dominance columns, and color blobs (cytochrome oxidase-rich patches)
8. Higher Visual Processing (Extrastriate Cortex)
| Stream | Path | Function |
|---|---|---|
| Dorsal ("Where/How") stream | V1 → V2 → V5/MT → Parietal cortex | Motion, spatial location, visuomotor guidance |
| Ventral ("What") stream | V1 → V2 → V4 → Inferotemporal cortex | Object recognition, color, face recognition |
Visual Field Defects - Lesion Localization
| Site of Lesion | Visual Field Defect |
|---|---|
| Optic nerve (unilateral) | Monocular blindness (ipsilateral) |
| Optic chiasm (central compression, e.g., pituitary adenoma) | Bitemporal hemianopia |
| Optic tract | Contralateral homonymous hemianopia (incongruous) |
| Meyer's loop (temporal lobe) | Contralateral superior quadrantanopia ("pie in the sky") |
| Parietal optic radiation | Contralateral inferior quadrantanopia |
| Complete optic radiation / V1 (with macular sparing) | Contralateral homonymous hemianopia with macular sparing |
| Occipital pole only | Contralateral homonymous central scotoma |
Key Diagrams
Summary Flow
Photoreceptors (rods/cones)
        ↓
Bipolar cells → Retinal ganglion cells
        ↓
Optic disc → Optic nerve (CN II)
        ↓
Optic chiasm (50% nasal fibers decussate)
        ↓
Optic tract (→ pretectum/superior colliculus for pupil reflex)
        ↓
Lateral Geniculate Nucleus (thalamus)
   [M, P, K channels maintained]
        ↓
Optic radiations
   Upper: parietal lobe
   Lower: Meyer's loop (temporal lobe)
        ↓
Primary Visual Cortex V1 (calcarine fissure, occipital lobe)
        ↓
Extrastriate cortex → Dorsal ("where") & Ventral ("what") streams
Visual pathway diagram
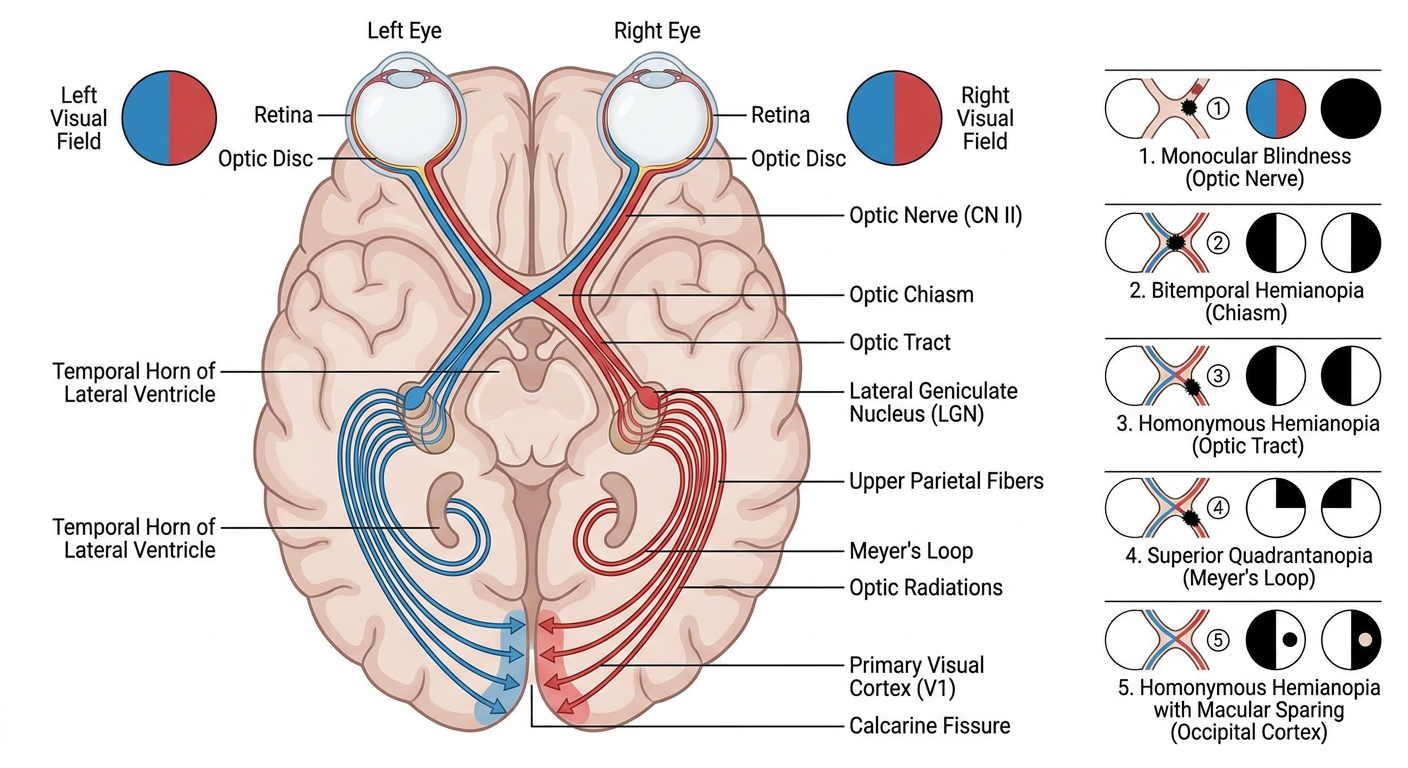
Detailed anatomical diagram of the human visual pathway, showing a superior (top-down) view of the brain. Include and label all major structures in order: two eyes (left and right) with retina, optic disc, optic nerve (CN II) from each eye, optic chiasm (showing partial decussation with nasal fibers crossing and temporal fibers staying ipsilateral), optic tract, lateral geniculate nucleus (LGN) of the thalamus, optic radiations (showing upper parietal fibers and lower Meyer's loop curving around temporal horn of lateral ventricle), and primary visual cortex (V1) at the calcarine fissure in the occipital lobe. Use color-coding: red lines for right visual field information, blue lines for left visual field information. Show visual field circles next to each eye. Include small inset diagrams on the side showing the visual field defects that result from lesions at each numbered point: (1) monocular blindness at optic nerve, (2) bitemporal hemianopia at chiasm, (3) homonymous hemianopia at optic tract, (4) superior quadrantanopia at Meyer's loop, (5) homonymous hemianopia with macular sparing at occipital cortex. Clean medical illustration style, white background, clear annotation lines and labels.
| Structure | Key Feature |
|---|---|
| Retina | Nasal vs. temporal hemiretinas; ganglion cell axons |
| Optic Nerve (CN II) | CNS tract; myelinated by oligodendrocytes |
| Optic Chiasm | 50% nasal fibers cross; temporal fibers stay ipsilateral |
| Optic Tract | Carries info from contralateral hemifield |
| LGN (Thalamus) | 6 layers (M, P, K channels); thalamic relay |
| Meyer's Loop | Inferior radiations curve through temporal lobe |
| Optic Radiations | Upper (parietal) + lower (temporal/Meyer's) divisions |
| V1 - Calcarine Cortex | Lower lip = superior field; upper lip = inferior field |
- Optic nerve - monocular blindness
- Optic chiasm - bitemporal hemianopia
- Optic tract - incongruous homonymous hemianopia
- Meyer's loop - contralateral superior quadrantanopia ("pie in the sky")
- Occipital cortex - homonymous hemianopia with macular sparing