

Take the image as the reference and make the labatorory parameters like that of in image
cd /tmp/workspace/attachments/1ddd8acc-648b-4694-83f3-b61fc721a0a8/ && python3 -c " import pdfplumber with pdfplumber.open('Sandhya .pdf') as pdf: for i, page in enumerate(pdf.pages): print(f'--- PAGE {i+1} ---') print(page.extract_text()) print() "
python3 -c " import pdfplumber with pdfplumber.open('/tmp/workspace/attachments/1ddd8acc-648b-4694-83f3-b61fc721a0a8/Sandhya .pdf') as pdf: print(f'Total pages: {len(pdf.pages)}') for i, page in enumerate(pdf.pages): tables = page.extract_tables() if tables: print(f'Page {i+1} has {len(tables)} tables:') for t in tables: for row in t: print(row) words = page.extract_words() if words: print(f'Page {i+1} words:', words[:20]) "
python3 -c " from pypdf import PdfReader import os reader = PdfReader('/tmp/workspace/attachments/1ddd8acc-648b-4694-83f3-b61fc721a0a8/Sandhya .pdf') print(f'Pages: {len(reader.pages)}') # Check page 5 (likely lab parameters) for page_num in range(min(10, len(reader.pages))): page = reader.pages[page_num] images = page.images print(f'Page {page_num+1}: {len(images)} images') for img in images: print(f' Image: {img.name}, size: {len(img.data)} bytes') "
python3 -c " from pypdf import PdfReader import os os.makedirs('/tmp/workspace/sandhya_pages', exist_ok=True) reader = PdfReader('/tmp/workspace/attachments/1ddd8acc-648b-4694-83f3-b61fc721a0a8/Sandhya .pdf') # Extract images from pages 1-15 to find the lab parameters page for page_num in range(15): page = reader.pages[page_num] images = page.images for img in images: out_path = f'/tmp/workspace/sandhya_pages/page_{page_num+1}.jpg' with open(out_path, 'wb') as f: f.write(img.data) print(f'Saved page {page_num+1}') "
python3 -c " # Host images as base64 data URIs or upload to temp location import base64 import os # Check the image file path = '/tmp/workspace/sandhya_pages/page_5.jpg' size = os.path.getsize(path) print(f'Size: {size}') # Read first few bytes to check format with open(path, 'rb') as f: header = f.read(10) print(f'Header bytes: {header.hex()}') "
python3 -c " from pypdf import PdfReader import os os.makedirs('/tmp/workspace/sandhya_pages', exist_ok=True) reader = PdfReader('/tmp/workspace/attachments/1ddd8acc-648b-4694-83f3-b61fc721a0a8/Sandhya .pdf') # Extract images from pages 10-30 for page_num in range(9, 30): page = reader.pages[page_num] images = page.images for img in images: out_path = f'/tmp/workspace/sandhya_pages/page_{page_num+1}.jpg' with open(out_path, 'wb') as f: f.write(img.data) print('Done extracting pages 10-30') "
- CBC [06-04-26]: Hb: 10.9, WBC: 9,800, Plac: 3,24,000, PCV: 32.4, MCV: 67.7, MCH: 22.8
- CRP: -ve [4.44 mg/dL]
- GRBS: 148 mg/dL
- LFT: Total Bili: 0.4, SGOT: 14, SGPT: 13, S.Globulin: 2.3
- S. Electrolytes: S.Na²⁺: 138, S.K⁺: 3.8, S.Cl⁻: 104
- Hb: 10.9 g/dL (low, normal 12-16)
- PCV: 32.4% (low, normal 40-50%)
- WBC: 9,800 /L (normal 5-10 x 10⁹/L)
- MCV: 67.7 fL (low, normal 80-100)
- MCH: 22.8 Pg (low, normal 27-32)
- Platelets: 3,24,000 (normal 100-400 x 10¹²/L)
- RFT: S.Urea: 26, S.Creat: 0.7
- CRP: -ve [4.44 mg/dL]
- GRBS: 148 mg/dL
- LFT: Total Bili: 0.4, SGOT: 14, SGPT: 13, S.Globulin: 2.3
- S.Na²⁺: 138, S.K⁺: 3.8, S.Cl⁻: 104
mkdir -p /tmp/workspace/sandhya-lab && python3 << 'EOF' from pptx import Presentation from pptx.util import Inches, Pt, Emu from pptx.dml.color import RGBColor from pptx.enum.text import PP_ALIGN from pptx.util import Pt from pptx.oxml.ns import qn from lxml import etree import copy prs = Presentation() prs.slide_width = Inches(13.33) prs.slide_height = Inches(7.5) blank_slide_layout = prs.slide_layouts[6] # blank slide = prs.slides.add_slide(blank_slide_layout) # Background color - white background = slide.background fill = background.fill fill.solid() fill.fore_color.rgb = RGBColor(0xFF, 0xFF, 0xFF) # --- Title "OBJECTIVE" --- from pptx.util import Inches, Pt txBox = slide.shapes.add_textbox(Inches(0.5), Inches(0.2), Inches(12), Pt(30)) tf = txBox.text_frame tf.text = "OBJECTIVE" tf.paragraphs[0].runs[0].font.bold = True tf.paragraphs[0].runs[0].font.size = Pt(24) tf.paragraphs[0].runs[0].font.color.rgb = RGBColor(0, 0, 0) # --- Table data --- # Header + 11 rows matching the reference layout but with Sandhya's values # Abnormal values (outside normal range) shown in red data = [ # (Parameter, Observed Value, Normal Value, is_abnormal) ("Hemoglobin", "10.9 g/dl ↓", "12-16 g/dl", True), ("PCV", "32.4% ↓", "40-50%", True), ("MCV", "67.7 fL ↓", "80-100 fL", True), ("MCH", "22.8 Pg ↓", "27-32 Pg", True), ("WBC", "9,800 /L", "5-10 x 10⁹/L", False), ("Platelet", "3,24,000 /L", "1,50,000-4,00,000 /L", False), ("CRP", "4.44 mg/dL", "< 6 mg/dL", False), ("GRBS", "148 mg/dL", "70-140 mg/dL", True), ("S.Urea", "26 mg/dL", "15-40 mg/dL", False), ("S.Creatinine", "0.7 mg/dL", "0.5-1.1 mg/dL", False), ("S.Na⁺", "138 mEq/L", "136-145 mEq/L", False), ("S.K⁺", "3.8 mEq/L", "3.5-5.0 mEq/L", False), ("S.Cl⁻", "104 mEq/L", "98-106 mEq/L", False), ("Total Bili.", "0.4 mg/dL", "0.2-1.2 mg/dL", False), ("SGOT", "14 U/L", "10-40 U/L", False), ("SGPT", "13 U/L", "7-56 U/L", False), ("S.Globulin", "2.3 g/dL", "2.0-3.5 g/dL", False), ] # Colors matching the reference HEADER_BG = RGBColor(0x1F, 0x47, 0x7A) # dark navy blue HEADER_TEXT = RGBColor(0xFF, 0xFF, 0xFF) # white ROW_EVEN_BG = RGBColor(0xD9, 0xE2, 0xF3) # light blue ROW_ODD_BG = RGBColor(0xFF, 0xFF, 0xFF) # white PARAM_TEXT = RGBColor(0x00, 0x00, 0x00) # black NORMAL_TEXT = RGBColor(0x00, 0x00, 0x00) # black RED_TEXT = RGBColor(0xC0, 0x00, 0x00) # red for abnormal # Table dimensions left = Inches(0.5) top = Inches(0.7) width = Inches(12.3) height = Inches(0.4) rows = len(data) + 1 # +1 for header cols = 3 tbl = slide.shapes.add_table(rows, cols, left, top, width, Inches((rows) * 0.38)).table # Column widths tbl.columns[0].width = Inches(2.8) tbl.columns[1].width = Inches(4.5) tbl.columns[2].width = Inches(5.0) def set_cell(cell, text, bg_color, text_color, bold=False, font_size=14, align=PP_ALIGN.LEFT): cell.fill.solid() cell.fill.fore_color.rgb = bg_color tf = cell.text_frame tf.word_wrap = True para = tf.paragraphs[0] para.alignment = align run = para.runs[0] if para.runs else para.add_run() run.text = text run.font.bold = bold run.font.size = Pt(font_size) run.font.color.rgb = text_color # Header row set_cell(tbl.cell(0,0), "PARAMETER", HEADER_BG, HEADER_TEXT, bold=True, font_size=14) set_cell(tbl.cell(0,1), "OBSERVED VALUE", HEADER_BG, HEADER_TEXT, bold=True, font_size=14) set_cell(tbl.cell(0,2), "NORMAL VALUE", HEADER_BG, HEADER_TEXT, bold=True, font_size=14) # Data rows for i, (param, obs, normal, abnormal) in enumerate(data): row_idx = i + 1 bg = ROW_EVEN_BG if i % 2 == 0 else ROW_ODD_BG obs_color = RED_TEXT if abnormal else PARAM_TEXT set_cell(tbl.cell(row_idx, 0), param, bg, PARAM_TEXT, bold=False, font_size=13) set_cell(tbl.cell(row_idx, 1), obs, bg, obs_color, bold=False, font_size=13) set_cell(tbl.cell(row_idx, 2), normal, bg, NORMAL_TEXT, bold=False, font_size=13) # Add row heights for i in range(rows): for j in range(cols): cell = tbl.cell(i, j) # Add padding tc = cell._tc tcPr = tc.get_or_add_tcPr() out_path = "/tmp/workspace/sandhya-lab/Sandhya_Lab_Parameters.pptx" prs.save(out_path) print(f"Saved: {out_path}") EOF
python3 -c " from pptx import Presentation prs = Presentation('/tmp/workspace/sandhya-lab/Sandhya_Lab_Parameters.pptx') print(f'Slides: {len(prs.slides)}') slide = prs.slides[0] for shape in slide.shapes: if shape.has_text_frame: print('TextBox:', repr(shape.text_frame.text[:60])) if shape.has_table: tbl = shape.table print(f'Table: {len(tbl.rows)} rows x {len(tbl.columns)} cols') for row in tbl.rows: print(' |', ' | '.join(cell.text_frame.text for cell in row.cells), '|') "
Sandhya Lab Parameters
Presentation · PPTX
| Parameter | Observed | Status |
|---|---|---|
| Hemoglobin | 10.9 g/dl | 🔴 Low |
| PCV | 32.4% | 🔴 Low |
| MCV | 67.7 fL | 🔴 Low (microcytic) |
| MCH | 22.8 Pg | 🔴 Low (hypochromic) |
| WBC | 9,800 /L | Normal |
| Platelet | 3,24,000 /L | Normal |
| CRP | 4.44 mg/dL | Normal |
| GRBS | 148 mg/dL | 🔴 High |
| S.Urea, S.Creatinine, Electrolytes, LFT | All within normal range | Normal |
Make a poster comparing Sandhya's values to reference ranges
Medical laboratory results poster for patient Mrs. Sandhiya (47/F). Title: "LABORATORY PARAMETERS - Mrs. Sandhiya" with subtitle "Nandha Medical College and Hospital | Diagnosis: Acute Exacerbation of Bronchial Asthma". A clean, professional medical poster with a navy blue and white color scheme. Contains a large comparison table with three columns: PARAMETER | SANDHIYA'S VALUE | NORMAL RANGE. The table has these rows, with abnormal values highlighted in red/orange: COMPLETE BLOOD COUNT (section header, shaded) Hemoglobin | 10.9 g/dL ↓ (RED) | 12–16 g/dL PCV | 32.4% ↓ (RED) | 40–50% MCV | 67.7 fL ↓ (RED) | 80–100 fL MCH | 22.8 Pg ↓ (RED) | 27–32 Pg WBC | 9,800 /L | 5,000–10,000 /L Platelets | 3,24,000 /L | 1,50,000–4,00,000 /L RENAL FUNCTION (section header, shaded) S. Urea | 26 mg/dL | 15–40 mg/dL S. Creatinine | 0.7 mg/dL | 0.5–1.1 mg/dL LIVER FUNCTION (section header, shaded) Total Bilirubin | 0.4 mg/dL | 0.2–1.2 mg/dL SGOT | 14 U/L | 10–40 U/L SGPT | 13 U/L | 7–56 U/L S. Globulin | 2.3 g/dL | 2.0–3.5 g/dL ELECTROLYTES (section header, shaded) S. Sodium | 138 mEq/L | 136–145 mEq/L S. Potassium | 3.8 mEq/L | 3.5–5.0 mEq/L S. Chloride | 104 mEq/L | 98–106 mEq/L OTHERS (section header, shaded) CRP | 4.44 mg/dL | < 6 mg/dL GRBS | 148 mg/dL ↑ (RED) | 70–140 mg/dL At the bottom, a red-bordered callout box: "KEY FINDING: Microcytic Hypochromic Anemia — Low Hb, PCV, MCV, MCH suggest Iron Deficiency Anemia" Legend at bottom: red dot = Below Normal, orange dot = Above Normal, green dot = Within Normal Range. Clean typography, alternating row shading.
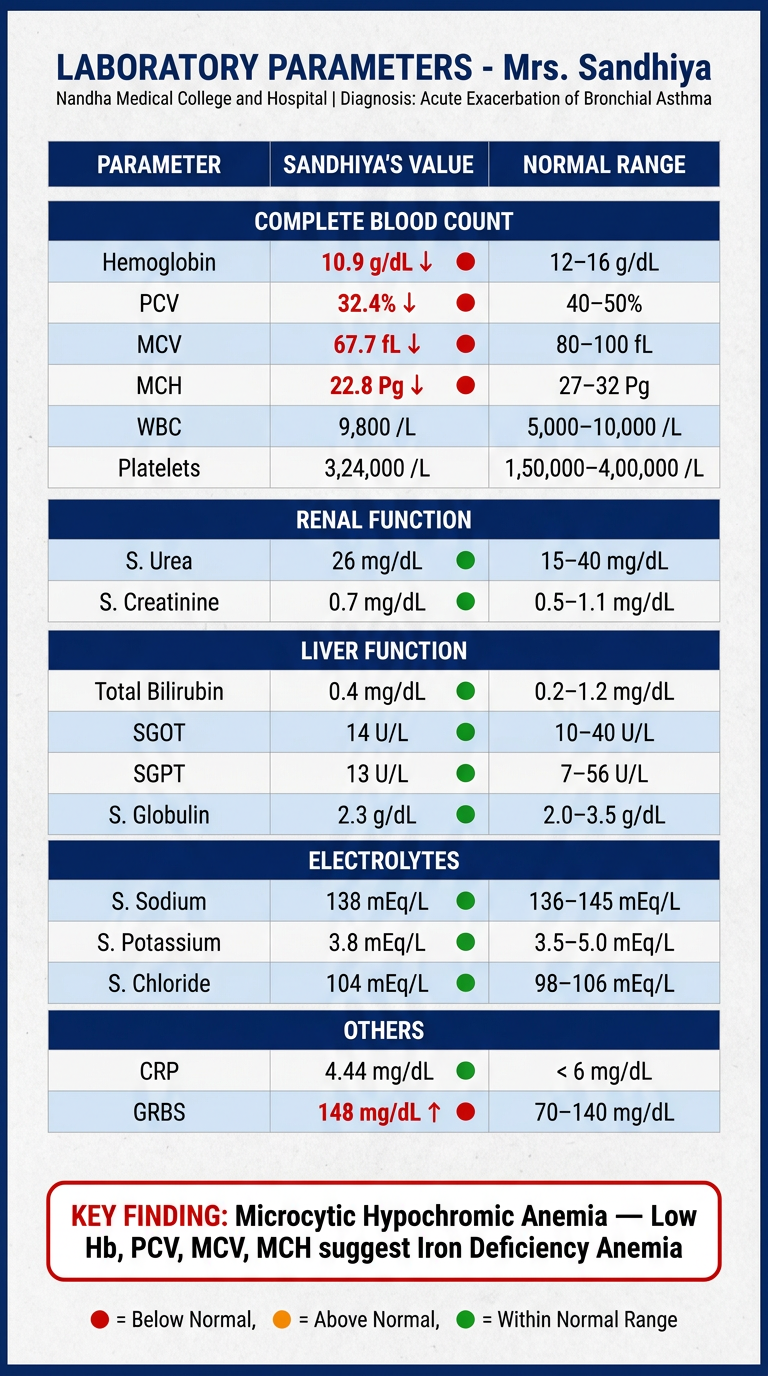
- Hemoglobin 10.9 g/dL, PCV 32.4%, MCV 67.7 fL, MCH 22.8 Pg - all low, pointing to microcytic hypochromic anemia (likely iron deficiency)
- GRBS 148 mg/dL - mildly elevated
- Renal function (Urea, Creatinine), Liver function (Bili, SGOT, SGPT, Globulin), Electrolytes (Na, K, Cl), CRP, WBC, Platelets