
Cardiac cycle
I'll read the medical library skill first, then search for cardiac cycle content.
Reading File
Now let me search the library for cardiac cycle content in parallel:
Finding Sources
Finding Sources
Excellent - I have several great sources. Let me read the most authoritative ones in parallel - Guyton & Hall, Costanzo, and Medical Physiology, plus fetch the diagram images:
Reading File
Reading File
Reading File
Loading Image
I have excellent content. Let me read a bit more from Costanzo (the seven phases table) and the Medical Physiology text on the phases, plus fetch the Morgan & Mikhail diagram:
Reading File
Reading File
Loading Image
I now have rich content from multiple authoritative textbooks and two excellent diagrams. Let me also fetch the Medical Physiology (Boulpaep/Boron) cardiac cycle diagram for completeness:
Loading Image
Reading File
I now have comprehensive content from four major physiology textbooks plus three excellent Wiggers-style diagrams. Here is the full, synthesized answer:
The Cardiac Cycle
The cardiac cycle is the sequence of mechanical and electrical events that repeats with every heartbeat - from the beginning of one beat to the beginning of the next. At a normal resting heart rate of 72-75 beats/min, each cycle lasts ~0.8 seconds (duration = 60/heart rate). - Guyton & Hall Textbook of Medical Physiology; Medical Physiology (Boron & Boulpaep)
The Wiggers Diagram (Classic Reference)
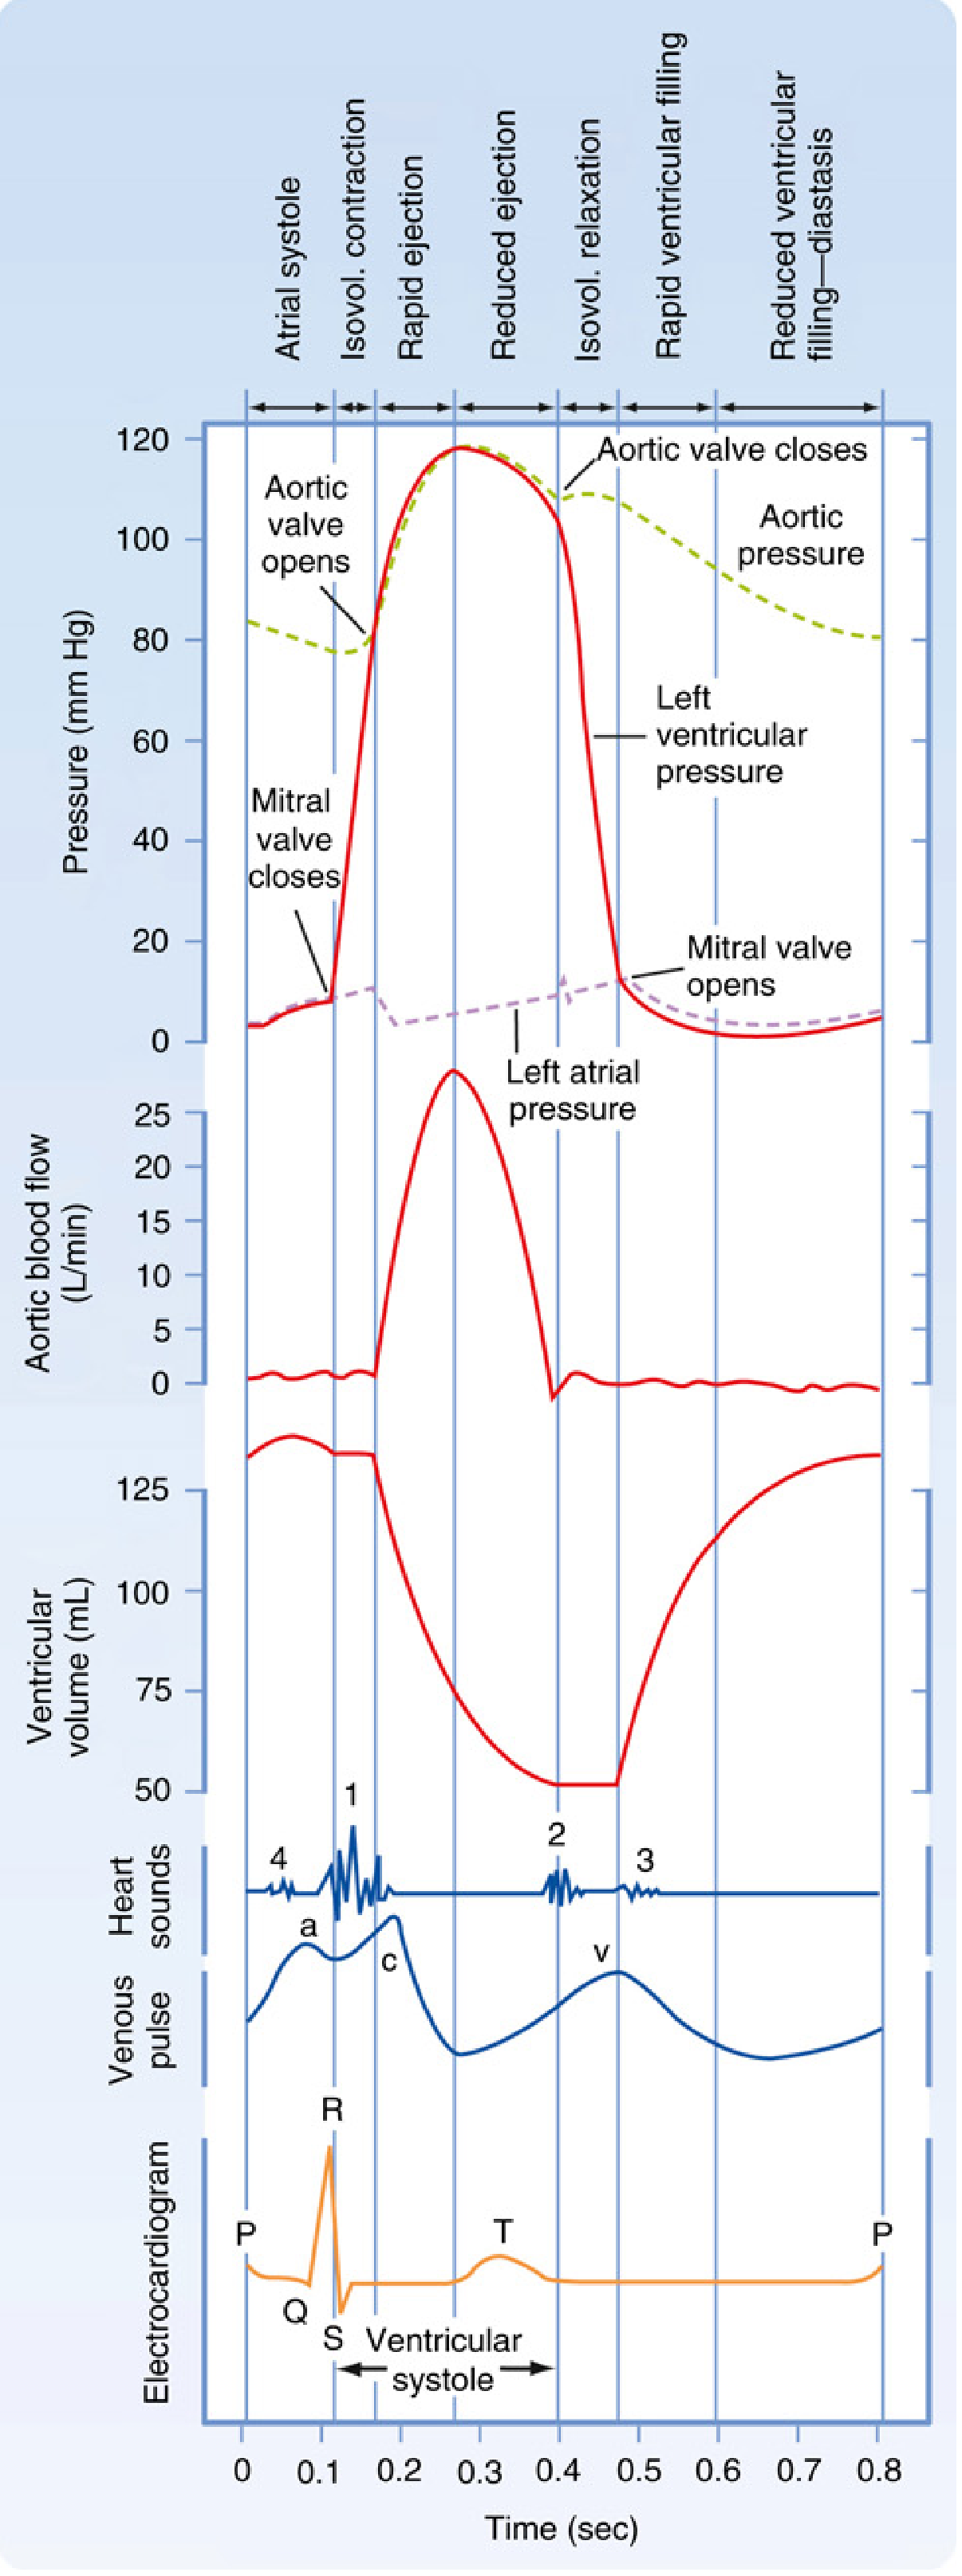
This is the standard graphical representation of the cardiac cycle, showing pressure, volume, ECG, heart sounds, and venous pulse simultaneously:
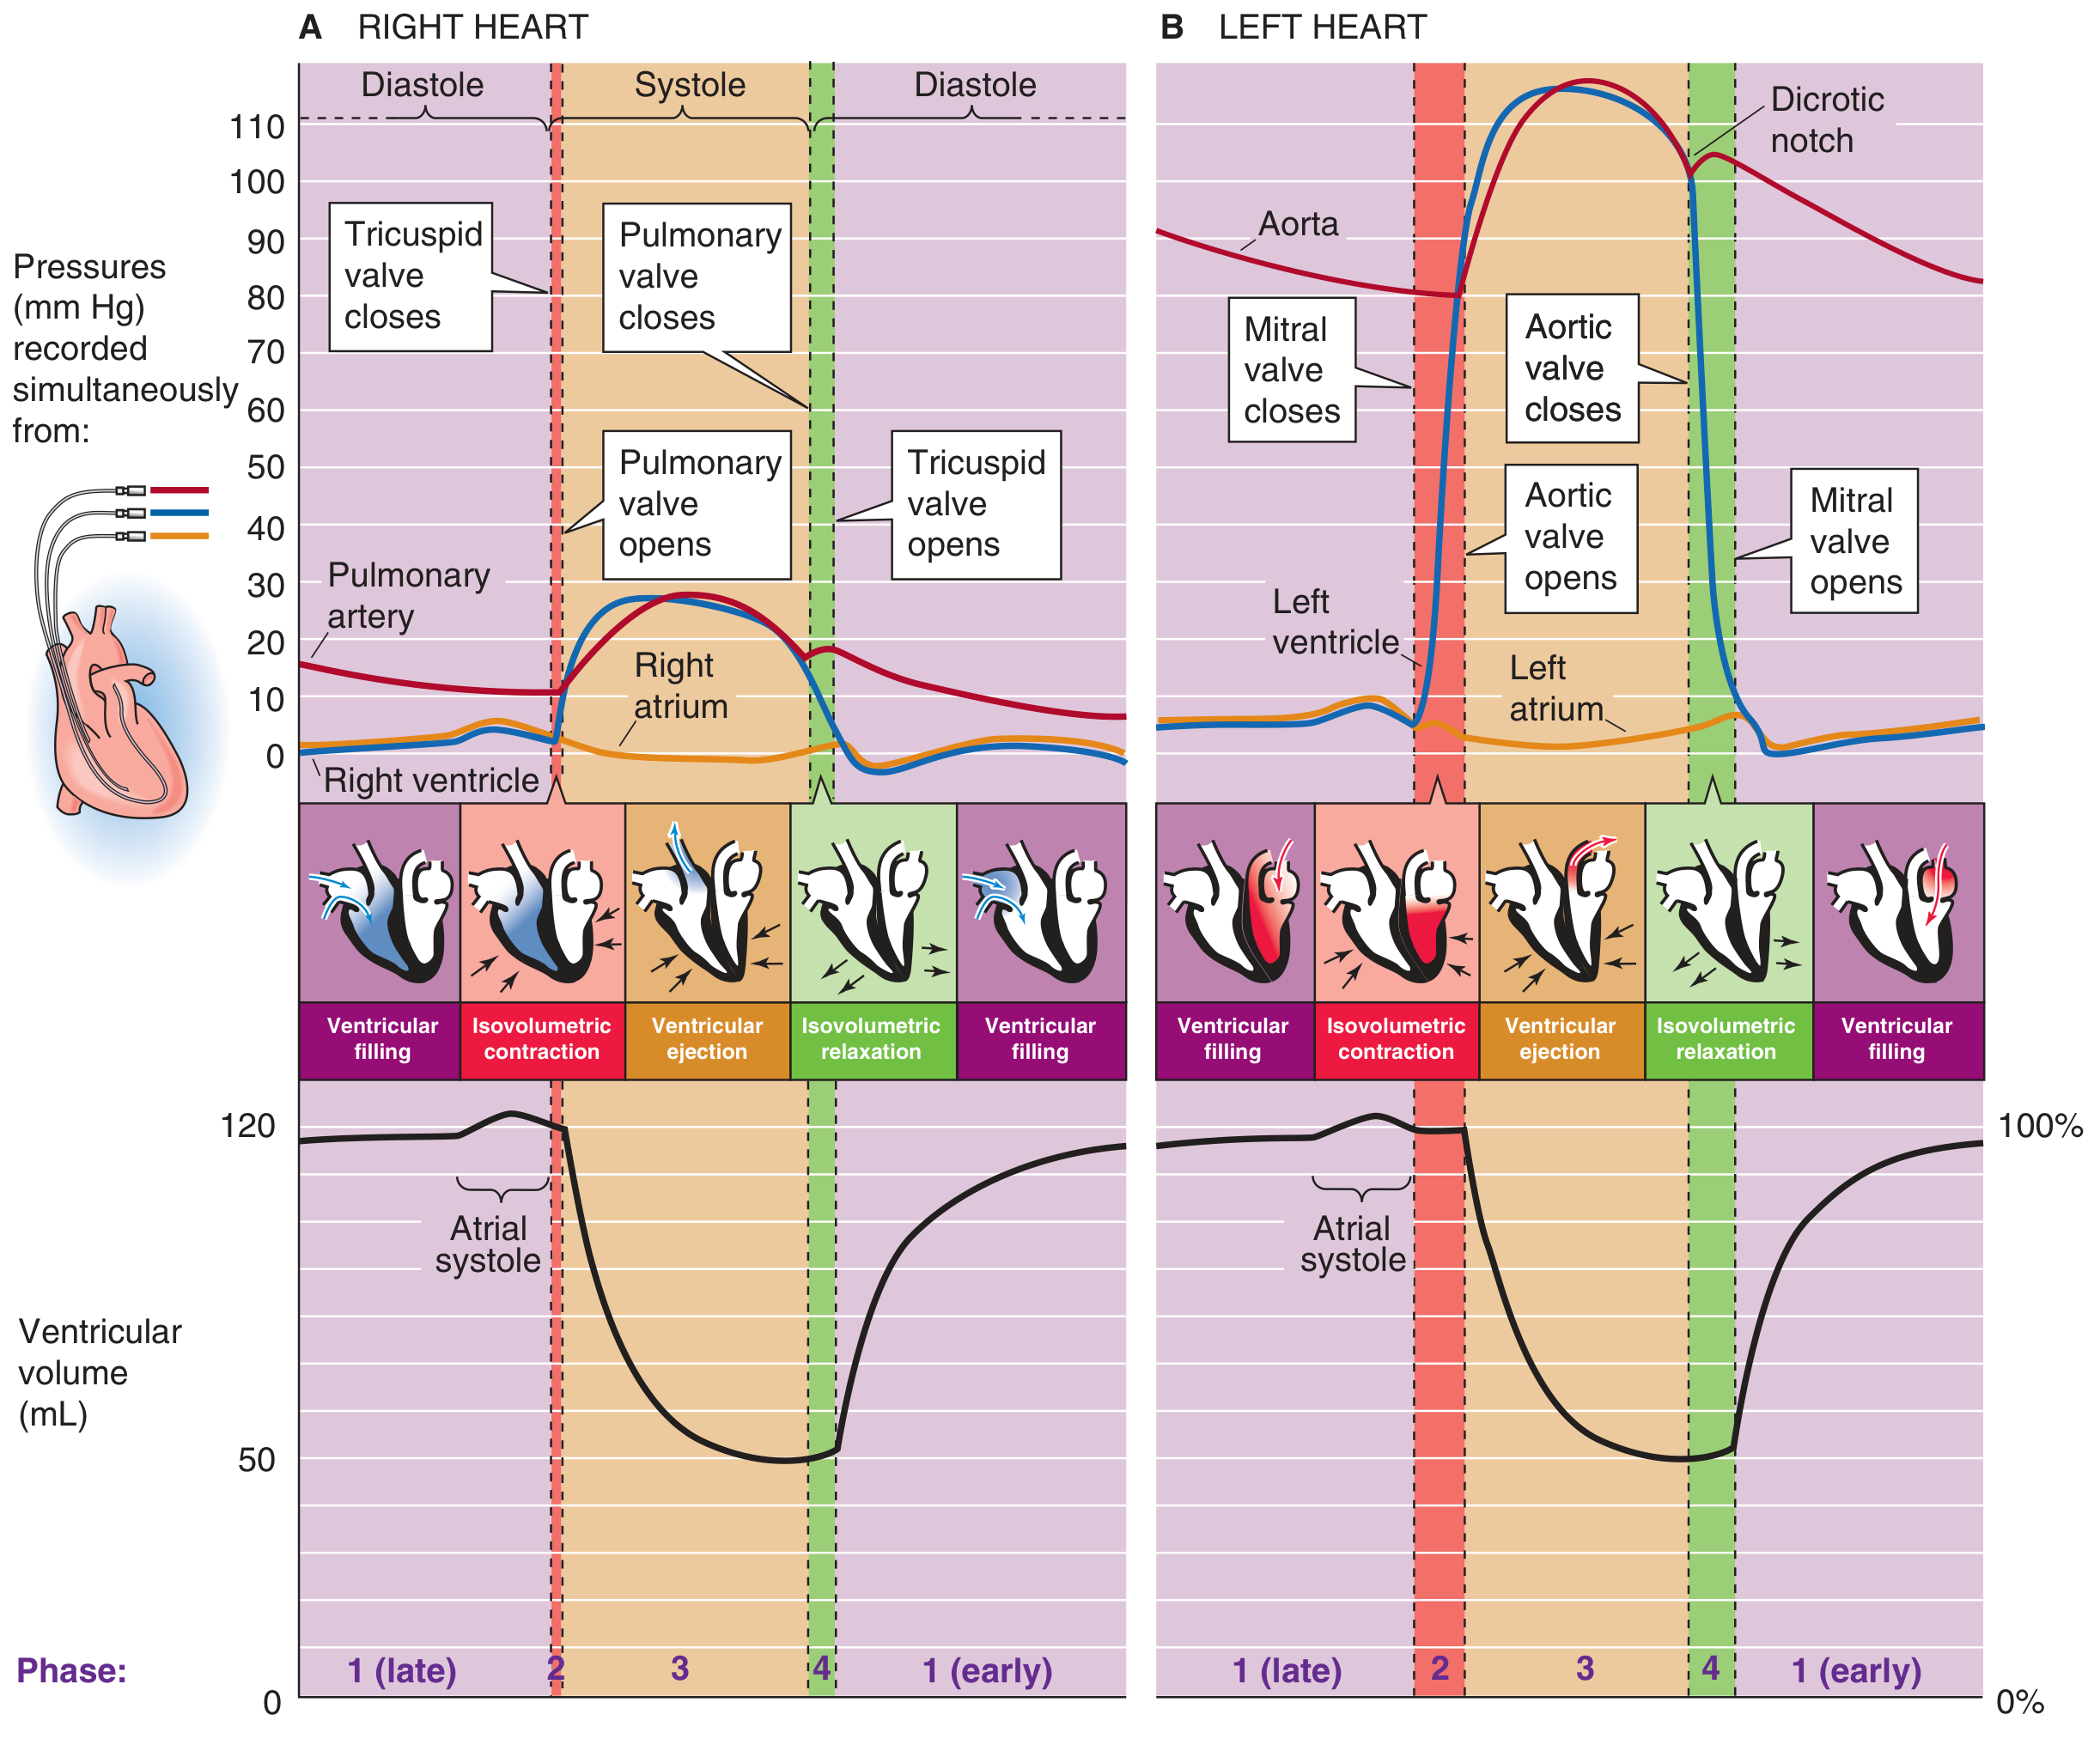
Right Heart and Left Heart Compared
Both sides go through the same four core phases, but at very different pressures:
Initiation
Each cycle begins with spontaneous depolarization in the sinoatrial (SA) node (superior-lateral wall of the right atrium). The impulse travels through both atria, then is delayed >0.1 s at the AV node before entering the ventricles via the bundle of His. This delay allows atria to contract first - acting as "primer pumps" - before the ventricles contract. - Guyton & Hall
The Four Core Phases (Ventricular Perspective)
From the ventricle's standpoint, the cycle is defined by whether the inlet (AV) or outlet (semilunar) valves are open or closed:
| Phase | Valves | Key Events |
|---|---|---|
| 1. Ventricular Filling (Diastole) | AV open, Semilunar closed | Passive filling + atrial systole at end |
| 2. Isovolumetric Contraction (Systole) | All closed | Pressure rises sharply, no volume change |
| 3. Ventricular Ejection (Systole) | Semilunar open, AV closed | Blood ejected into aorta/pulmonary artery |
| 4. Isovolumetric Relaxation (Diastole) | All closed | Pressure falls, no volume change |
- Medical Physiology (Boron & Boulpaep)
At 75 beats/min: systole ~300 ms, diastole ~500 ms. As heart rate rises, diastole shortens proportionally more than systole.
The Seven Phases in Detail (Costanzo)
Costanzo Physiology further subdivides the cycle into seven phases:
A - Atrial Systole
- ECG: P wave (atrial depolarization)
- Atria contract, increasing left atrial pressure
- Mitral valve is already open; active blood ejection from atrium to ventricle
- Causes a "blip" rise in left ventricular pressure
- Venous pulse: a wave
- Heart sound: S4 (not normally audible; heard in ventricular hypertrophy)
B - Isovolumetric Ventricular Contraction
- ECG: QRS complex (ventricular depolarization)
- Ventricles begin contracting; LV pressure rises rapidly
- Mitral valve closes (LV pressure > LA pressure)
- All valves closed - volume is constant (~120-130 mL = end-diastolic volume, EDV)
- Heart sound: S1 (closure of mitral and tricuspid valves)
- Venous pulse: c wave (slight bulging of mitral valve into atrium)
C - Rapid Ventricular Ejection
- ECG: ST segment
- LV pressure exceeds aortic pressure (~80 mmHg) → aortic valve opens
- LV pressure rises to peak (~120 mmHg)
- Ventricular volume falls rapidly (~70 mL ejected)
- Aortic pressure rises to ~120 mmHg
- No heart sound during ejection
D - Reduced Ventricular Ejection
- ECG: T wave (ventricular repolarization)
- Ejection slows; ventricular and aortic pressures begin to fall
- Ventricular volume reaches minimum (~50 mL = end-systolic volume, ESV)
- The 70 mL ejected = stroke volume; ejection fraction (EF) = SV/EDV ≈ 60%
E - Isovolumetric Ventricular Relaxation
- ECG: after T wave (electrical diastole)
- Ventricles relax; LV pressure falls below aortic pressure
- Aortic valve closes (retrograde flow initiates closure)
- All valves closed again - volume is constant
- Heart sound: S2 (closure of aortic and pulmonic valves)
- A small notch in aortic pressure tracing = dicrotic notch (incisura)
F - Rapid Ventricular Filling
- LV pressure falls below LA pressure → mitral valve opens
- Blood rushes passively into ventricle; volume rises rapidly
- Venous pulse: v wave (venous pressure that built during systole now releases)
- Heart sound: S3 (not normally audible; heard in heart failure/volume overload)
G - Reduced Ventricular Filling (Diastasis)
- Slow continued filling; pressures in LA and LV equilibrate
- Cycle then repeats with the next P wave
- Costanzo Physiology 7th Edition
Pressure Values Summary (Left Heart)
| Parameter | Value |
|---|---|
| Left atrial pressure (mean) | ~5-10 mmHg |
| LV end-diastolic pressure | ~8-12 mmHg |
| LV peak systolic pressure | ~120 mmHg |
| Aortic systolic pressure | ~120 mmHg |
| Aortic diastolic pressure | ~80 mmHg |
| Aortic valve opens when | LV pressure exceeds ~80 mmHg |
| Mitral valve opens when | LV pressure falls below LA pressure |
Heart Sounds and Their Timing
| Sound | Cause | Timing |
|---|---|---|
| S1 ("lub") | Closure of mitral + tricuspid valves | Start of isovolumetric contraction |
| S2 ("dub") | Closure of aortic + pulmonic valves | Start of isovolumetric relaxation |
| S3 | Rapid ventricular filling (vibration of walls) | Early diastole (pathological in adults >40) |
| S4 | Atrial contraction into stiff ventricle | Late diastole (heard in LVH, aortic stenosis) |
Venous Pulse Waves
The jugular venous pulse (JVP) reflects events transmitted retrogradely:
| Wave | Cause |
|---|---|
| a wave | Atrial contraction |
| c wave | Tricuspid valve bulging + carotid artery pulsation |
| v wave | Venous filling while tricuspid is closed during systole |
| x descent | Atrial relaxation + descent of the base |
| y descent | Tricuspid valve opens, blood flows into RV |
Effect of Heart Rate on Cycle Duration
At normal heart rate (72 bpm): systole ~40% of cycle, diastole ~60%. When heart rate triples, systole occupies ~65% of the cycle. At very high heart rates, diastole becomes so short that ventricular filling is incomplete - this is why tachyarrhythmias reduce cardiac output. - Guyton & Hall
Key Volumes and Calculations
- End-Diastolic Volume (EDV): ~120-130 mL
- End-Systolic Volume (ESV): ~50-60 mL
- Stroke Volume (SV): EDV - ESV = ~70 mL
- Ejection Fraction (EF): SV/EDV = 70/120 = ~58% (normal >55%)
- Cardiac Output (CO): SV × HR = 70 × 72 ≈ 5 L/min
Sources:
- Guyton and Hall Textbook of Medical Physiology (Systole and Diastole, Cardiac Cycle chapter)
- Costanzo Physiology, 7th Edition (Seven phases, Table 4.5)
- Medical Physiology - Boron & Boulpaep (Four-phase model, Table 22-1)
- Morgan & Mikhail's Clinical Anesthesiology, 7e (Wiggers diagram)
This is a shared conversation. Sign in to Orris to start your own chat.