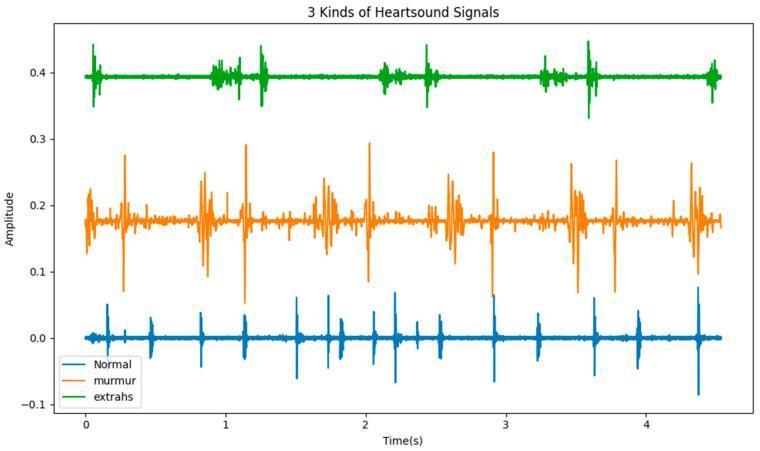
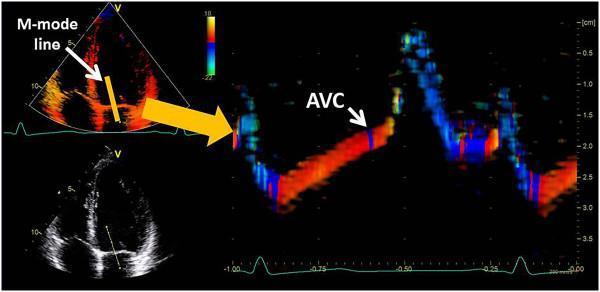
Now I have everything I need. Let me compile the comprehensive HKMLE study note.
🫀 HKMLE Module 1D: Valvular + Pericardial + Cardiomyopathies + Infective Endocarditis
Complete ACE-Level Study Note — Paper 1 & 2 Ready
📌 QUICK SUMMARY BOX
| Condition | Murmur | Classic Sign | #1 Cause (HK) | Key Investigation |
|---|
| Aortic Stenosis (AS) | ESM (ejection systolic), radiates to neck | Slow-rising pulse, narrow PP | Calcific (elderly), Bicuspid (young) | Echo: AVA <1.0 cm², gradient ≥40 mmHg |
| Aortic Regurgitation (AR) | Early diastolic, left sternal edge | Collapsing pulse, wide PP | Rheumatic / Bicuspid | Echo: regurgitant fraction, LV size |
| Mitral Stenosis (MS) | Mid-diastolic with opening snap | Tapping apex, malar flush | Rheumatic (>90% in HK/Asia) | Echo: MVA <1.5 cm², PHT |
| Mitral Regurgitation (MR) | Pansystolic, apex → axilla | Displaced apex | Myxomatous/Rheumatic/Ischaemic | Echo: regurgitant volume, LA/LV dilation |
| Infective Endocarditis (IE) | New/changed murmur | Fever + embolic signs | S. viridans (community), S. aureus (IVDU/hospital) | Echo + Blood cultures x3 (Duke criteria) |
PART 1: AORTIC STENOSIS (AS)
Definition
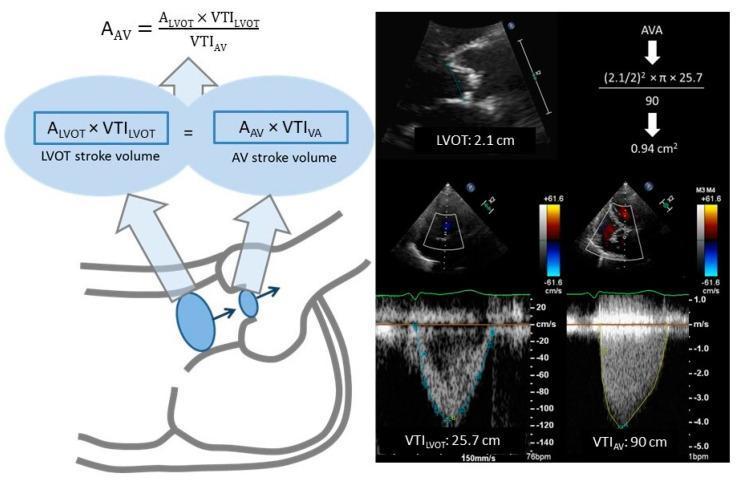
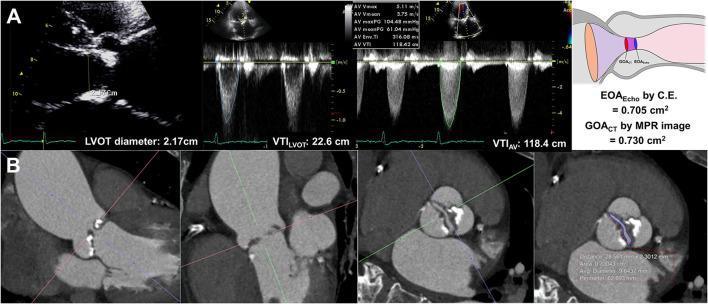
Obstruction to left ventricular outflow at the level of the aortic valve. Severe AS = aortic valve area (AVA) <1.0 cm² (or <0.6 cm²/m² BSA), mean gradient ≥40 mmHg, peak velocity ≥4 m/s.
Classification
| Type | Age at Presentation | Notes |
|---|
| Congenital bicuspid AV | 40-60 years | Most common congenital cardiac defect (1-2% population); accelerated calcification |
| Calcific/degenerative | >65 years | Most common overall cause in HK elderly; risk factors mirror atherosclerosis |
| Rheumatic | Variable (younger) | Commissural fusion; often co-exists with MS; more common in Asia |
| Subvalvular (HOCM) | Any age | Dynamic obstruction, not true AS |
| Supravalvular | Childhood | Williams syndrome |
Aetiology Mnemonic
"BRAC" - Bicuspid (congenital), Rheumatic, Atherosclerotic/calcific, Congenital (other)
Pathophysiology (Step-by-Step)
- Obstruction → Increased afterload on LV
- Concentric LV hypertrophy (LVH) - wall thickens to maintain wall stress (Laplace's Law: stress = Pr/2h)
- Diastolic dysfunction - stiff, non-compliant LV → elevated LVEDP → pulmonary congestion
- Supply-demand mismatch → subendocardial ischaemia → ANGINA (even with normal coronaries)
- Fixed cardiac output → exertional syncope (inadequate cerebral perfusion)
- Eventual LV decompensation → dilated hypokinetic LV → DYSPNOEA / heart failure
- Critical stage: Baroreceptors signal vasodilation; fixed low CO cannot compensate → syncope
Symptoms Mnemonic: "SAD" (classic triad, onset = BAD prognosis)
| Symptom | Mean Survival After Onset |
|---|
| Syncope | 3 years |
| Angina | 5 years |
| Dyspnoea (heart failure) | 1-2 years |
⚠️ HKMLE TRAP: Elderly/sedentary patients in HK may NOT volunteer exertional symptoms — they just limit their activity. The exam scenario often gives a frail elderly with "reduced exercise tolerance" that turns out to be severe AS. Do NOT miss it.
Signs
| Sign | Mechanism |
|---|
| Slow-rising (anacrotic) carotid pulse | Reduced LV ejection rate through stenotic valve |
| Narrow pulse pressure | Reduced stroke volume |
| Heaving (sustained) apex | Concentric LVH |
| Ejection systolic click (bicuspid only) | Doming of pliable bicuspid leaflets; disappears with calcification |
| Harsh ESM at right upper sternal edge | Radiates to carotids |
| Late-peaking murmur | More severe AS = later peak |
| Soft/absent A2 | Calcified immobile valve |
| Paradoxical splitting of S2 (severe AS) | Delayed LV ejection → A2 occurs after P2 |
| S4 gallop | Non-compliant LV |
⚠️ HKMLE TRAP: In elderly patients, the carotid upstroke may not be delayed because of large-artery stiffening. Do NOT rely on pulse character alone in geriatric AS - this is explicitly highlighted in Braunwald's.
Signs mnemonic: "SNAILS" - Slow-rising pulse, Narrow pulse pressure, Aortic ESM, Immobile soft A2, Late peaking murmur, Sustained apex
Investigations
Algorithm: Bedside → Labs → Imaging
Bedside:
- Auscultation: harsh ESM at RUSE, radiates to carotids
- ECG: LVH (Sokolow-Lyon criteria: SV1+RV5>35mm), LBBB (late), AF (late)
Labs:
- BNP/NT-proBNP (elevated in symptomatic AS; useful for risk stratification)
- FBC, renal, LFTs (pre-operative assessment)
- Coagulation screen (pre-procedure)
Imaging:
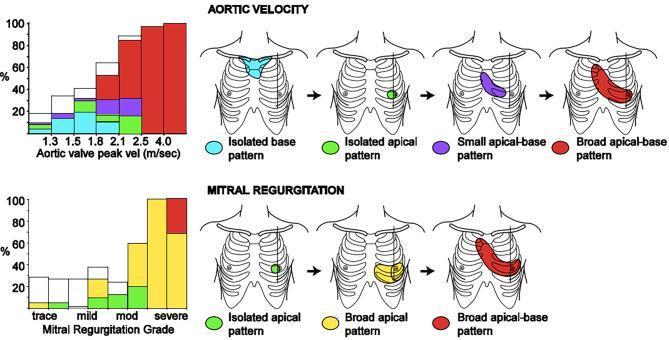
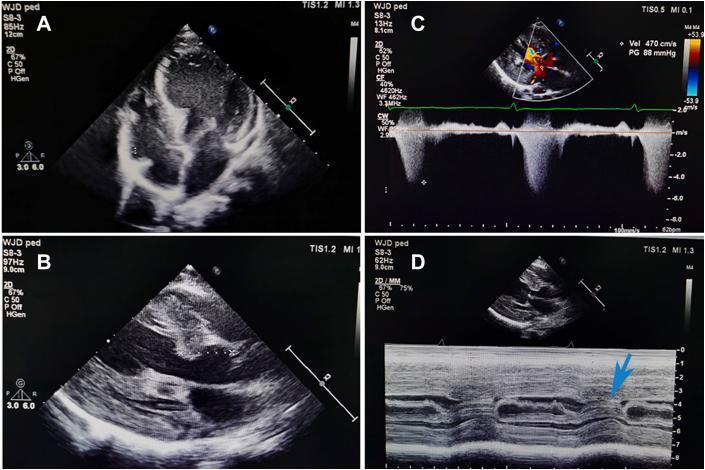
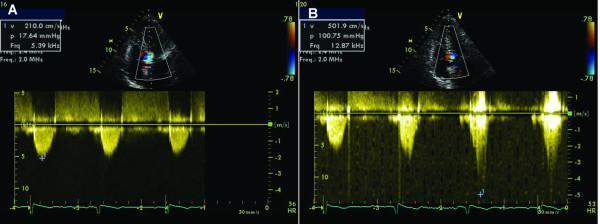
- Echo (TTE) - KEY: AVA by continuity equation, mean gradient, peak velocity, LV function, degree of calcification
- CXR: calcified aortic knuckle, post-stenotic dilatation of ascending aorta, cardiomegaly (late)
- Coronary angiography: pre-op assessment (most AS patients >40 years in HK have concurrent CAD)
- CMR: when echo is inconclusive, LV fibrosis assessment
- Dobutamine stress echo: for low-flow, low-gradient AS (LVEF <50%) — distinguish truly severe AS from pseudo-severe AS
📋 INVESTIGATION INTERPRETATION BOX
Classic Echo in Severe AS: AVA = 0.7 cm², mean gradient = 52 mmHg, peak velocity = 4.6 m/s, LVEF = 55%
Interpretation: Severe high-gradient AS with preserved LV function - symptomatic patient should proceed to AVR/TAVI.
Management
Acute Decompensated AS (Emergency Verbal Orders)
1. "IV access x2, O2 to maintain SpO2 >94%, continuous cardiac monitoring"
2. "12-lead ECG and urgent bedside echo"
3. "Cautious IV diuretics (e.g., furosemide 20-40mg IV) if pulmonary oedema — CAREFUL: DO NOT over-diurese"
4. "Avoid vasodilators (GTN, hydralazine) — can precipitate catastrophic hypotension"
5. "Avoid inotropes unless refractory shock"
6. "Urgent cardiothoracic surgery referral for emergent AVR vs. TAVI"
7. "Intra-aortic balloon pump (IABP) as bridge to definitive therapy if haemodynamically unstable"
⚠️ HKMLE TRAP: Nitrates and aggressive diuresis are DANGEROUS in AS. The LV needs adequate preload to maintain forward flow. The question may give a patient with "AS + pulmonary oedema" - don't reach for GTN.
Chronic Medical Management (Symptomatic Relief Only - NOT Disease-Modifying)
- No medications slow progression of AS (statins were tried in SEAS trial - no benefit)
- Treat comorbidities: hypertension (ACEI/ARB cautiously - can reduce afterload), AF (rate control + anticoagulation)
- Endocarditis prophylaxis: No longer routine (ACC/AHA 2007 revision) - EXCEPT prosthetic valves
- Regular 6-12 monthly echo surveillance if asymptomatic severe AS
Surgical/Interventional Indications (ACC/AHA 2021 / ESC 2021)
| Indication | Class |
|---|
| Symptomatic severe AS (any SAD symptom) | Class I (must intervene) |
| Severe AS undergoing other cardiac surgery | Class I |
| Asymptomatic severe AS with LVEF <50% | Class I |
| Asymptomatic severe AS - very severe (gradient ≥60, velocity ≥5m/s) | Class IIa |
| Asymptomatic severe AS - exercise test positive | Class IIa |
TAVI vs SAVR
| Feature | TAVI | SAVR |
|---|
| Approach | Transcatheter (transfemoral, transapical, transaortic) | Open sternotomy |
| Risk score | High/Intermediate/Low (now evidence for all risk groups) | Preferred in low-risk young patients |
| Prosthetic valve durability | Shorter (concerns in young patients) | Longer |
| Paravalvular leak | Higher risk | Lower risk |
| Permanent pacemaker | Higher (7-15%) | Lower |
| Stroke | Similar (decreasing with newer devices) | Similar |
| Recovery | Faster | Slower |
| HK context | Available at major HK cardiac centres | Standard of care for surgical candidates |
Key Trials:
- PARTNER 1 (inoperable): TAVI 30% vs medical 50% mortality at 1 year - TAVI superior
- PARTNER 2 (intermediate risk): TAVI non-inferior to SAVR
- PARTNER 3 (low risk): TAVI superior to SAVR at 1 year (8.5% vs 15.1% composite endpoint)
- NOTION trial: TAVI vs SAVR in low-risk — comparable outcomes
🏢 HA CLINICAL PATHWAY: In HK public hospitals (QMH, PWH, TMH), TAVI is available for high and intermediate surgical risk patients through a multidisciplinary Heart Team decision. Low-risk patients <75 years typically discussed for SAVR given durability concerns. The Heart Team consists of interventional cardiologist, cardiac surgeon, cardiac anaesthetist, and cardiac imaging specialist.
Complications Mnemonic: "CASH-SB"
- Congestive heart failure
- Arrhythmia (AF, VT, heart block)
- Syncope / sudden cardiac death
- Haemolysis (with prosthetic valves)
- Stroke / systemic embolism
- Bacterial endocarditis
Prognosis
- Asymptomatic severe AS: ~1% annual mortality; symptoms onset = dramatically worsened prognosis
- Post-AVR/TAVI: excellent outcomes, comparable to age-matched population if intervened before LV dysfunction
PART 2: AORTIC REGURGITATION (AR)
Definition
Retrograde flow of blood from the aorta into the LV during diastole due to incompetent aortic valve leaflets or abnormal aortic root.
Classification
| Type | Mechanism |
|---|
| Acute AR | Sudden valve incompetence → rapid LV volume overload |
| Chronic AR | Gradual → LV compensates via eccentric hypertrophy |
Aetiology Mnemonic: "MARRED"
- Marfan syndrome (root dilatation)
- Aortic dissection (acute AR emergency)
- Rheumatic fever (most common cause in Asia/HK)
- Rheumatoid arthritis / AS (ankylosing spondylitis)
- Endocarditis (acute or chronic)
- Dilated aortic root (Ehlers-Danlos, hypertension, syphilis)
Also: Bicuspid aortic valve
Pathophysiology
Chronic AR:
- Regurgitant volume → LV volume overload
- LV dilates (eccentric hypertrophy) to accommodate extra volume
- Increased LV wall stress → Frank-Starling mechanism increases forward SV
- Wide pulse pressure = high SV + low diastolic pressure (aortic runoff)
- Long compensated phase → eventually LV dysfunction → heart failure
Acute AR:
- Sudden regurgitant volume into UNPREPARED (non-dilated) LV
- LVEDP rises dramatically
- Premature mitral valve closure (functional MS)
- Pulmonary oedema + cardiogenic shock
- No time for compensatory changes → emergency surgery needed
Symptoms
- Chronic: exertional dyspnoea, palpitations (hyperkinetic circulation), nocturnal symptoms
- Acute: sudden severe dyspnoea, chest pain (dissection), haemodynamic collapse
Signs Mnemonic: "WIDE PULSE"
- Wide pulse pressure (>60 mmHg)
- Increased carotid pulsations (Corrigan's sign)
- De Musset's sign (head nodding with each beat)
- Early diastolic murmur at left sternal edge (with patient sitting forward, breath held in expiration)
- Pistol shot femorals (Traube's sign)
- Uvula bobbing (Müller's sign)
- Landolfi's sign (pupil alternating dilation/constriction)
- Sustained/displaced apex (volume overloaded LV)
- Edema (late, when HF develops)
Named signs summary:
| Sign | Eponym |
|---|
| Collapsing ("water-hammer") pulse | Corrigan's pulse |
| Head nodding | De Musset's sign |
| Capillary pulsations in nail bed | Quincke's sign |
| Pistol shot sounds over femoral artery | Traube's sign |
| Femoral artery to-fro murmur on compression | Duroziez's sign |
| Pulsatile uvula | Müller's sign |
| Forceful visible carotid pulsations | Corrigan's sign |
Murmur: High-pitched, early diastolic, decrescendo murmur at left sternal edge, heard best with patient sitting forward, breath held in expiration.
Austin Flint Murmur: Mid-diastolic rumble at apex (regurgitant jet hits anterior mitral leaflet, causing functional MS)
⚠️ HKMLE TRAP: Austin Flint murmur sounds like mitral stenosis BUT there is no opening snap and no S1 accentuation. Exam questions love this distinction.
Investigations Algorithm
Bedside: ECG (LVH, LV strain), BP in both arms (dissection exclusion)
Labs: FBC, coagulation, BNP (elevated with LV dysfunction), VDRL/RPR (syphilitic AR)
Imaging:
- Echo (TTE): Grade severity (pressure half-time, regurgitant fraction), LV dimensions (key for surgical timing)
- CXR: cardiomegaly, dilated aorta
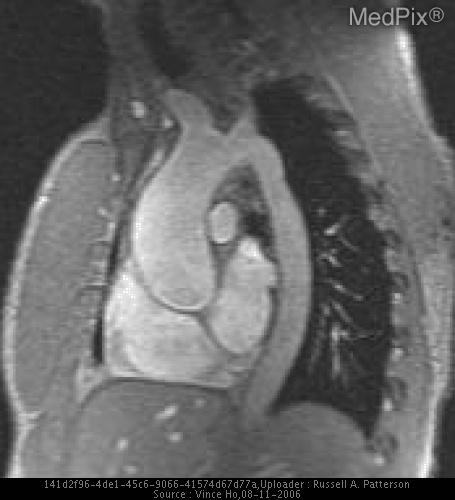
- CT/MRI aorta: if aortic root/dissection concern (especially Marfan's)
- Cardiac catheterisation: coronary angiography pre-op
📋 INVESTIGATION INTERPRETATION BOX
Severe AR on Echo: LV end-systolic diameter (LVESD) = 55mm, PHT = 180ms (short = more severe), regurgitant fraction = 60%
Interpretation: Severe AR with dilated LV - even if asymptomatic, meets surgical threshold (LVESD ≥50mm).
Management
Acute AR (Emergency)
1. "IV access, O2, continuous monitoring"
2. "Urgent bedside echo - confirm diagnosis and assess LV function"
3. "Vasodilators (sodium nitroprusside) to reduce afterload and regurgitant fraction"
4. "Inotropes (dobutamine) if cardiogenic shock"
5. "IABP CONTRAINDICATED in AR (increases diastolic pressure = worsens regurgitation)"
6. "Emergent cardiac surgery - aortic valve replacement"
7. "If infective endocarditis: start empirical antibiotics while arranging surgery"
⚠️ HKMLE TRAP: IABP is absolutely contraindicated in AR. It increases aortic diastolic pressure which increases the regurgitant volume. This is a classic Paper 1 MCQ trap.
Chronic AR - Medical
- Vasodilators (ACEI, nifedipine) - reduce afterload, prolong compensated phase
- BP control (target <130/80)
- Serial echo monitoring: every 6-12 months
Surgical Indications (ACC/AHA 2021)
| Indication | Class |
|---|
| Symptomatic severe AR | Class I |
| Asymptomatic severe AR + LVEF <50% | Class I |
| Asymptomatic severe AR + LVESD ≥50mm | Class I |
| Asymptomatic severe AR + LVEDD ≥65mm (in selected patients) | Class IIb |
| Severe AR undergoing other cardiac surgery | Class I |
⚠️ HKMLE TRAP: Surgery is indicated for LV dilation EVEN BEFORE symptoms develop. The cut-off is LVESD ≥50mm (not 55mm). This is a Paper 2 SAQ classic.
Complications: "FLASH"
- Failure (LV, congestive)
- LV dilatation (irreversible)
- Aortic dissection (in root disease)
- Syncope/Sudden death
- Heart block (from aortic root abscess in IE)
PART 3: MITRAL STENOSIS (MS)
Definition
Obstruction to blood flow from left atrium to left ventricle across the mitral valve. Normal MVA = 4-6 cm². Severe MS = MVA <1.5 cm² (critical <1.0 cm²).
Aetiology
#1 cause: RHEUMATIC FEVER (accounts for >90% of MS in Asia/HK)
Other causes (rare): calcific/degenerative, congenital, carcinoid syndrome, SLE (Libman-Sacks), mucopolysaccharidoses
🌏 LOCAL EPIDEMIOLOGY VARIANT: Rheumatic MS remains prevalent in Hong Kong and throughout Asia, particularly in patients who migrated from mainland China, Southeast Asia, or South Asia. In younger HK patients with MS, rheumatic cause is overwhelmingly likely. Degenerative MS (mitral annular calcification) is seen in elderly HK patients.
Pathophysiology
- Repeated rheumatic carditis → commissural fusion + leaflet thickening + subvalvular fibrosis
- Progressive narrowing of MVA over 10-20 years
- LA pressure rises (pressure gradient across mitral valve) → LA dilatation
- Elevated pulmonary venous pressure → pulmonary congestion → dyspnoea
- Pulmonary arterial hypertension (reactive) → RV pressure overload → RV failure
- LA dilatation → AF (most important complication - triggers acute decompensation)
- LA stasis + AF → thrombus in LA appendage → systemic embolism/stroke
Risk Factors
- Prior acute rheumatic fever (Group A Streptococcal pharyngitis)
- Age of first rheumatic fever (younger = more damage)
- Number of rheumatic attacks
- Female sex (more commonly affected 2:1)
- Asian origin
Symptoms Mnemonic: "DHOAF"
- Dyspnoea (on exertion first, then at rest)
- Haemoptysis (pulmonary hypertension → alveolar haemorrhage, or Ortner's syndrome)
- Ortner's syndrome (hoarseness from recurrent laryngeal nerve compression by dilated LA/pulmonary artery)
- Atrial fibrillation symptoms (palpitations, embolic events)
- Fatigue / reduced exercise tolerance
Signs Mnemonic: "MAST-MOM"
- Malar flush (bilateral butterfly flush - peripheral cyanosis due to low CO + cutaneous vasoconstriction)
- AF/irregular rhythm
- Small volume pulse
- Tapping (palpable S1) apex - undisplaced
- Mid-diastolic murmur (rumbling, low-pitched, heard with bell at apex, left lateral position)
- Opening snap (OS) after S2 (pliable fused leaflets opening suddenly)
- Murmur intensifies with pre-systolic accentuation (sinus rhythm only)
Key Auscultatory Features:
- Loud S1 (pliable leaflets forced to close against high pressure gradient)
- Opening snap (OS): closer to S2 = more severe MS (higher LA pressure)
- A2-OS interval: SHORT (<60ms) = SEVERE MS
- Long duration of mid-diastolic murmur = more severe
- Pre-systolic accentuation = sinus rhythm (disappears in AF)
📋 INVESTIGATION INTERPRETATION BOX
Classic Auscultation in Severe MS: Loud S1 → A2 → OS (50ms gap) → prolonged mid-diastolic rumble with presystolic accentuation
Interpretation: Short A2-OS interval (<60ms) indicates severely elevated LA pressure = severe MS. The presystolic accentuation confirms sinus rhythm.
Investigations Algorithm
Bedside:
- ECG: P mitrale (bifid P wave in lead II, broad >120ms) = LA enlargement; AF; RVH (right axis, R>S in V1)
- SpO2 monitoring
Labs:
- BNP/NT-proBNP
- Coagulation (pre-procedure)
- Anti-streptolysin O titre (ASOT) - evidence of prior rheumatic fever
- Throat swab culture (if active pharyngitis)
Imaging:
- Echo (TTE) - ESSENTIAL: MVA by pressure half-time (PHT), planimetry; Wilkins score for balloon valvotomy suitability; LA size; PA pressure; LV function
- TOE: LA appendage thrombus (before valvotomy or cardioversion)
- CXR: LA enlargement (double right heart border, elevated left main bronchus), pulmonary oedema, Kerley B lines, prominent pulmonary arteries
- Cardiac catheterisation: PA pressures if echo discordant with symptoms
Wilkins Score (echocardiographic score for balloon valvotomy suitability):
| Parameter | Score 1-4 each |
|---|
| Leaflet mobility | 1=highly mobile, 4=no motion |
| Leaflet thickening | 1=near normal, 4=severe |
| Subvalvular apparatus | 1=minimal, 4=extensive |
| Calcification | 1=single area, 4=extensive |
Total score ≤8 = favourable for PMBV (Percutaneous Mitral Balloon Valvotomy)
Total score >8 = consider surgical replacement
⚠️ HKMLE TRAP: TOE MUST be done before PMBV to exclude LA appendage thrombus. If thrombus is found, the procedure is contraindicated until anticoagulation is achieved (usually 3-6 months of warfarin, then repeat TOE).
Management
Acute Decompensated MS (e.g., during pregnancy or AF onset)
1. "O2, continuous monitoring, IV access"
2. "Rate control: IV metoprolol 2.5-5mg or IV diltiazem for AF with rapid ventricular response"
3. "Cautious IV diuretics for pulmonary congestion"
4. "Anticoagulation: heparin infusion if AF (stroke risk)"
5. "If haemodynamically unstable AF: emergent DC cardioversion"
6. "Urgent echo to assess severity and LA thrombus"
7. "Expedite PMBV if suitable"
Chronic Management
Medical:
- AF management: Rate control (beta-blockers, digoxin, diltiazem) and anticoagulation (warfarin - target INR 2.5-3.5 for AF with MS; DOACs less well-studied and generally NOT recommended for MS-related AF)
- Prophylaxis: Penicillin prophylaxis against Group A streptococcus (see rheumatic fever section)
- Diuretics for pulmonary congestion
- Avoid tachycardia (reduces diastolic filling time)
⚠️ HKMLE TRAP: Direct oral anticoagulants (DOACs) such as rivaroxaban and apixaban are contraindicated for AF in the setting of rheumatic MS. Warfarin (INR 2.5-3.5) remains the standard. This is a critical HKMLE high-yield distinction.
🏢 HA CLINICAL PATHWAY: In HK HA hospitals, warfarin with target INR 2.5-3.5 is standard for MS-related AF. DOAC prescriptions for this indication will be flagged as inappropriate in HA formulary. Patients with mitral prosthetic valves MUST use warfarin (DOACs contraindicated for mechanical valves).
Interventional (PMBV - Percutaneous Mitral Balloon Valvotomy):
- Preferred in rheumatic MS with Wilkins score ≤8, no LA thrombus, no significant MR
- Procedure: Inoue balloon inflated across fused commissures via transseptal puncture
- Outcomes: MVA doubles; excellent long-term results in HK/Asian centres given high rheumatic prevalence
Surgical (Mitral Valve Replacement - MVR):
- Indications: Wilkins score >8, significant MR, LA thrombus, failed PMBV, combined disease
- Mechanical valve: younger patients <65 years (requires lifelong warfarin)
- Bioprosthetic valve: older patients >65 years or pregnancy planning (shorter durability but no anticoagulation needed after 3 months)
Surgical Indications for MS
| Indication | Class |
|---|
| Symptomatic severe MS (MVA <1.5 cm²) - valve suitable | PMBV Class I |
| Symptomatic severe MS - valve not suitable for PMBV | MVR Class I |
| Asymptomatic severe MS (MVA <1.5 cm²) + high embolic risk | Class IIa |
| Asymptomatic very severe MS (MVA <1.0 cm²) | PMBV Class IIb |
Complications: "PACED"
- Pulmonary hypertension → RV failure
- Atrial fibrillation + thromboembolism/stroke
- Cardiac failure (biventricular, late)
- Endocarditis
- Dysphonia (Ortner's syndrome)
PART 4: MITRAL REGURGITATION (MR)
Definition
Retrograde flow of blood from LV to LA during systole due to incompetent mitral valve.
Classification
| Type | Timing | Mechanism | Key Features |
|---|
| Acute MR | Sudden | Chordae tendineae rupture, papillary muscle rupture (post-MI), acute IE | Haemodynamic emergency; normal-sized heart on CXR |
| Chronic compensated | Months-years | LA and LV dilate to accommodate; preserved LVEF | Often asymptomatic long period |
| Chronic decompensated | Late | LV dysfunction; LVEF appears falsely normal (ejecting into low-resistance LA) | Heart failure symptoms |
Carpentier Functional Classification
| Type | Leaflet Motion | Cause |
|---|
| Type I | Normal | Annular dilatation, IE perforation |
| Type II | Excessive (prolapse) | Myxomatous, MVP, chordal rupture |
| Type IIIa | Restricted (systole + diastole) | Rheumatic, calcification |
| Type IIIb | Restricted (systole only) | Ischaemic, DCM |
Aetiology Mnemonic: "PRIME"
- Prolapse (mitral valve prolapse - most common in Western populations; myxomatous disease)
- Rheumatic fever (most common in Asia/HK)
- Ischaemic (papillary muscle dysfunction, post-MI)
- Myxomatous degeneration (Barlow's disease)
- Endocarditis, Ehlers-Danlos, Enlarged (dilated cardiomyopathy - functional MR)
🌏 LOCAL EPIDEMIOLOGY VARIANT: Rheumatic MR is far more prevalent in HK/Asia than in Western countries, where myxomatous MVP predominates. However, ischaemic MR is increasingly recognised as HK's population ages and IHD prevalence rises.
Pathophysiology (Acute vs Chronic)
Chronic:
- Regurgitant volume → LA pressure rises gradually → LA dilates
- LV dilates (eccentric hypertrophy) to maintain forward CO
- Trap: LVEF appears NORMAL or HIGH because LV is ejecting into low-resistance LA
- Progressive LV dysfunction occurs silently; by time LVEF drops to 50-55%, significant contractile dysfunction already present
- Eventually: LA fibrillation, pulmonary hypertension, HF
Acute:
- Sudden regurgitation into UNDILATED LA → acute rise in LA/pulmonary venous pressure
- Flash pulmonary oedema
- Cardiogenic shock
- Heart size is NORMAL on CXR (no time for LA/LV dilation)
Symptoms
- Chronic: exertional dyspnoea, palpitations (AF), fatigue
- Acute: sudden severe dyspnoea, pulmonary oedema, shock
Signs
- Pansystolic murmur at apex, radiating to axilla (or left sternal edge if posterior leaflet prolapse)
- Displaced hyperdynamic apex (volume-overloaded LV)
- Soft S1 (mitral valve leaflets fail to close fully)
- S3 (rapid ventricular filling - dilated LV)
- Signs of AF and pulmonary hypertension in advanced disease
- Acute MR specific: pulmonary oedema signs, hypotension, loud murmur may be soft/absent if cardiac output very low
⚠️ HKMLE TRAP: In ACUTE severe MR (e.g., post-MI papillary rupture), the murmur may be SOFT or ABSENT due to rapidly equalised pressures between LV and LA. The exam may give you a post-MI patient with flash pulmonary oedema but a "soft/no murmur" - think acute MR.
Investigations Algorithm
Bedside:
- ECG: P mitrale, AF, LVH
- SpO2
Labs:
- Troponin (if acute MR post-MI)
- BNP/proBNP
Imaging:
- Echo (TTE): Grading of MR severity, leaflet anatomy, LA/LV dimensions, LVEF, PA pressure
- TOE: more detailed leaflet anatomy (especially for surgical planning/repair vs replacement), LA thrombus
- CMR: most accurate for regurgitant volume/fraction when echo suboptimal
- Coronary angiography: if ischaemic MR suspected
📋 INVESTIGATION INTERPRETATION BOX
Severe MR on Echo: Vena contracta >7mm, regurgitant volume ≥60mL/beat, EROA ≥0.4 cm², dilated LV (LVEDD 68mm), LVEF = 58%
Interpretation: Severe MR with LV dilation. Note LVEF of 58% is deceptively "normal" - in MR, surgery is indicated when LVEF drops to <60% or LVESD ≥40mm.
Management
Acute MR (Emergency Verbal Orders)
1. "IV access x2, O2, monitoring, 12-lead ECG"
2. "Urgent bedside echo"
3. "IV nitroprusside or IV GTN - to reduce afterload and regurgitant fraction"
4. "IV dobutamine if cardiogenic shock"
5. "IABP - may be used as bridge to surgery (UNLIKE AR, not contraindicated in MR)"
6. "Urgent cardiac surgery referral - mitral valve repair or replacement"
7. "If post-MI papillary rupture: STEMI management concurrently + emergent CABG + MVR"
Chronic MR - Medical
- No specific medical therapy slows progression
- Vasodilators (ACEI) for hypertension management
- Rate/rhythm control for AF + anticoagulation (warfarin preferred for rheumatic MR + AF)
- Diuretics for congestion
Surgical Indications (ACC/AHA 2021)
| Indication | Class |
|---|
| Symptomatic severe primary MR + LVEF >30% | Class I |
| Asymptomatic severe primary MR + LVEF 30-60% OR LVESD ≥40mm | Class I |
| Severe MR undergoing other cardiac surgery | Class I |
| Asymptomatic severe MR + preserved LV function + new AF or PA systolic >50mmHg | Class IIa |
⚠️ HKMLE TRAP: The LVEF threshold for MR surgery is 60% (not 50%) because MR artificially inflates LVEF. An LVEF of 55% in MR already indicates significant LV dysfunction.
Mitral Valve Repair vs Replacement:
- Repair preferred when feasible (lower mortality, no anticoagulation needed, better LV preservation)
- Type II (prolapse) lesions most amenable to repair
- Rheumatic MR (Type IIIa) often requires replacement
- MitraClip (percutaneous edge-to-edge repair): for high surgical risk patients (EVEREST II trial)
PART 5: RHEUMATIC HEART DISEASE (RHD)
Definition
Cardiac damage resulting from autoimmune inflammation triggered by Group A beta-haemolytic Streptococcal (GAS) pharyngitis → Acute Rheumatic Fever (ARF) → valvular scarring.
Jones Criteria (Revised 2015 AHA)
Required: Evidence of preceding GAS infection (elevated/rising ASOT or anti-DNase B, positive throat culture, or recent streptococcal pharyngitis)
PLUS: 2 major OR 1 major + 2 minor criteria
MAJOR Criteria (Mnemonic: "CASES")
| Major | Notes |
|---|
| Carditis (clinical or subclinical) | Most important; subclinical = echo-Doppler only |
| Arthritis (migratory polyarthritis) | Most common manifestation (70-80%); fleeting joint involvement |
| Sydenham's chorea | Purposeless involuntary movements; may occur months later; associated with emotional lability; |
| Erythema marginatum | Evanescent ring-shaped lesion on trunk (not face) |
| Subcutaneous nodules | Firm painless nodules over bony prominences; associated with severe carditis |
MINOR Criteria (Mnemonic: "FEPCAR")
- Fever (>38.5°C)
- Elevated CRP (>30mg/L) or ESR (>60mm/hr)
- Prolonged PR interval on ECG
- Clinical features (arthralgia - only if arthritis not counted as major)
- Anthralgia / Prior ARF history
- Raised WBC
⚠️ HKMLE TRAP: Arthralgia can ONLY be used as a minor criterion if arthritis is NOT being counted as a major criterion. You cannot double-count.
⚠️ HKMLE TRAP: The 2015 revision created TWO tiers:
- High-risk population (indigenous, low SES, endemic areas including parts of mainland China/HK immigrant populations): monoarthritis can count as major; lower fever threshold
- Low-risk population: polyarthritis required for major criterion
📋 CHP STATUTORY NOTIFICATION BOX:
Acute Rheumatic Fever (ARF) is NOT currently listed as a statutory notifiable disease under Hong Kong's Prevention and Control of Disease Ordinance (Cap. 599). However, confirmed or suspected cases of streptococcal toxic shock syndrome and invasive GAS may be reportable. RHD itself is not notifiable. Clinicians should follow local HA infection control notification internally. Contrast with some other jurisdictions (e.g., New Zealand, Western Australia) where ARF IS statutorily notifiable.
🌏 LOCAL EPIDEMIOLOGY VARIANT: RHD remains a significant health issue in HK, particularly among elderly patients and recent immigrants from mainland China and Southeast Asia. The HK population has an older cohort of untreated/undertreated rheumatic disease. Younger patients with MS in HK should be assumed rheumatic unless proven otherwise.
Pathophysiology of Rheumatic Carditis
- GAS (Group A Streptococcus) pharyngitis → M-protein antigen
- Molecular mimicry: anti-GAS antibodies cross-react with cardiac myosin, tropomyosin, and valve proteins
- Antibodies bind valvular endothelium → upregulate adhesion molecules (VCAM-1)
- CD4+ T-cell infiltration into valve tissue
- Acute: pancarditis (pericarditis + myocarditis + endocarditis) → Aschoff bodies (pathognomonic granulomas)
- Repeated attacks → progressive fibrosis, commissural fusion, leaflet thickening, chordal shortening
- MITRAL VALVE MOST COMMONLY AFFECTED (left-sided valves: mitral >> aortic)
🔬 BASIC SCIENCE INTEGRATION BOX:
Aschoff Bodies: Pathognomonic granulomas of ARF. Central area of fibrinoid necrosis surrounded by lymphocytes, plasma cells, and large "Anitschkow cells" (caterpillar cells). Found in myocardium. Do NOT confuse with Aschoff-Rokitansky sinuses (gallbladder pathology).
Management of ARF
Acute Attack
1. "Penicillin V 500mg QDS x 10 days (or benzathine penicillin G 1.2 MU IM single dose)
   - eradicate GAS even if throat culture negative"
2. "Amoxicillin 500mg TDS if penicillin allergy → erythromycin or azithromycin"
3. "Anti-inflammatory: Aspirin 80-100mg/kg/day (children) for arthritis and fever"
4. "Corticosteroids: prednisolone if severe carditis with CHF (high-dose, tapering)"
5. "Bed rest during acute phase"
6. "Treat CHF if present: diuretics, ACEI"
7. "Treat chorea: sodium valproate or haloperidol (carbamazepine second-line)"
Secondary Prophylaxis (CRITICAL - HIGH YIELD)
Benzathine penicillin G 1.2 MU IM every 4 weeks (preferred over oral penicillin V - better compliance)
Duration:
| Category | Duration |
|---|
| ARF without carditis | 5 years or until age 18, whichever is longer |
| ARF with mild/moderate carditis | 10 years or until age 25, whichever is longer |
| ARF with severe carditis (valve disease present) | At least 10 years or until age 40; lifelong in high-risk |
| Post-MVR/MVS | Lifelong (high-risk) |
🏢 HA CLINICAL PATHWAY: HK HA follows ESC 2021 guidelines for secondary prophylaxis. Benzathine penicillin G IM every 3-4 weeks is the HA formulary standard. Patients with persistent valve disease are maintained on lifelong prophylaxis. HA rheumatic fever registers are maintained at paediatric and medical departments.
⚠️ HKMLE TRAP: The standard injection interval is 3-4 weeks (not monthly/6-weekly). In high-risk populations, some guidelines recommend every 3 weeks for better protection. The exam may test the correct interval.
PART 6: INFECTIVE ENDOCARDITIS (IE)
Definition
Infection, usually bacterial, of the endocardial surface of the heart - primarily cardiac valves, but also septal defects, mural endocardium, or cardiovascular implantable electronic devices (CIEDs).
Classification
| Type | Course | Organisms | Valves |
|---|
| Acute IE | Days-weeks; destructive | S. aureus (most common) | Can affect normal valves |
| Subacute IE | Weeks-months; insidious | S. viridans, Enterococcus, HACEK | Damaged/abnormal valves |
| Prosthetic valve IE (Early, <60 days) | Aggressive | S. aureus, coagulase-negative Staph, gram-negatives | Prosthetic |
| Prosthetic valve IE (Late, >60 days) | Similar to native | S. viridans, S. aureus | Prosthetic |
| IVDU IE | Right-sided (tricuspid) | S. aureus (dominant) | Tricuspid |
Organisms Mnemonic: "VIBES" (common organisms)
- Viridans streptococci (community, damaged valves, subacute)
- IVIDU: S. aureus (right-sided, acute)
- Bovis (Strep. gallolyticus) - associated with COLON CANCER (colonoscopy!)
- Enterococcus (GI/GU procedures, elderly)
- Staph aureus (healthcare, most common in high-income countries NOW)
- Also: HACEK organisms (Haemophilus, Aggregatibacter, Cardiobacterium, Eikenella, Kingella) - culture-negative, fastidious gram-negatives
🌏 LOCAL EPIDEMIOLOGY VARIANT: In HK, Klebsiella pneumoniae is a notable cause of community-acquired endocarditis, particularly in patients with diabetes, liver disease, or prior antibiotic use. This contrasts sharply with Western guidelines which rarely feature Klebsiella. Also note that in HK, S. aureus IE has increasing MRSA prevalence.
⚠️ HKMLE TRAP: Strep. bovis (Strep. gallolyticus) IE MUST prompt a colonoscopy to exclude colorectal carcinoma - this is high-yield for both Paper 1 and Paper 2.
Predisposing Conditions (Risk Factors) Mnemonic: "DIVE-CP"
- Damaged valves (rheumatic, calcific, bicuspid)
- IVDU (IV drug use)
- Ventricular septal defect / congenital HD
- Endocarditis (previous)
- Cardiovascular implants (prosthetic valves, pacemakers, ICD leads)
- Poor dental hygiene / recent dental procedures
Pathogenesis
- Bacteremia (dental, GI, GU procedures, IVDU, line insertion)
- Bacteria adhere to disrupted valvular endothelium / sterile platelet-fibrin thrombus
- Vegetation forms: thrombotic debris + bacteria + fibrin
- Vegetation can grow, embolise, or destroy valve architecture
- Local complications: abscess, perforation, fistula, conduction abnormality
Symptoms Mnemonic: "FEVER FROM MICRO"
- Fever (most common - present in 90%)
- Emboli (stroke, limb ischaemia, splenic infarct, renal infarct, pulmonary emboli [right-sided])
- Valvular regurgitation (new/changed murmur)
- Endocarditis peripheral signs
- Rigors / chills
- Fatigue / malaise
- Raised inflammatory markers (ESR, CRP)
- Osler nodes, Osler positive (any peripheral sign)
- Myalgia / arthralgia
- Murmur (new or changing)
- Ignored early symptoms (subacute - weeks of "flu-like illness")
- Congestion (CHF from valve destruction)
- Renal involvement (glomerulonephritis - immune complex)
- Ophthalmological (Roth spots)
Signs (Peripheral Stigmata)
| Sign | Description | Mechanism |
|---|
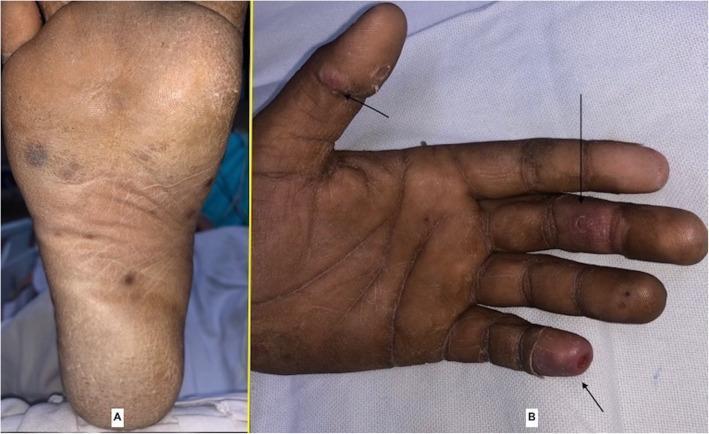
| Osler nodes | Painful red nodules on finger/toe pulps | Immune complex deposition |
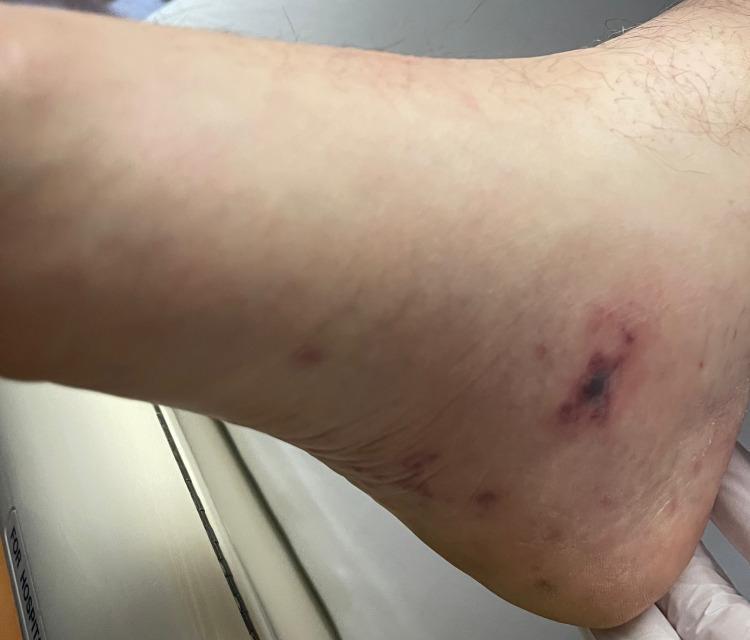
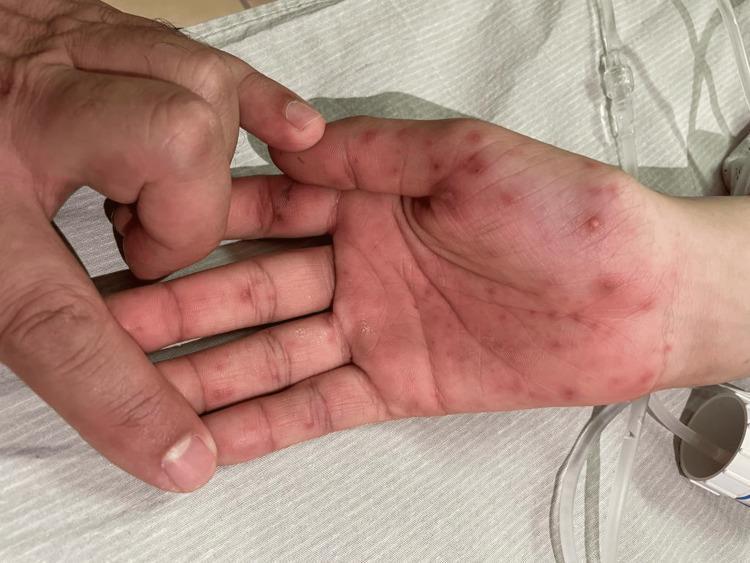
| Janeway lesions | Painless erythematous macules on palms/soles | Septic microemboli |
| Splinter haemorrhages | Linear dark streaks under nails | Microemboli |
| Roth spots | Pale-centred retinal haemorrhages | Microemboli |
| Clubbing | Finger clubbing (subacute) | Chronic hypoxia/bacterial toxins |
| New murmur | Most important finding | Valve destruction or regurgitation |
| Splenomegaly | Especially subacute | Immune activation |
| Haematuria | Glomerulonephritis | Immune complex |
| Embolic events | Stroke, abscess, infarcts | Vegetation fragments |
Memory trick: "Osler = O for Ouch (painful); Janeway = J for Just kidding (painless)"
Duke Criteria (Modified)
Definite IE = 2 major, OR 1 major + 3 minor, OR 5 minor
MAJOR CRITERIA:
- Blood culture positive for IE (2 separate cultures with typical organisms: S. viridans, S. bovis, HACEK group, S. aureus, Enterococcus without primary focus; OR persistently positive for less typical organisms; OR single positive for Coxiella burnetii/Q fever)
- Imaging positive for IE (Echo: vegetation, abscess, new dehiscence of prosthetic valve; OR new valvular regurgitation on Echo; PET/CT showing periannular activity in prosthetic valve)
MINOR CRITERIA:
- Predisposing condition (heart condition or IVDU)
- Fever >38°C
- Vascular phenomena (emboli, Janeway lesions, septic pulmonary infarcts, mycotic aneurysm, intracranial haemorrhage, conjunctival haemorrhages)
- Immunological phenomena (glomerulonephritis, Osler nodes, Roth spots, positive rheumatoid factor)
- Positive blood culture not meeting major criteria (single positive for non-typical organism)
⚠️ HKMLE TRAP: New valvular REGURGITATION (not just a murmur change) is a MAJOR Duke criterion. Worsening of pre-existing murmur does NOT qualify.
Investigations Algorithm
Bedside:
- Cardiac monitoring (heart block = aortic root abscess emergency)
- Dental/skin/line examination
Labs:
- Blood cultures x3 from DIFFERENT sites BEFORE starting antibiotics (at least 30 min apart; aerobic + anaerobic)
- FBC: anaemia of chronic disease, leucocytosis
- ESR, CRP (elevated)
- Urinalysis: haematuria (microscopic), proteinuria (glomerulonephritis)
- Renal function (immune complex GN, antibiotic nephrotoxicity)
- Rheumatoid factor, ANA (immunological)
- Serology for atypical organisms (Coxiella, Bartonella, Brucella, fungi) if culture-negative
Imaging:
- TTE first - if negative or poor quality → TOE (sensitivity: TTE 60-75%, TOE 87-100%)
- TOE superior for: prosthetic valves, aortic root abscess, posterior structures, perivalvular extension
- CXR: pulmonary emboli (right-sided IE), cardiomegaly, pulmonary oedema
- CT brain/spine: if neurological symptoms
- Whole-body CT or PET/CT: for prosthetic valve IE (new in 2023 ESC criteria)
- Ophthalmoscopy: Roth spots
📋 INVESTIGATION INTERPRETATION BOX
Classic IE Blood Culture: 3 out of 3 bottles positive for S. viridans (alpha-haemolytic Streptococcus). No source found.
Interpretation: This is 1 Major Duke criterion (persistently positive blood cultures for typical organism). Combined with a new MR murmur (1 Major) and fever (1 Minor), this meets definite IE. Colonoscopy NOT needed for S. viridans (colonoscopy is for S. bovis).
Management
Empirical Antibiotic Therapy (Start AFTER 3 sets of blood cultures)
Native valve, community-acquired (empirical):
- Amoxicillin-clavulanate (covers streptococci, enterococci, HACEK) ± gentamicin
- Or: Ampicillin + cloxacillin + gentamicin (triple therapy if IVDU suspected)
Prosthetic valve (empirical):
- Vancomycin + gentamicin + rifampicin (covers MRSA and coagulase-negative staphylococci)
Targeted therapy:
| Organism | Antibiotic | Duration |
|---|
| S. viridans (penicillin-sensitive) | Benzylpenicillin or Amoxicillin | 4 weeks (2 weeks if uncomplicated) |
| MSSA (methicillin-sensitive S. aureus) | Flucloxacillin (cloxacillin in HK) IV | 6 weeks (at least) |
| MRSA | Vancomycin ± rifampicin | 6 weeks |
| Enterococcus | Ampicillin + gentamicin | 4-6 weeks |
| Strep. bovis | Benzylpenicillin | 4 weeks |
| HACEK | Ceftriaxone | 4 weeks |
🏢 HA CLINICAL PATHWAY: In HK HA hospitals, flucloxacillin (cloxacillin) is the preferred antistaphylococcal agent for MSSA IE. Vancomycin is reserved for confirmed MRSA or penicillin allergy. Gentamicin use is restricted due to nephrotoxicity; monitoring trough levels is mandatory. All IE cases in HK tertiary centres are managed by a multidisciplinary IE team (Infectious Diseases, Cardiology, Cardiac Surgery).
Indications for SURGERY in IE (The "3 Cs": Congestive failure, Controlled infection failure, Complications)
| Indication | Urgency |
|---|
| Acute severe valvular regurgitation with HF | Emergency/Urgent |
| Uncontrolled infection (persistent fever >7 days, abscess, fistula) | Urgent |
| Large vegetation (>10mm) with prior embolic event | Urgent |
| Very large vegetation (>15mm) without prior embolism | Elective |
| Fungal IE | Urgent |
| Prosthetic valve IE with dehiscence | Urgent |
| New-onset heart block (aortic root abscess) | Emergency |
Complications Mnemonic: "HANES"
- Heart failure (most common cause of death)
- Abscess / conduction block (perivalvular, especially aortic root → heart block)
- Neurological (stroke from emboli, mycotic aneurysm, abscess)
- Emboli (splenic, renal, pulmonary)
- Septic shock / septic metastases (S. aureus)
Prognosis
- In-hospital mortality: 15-20% (higher with S. aureus, prosthetic valve, heart failure, stroke)
- IVDU IE: recurrence risk high if drug use continues
PART 7: PERICARDIAL DISEASE
Pericarditis
Definition
Inflammation of the pericardium (pericardial sac). Classified as: acute (<4-6 weeks), incessant (>4-6 weeks without remission), recurrent, or chronic constrictive.
Aetiology Mnemonic: "VITAL"
- Viral (most common: Coxsackie B, echo, adeno, EBV, CMV)
- Idiopathic (majority of "viral" cases - no organism identified)
- Tuberculosis (important in HK - see below)
- Autoimmune (SLE, RA, Dressler's syndrome post-MI, post-cardiac surgery)
- Local/other: uraemia (renal failure), malignancy, post-radiation, hypothyroidism, amyloid
🌏 LOCAL EPIDEMIOLOGY VARIANT: Tuberculous pericarditis is far more common in HK compared to Western countries, given HK's high TB burden (TB notification rate ~40/100,000). In any HK patient with pericarditis, TB must be excluded, particularly if constitutional symptoms, pleural effusion, or lymphadenopathy present. TB pericarditis causes constrictive pericarditis as a late complication.
📋 CHP STATUTORY NOTIFICATION BOX:
Tuberculosis (including TB pericarditis) IS a statutory notifiable disease in HK under Prevention and Control of Disease Ordinance (Cap. 599). All TB cases must be notified to the Department of Health. TB pericarditis = notifiable as TB.
Signs and Symptoms
Classic Triad of Acute Pericarditis:
- Sharp pleuritic chest pain (worse on inspiration, better leaning forward / sitting up)
- Pericardial friction rub (scratchy, to-and-fro sound, heard best at lower left sternal edge with patient leaning forward; may be systolic only, diastolic only, or both)
- ECG changes (see below)
ECG in Pericarditis - "Saddle-shaped ST elevation"
Stage 1 (hours-days): Diffuse concave-up ("saddle-shaped") ST elevation + PR depression (in ALL leads except aVR and V1 where it's ST depression + PR elevation)
Stage 2: ST normalises, T wave flattening
Stage 3: T wave inversion
Stage 4: ECG normalises
📋 INVESTIGATION INTERPRETATION BOX:
ECG Stage 1 Pericarditis: Leads I, II, III, aVF, V2-V6 show concave-up (saddle-shaped) ST elevation of 1-3mm. PR segment depression in same leads. Lead aVR shows PR elevation + ST depression.
Interpretation: Diffuse, saddle-shaped ST elevation with PR depression = classic pericarditis. Contrast with STEMI (focal/territorial, convex ST elevation, no PR changes, reciprocal changes).
⚠️ HKMLE TRAP: Pericarditis vs STEMI on ECG:
| Feature | Pericarditis | STEMI |
|---|
| ST shape | Concave up (saddle) | Convex (tombstone/dome) |
| Distribution | Diffuse (all leads) | Territorial (e.g., inferior or anterior) |
| Reciprocal changes | None (except aVR/V1) | Present |
| PR depression | YES (pathognomonic) | No |
| Q waves | No | Yes (late) |
| Spasmodic chest pain | Pleuritic | Pressure/crushing |
Investigations
- ECG (as above)
- Echo: pericardial effusion (even small amounts confirm diagnosis)
- CXR: enlarged cardiac silhouette if large effusion
- Bloods: troponin (myopericarditis), CRP/ESR (elevated), TB tests (Mantoux, IGRA, ADA in pericardial fluid), viral serology, ANA/dsDNA
Management
- NSAIDs (ibuprofen 400-600mg TDS or aspirin 750-1000mg TDS) = first-line
- Colchicine 0.5mg BD added to NSAIDs (COPE and ICAP trials: reduces recurrence from ~30% to ~15%)
- Restrict strenuous exercise until symptoms resolved and CRP normal
- Corticosteroids if NSAIDs/colchicine contraindicated OR specific cause (TB, autoimmune, uraemia) - NOT first-line as increase recurrence risk
- TB pericarditis: anti-TB therapy + corticosteroids (prednisolone reduces mortality and constrictive pericarditis risk in RCTs)
Cardiac Tamponade
Definition
Haemodynamically significant compression of cardiac chambers by pericardial effusion → impaired cardiac filling → reduced cardiac output.
Causes
- Trauma, post-MI (free wall rupture), aortic dissection (type A), malignancy, iatrogenic (post-pericardiocentesis, post-cardiac catheterisation), TB
Beck's Triad (Classic Signs)
- Hypotension (↓ CO)
- Raised JVP (impaired venous return to heart)
- Muffled heart sounds (pericardial fluid insulates sounds)
Other Signs
- Pulsus paradoxus: >10mmHg drop in SBP during inspiration (exaggerated normal phenomenon; inspiratory RV filling compresses LV through fixed pericardial constraint)
- Tachycardia (compensatory)
- Kussmaul's sign: absent in tamponade (present in constrictive pericarditis)
⚠️ HKMLE TRAP: Kussmaul's sign (JVP RISING on inspiration) is present in CONSTRICTIVE PERICARDITIS, NOT tamponade. In tamponade, JVP is elevated but rises further with pulsus paradoxus.
Management - Emergency
1. "IV fluids (500mL bolus NS) - to increase preload and maintain CO"
2. "AVOID diuretics and vasodilators (will precipitate cardiovascular collapse)"
3. "Urgent bedside echo to confirm diagnosis and guide drainage"
4. "Pericardiocentesis (pericardial drainage) - definitive treatment"
5. "If traumatic haemopericardium: emergency surgical drainage"
6. "Identify and treat underlying cause"
Constrictive Pericarditis
Definition
Pericardial fibrosis/calcification → encases the heart → impairs diastolic filling
Causes (HK-relevant)
- TB (most important in HK)
- Prior cardiac surgery / radiation
- Idiopathic / viral (after acute pericarditis)
- Connective tissue disease
Signs
- Elevated JVP (non-pulsatile)
- Kussmaul's sign (JVP RISES on inspiration - pathognomonic of constrictive pericarditis vs tamponade)
- Pericardial knock (early diastolic sound = abrupt halt of ventricular filling by rigid pericardium)
- Friedreich's sign: Sharp Y-descent in JVP (rapid ventricular filling then abrupt halt)
- Signs of right heart failure: oedema, ascites, hepatomegaly
- Small-volume, non-pulsatile pulse
Investigations
- Echo: thickened pericardium, septal bounce (ventricular interdependence), dilated IVC
- CT/MRI: pericardial thickening >4mm ± calcification
- Cardiac catheterisation: "dip-and-plateau" pattern (square root sign) in RV/LV pressure tracings; equalization of diastolic pressures in all chambers
Management
- Surgical pericardiectomy (definitive)
- TB treatment if tuberculous cause
PART 8: CARDIOMYOPATHIES
Classification
| Type | Mechanism | Key Feature | Causes |
|---|
| Dilated (DCM) | Systolic dysfunction | Dilated LV + ↓ LVEF | Idiopathic (50%), familial (TTN mutations), alcohol, viral myocarditis, peripartum |
| Hypertrophic (HCM) | Diastolic dysfunction | Asymmetric LVH, small LV cavity | Autosomal dominant (sarcomere mutations: MYH7, MYBPC3) |
| Restrictive (RCM) | Impaired filling (stiff ventricle) | Normal/small LV, markedly dilated atria | Amyloidosis, sarcoidosis, haemochromatosis, radiation, tropical eosinophilic |
| Arrhythmogenic Cardiomyopathy (ACM/ARVC) | RV fatty/fibrous replacement | RV abnormalities, VT with LBBB morphology | Autosomal dominant (desmoplakin, plakophilin mutations) |
Dilated Cardiomyopathy (DCM)
Definition: Dilated LV (LVEDD >56mm or LVEDD/BSA >32mm/m²) + impaired systolic function (LVEF <50%)
Key features:
- May present with heart failure, AF, embolic events, or sudden cardiac death
- Troponin elevation in acute myocarditis phase
- Echo: dilated LV, globally reduced function, functional MR (annular dilation)
- Management: Standard HF therapy (ACEI/ARB/sacubitril-valsartan, beta-blocker, MRA, SGLT2i); ICD for SCD prevention; CRT if LBBB + LVEF <35%; cardiac transplantation
🌏 LOCAL EPIDEMIOLOGY VARIANT: Peripartum cardiomyopathy is seen in HK and has a higher prevalence in patients of South Asian and African origin. Any woman presenting with new-onset HF in the last month of pregnancy or first 5 months postpartum should be suspected of PPCM.
Hypertrophic Cardiomyopathy (HCM)
Definition: LV wall thickness ≥15mm (≥13mm if positive family history) not explained by loading conditions, in the absence of another cause.
Genetic basis: Autosomal dominant; >1500 mutations in sarcomere proteins (MYH7 = beta-myosin heavy chain [most common], MYBPC3 = cardiac myosin-binding protein C)
Obstructive HCM (HOCM): 70% of HCM patients have LVOT obstruction (gradient >30 mmHg at rest)
- Dynamic obstruction worsened by: decreased preload (dehydration, nitrates, Valsalva), decreased afterload, increased contractility
- Mechanism: Systolic anterior motion (SAM) of mitral valve → LVOT obstruction
Echo findings (HCM):
- Asymmetric septal hypertrophy (ASH) - septum:posterior wall ratio >1.3:1
- Small LV cavity with hyperdynamic function
- Systolic anterior motion (SAM) of anterior mitral leaflet (pathognomonic of obstructive HCM)
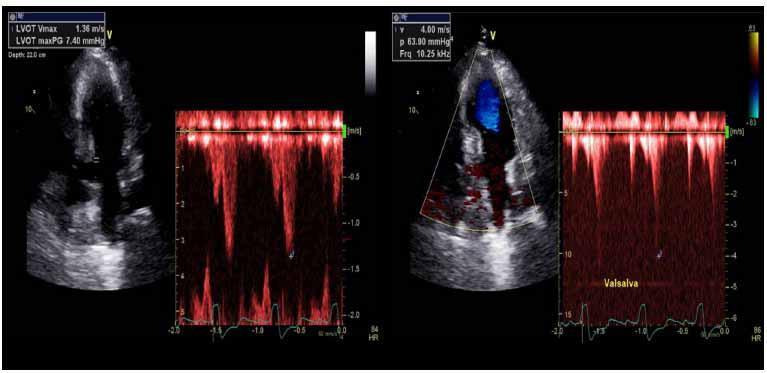
- Dagger-shaped/late-peaking CW Doppler gradient (dynamic)
Murmur in HCM:
- Ejection systolic murmur at LLSE
- INCREASES with: standing, Valsalva (↓ preload → worse obstruction)
- DECREASES with: squatting, passive leg raise, handgrip (↑ preload/afterload → less obstruction)
⚠️ HKMLE TRAP: The HCM murmur behaves OPPOSITE to AS. In AS, Valsalva decreases the murmur. In HCM/HOCM, Valsalva INCREASES the murmur. This is a very common MCQ trap.
Symptoms of HCM:
- Exertional dyspnoea (most common)
- Angina (supply-demand mismatch in hypertrophied muscle)
- Syncope (during/after exercise - fixed CO, peripheral vasodilation)
- Sudden cardiac death (VF - especially in young athletes) - leading cause of sudden death in young adults in HK
🚨 RED FLAGS in HCM (HIGH SCD RISK):
- Prior cardiac arrest / VF
- Sustained VT
- Family history of sudden death <45 years
- Unexplained syncope (especially exertional)
- LV wall thickness ≥30mm
- Abnormal BP response to exercise (failure to rise)
- NSVT on Holter
- Late gadolinium enhancement on CMR (>15% of LV mass)
Management of HCM:
- Obstruction (HOCM): Beta-blockers (first-line) > verapamil/disopyramide; avoid vasodilators, nitrates, diuretics (worsen obstruction); Mavacamten (new cardiac myosin inhibitor - EXPLORER-HCM trial 2020) for symptomatic HOCM
- SCD prevention: ICD implantation (primary or secondary prevention)
- Septal reduction: Surgical myectomy (Morrow procedure - gold standard) or Alcohol septal ablation (TASH) for refractory symptomatic HOCM
- Competitive sports restriction: All HCM patients should avoid high-intensity competitive sports
- Genetic counselling + family screening: First-degree relatives require echo + genetic testing
🏢 HA CLINICAL PATHWAY: HCM is managed at cardiac centres with dedicated HCM clinics at QMH/PWH. SCD risk assessment using HCM-SCD calculator (AHA/ESC) is standard practice. Mavacamten is available in HK (HKFDA approved) for obstructive HCM. First-degree family members are referred for genetic counselling.
Restrictive Cardiomyopathy (RCM)
Definition: Diastolic dysfunction with normal/reduced LV cavity size and markedly elevated filling pressures, due to myocardial stiffness.
Key causes in HK:
- Cardiac amyloidosis (AL type = plasma cell dyscrasia; ATTR type = transthyretin amyloid - increasing recognition in elderly)
- Sarcoidosis
- Haemochromatosis (iron overload)
- Post-radiation
Classic Echo in Amyloidosis:
- "Sparkling" myocardium (ground-glass texture)
- Concentric LVH with small LV cavity
- Dilated atria
- Thickened valves, IVC
- LVEF often initially normal but restrictive filling on Doppler (E/E' >14)
⚠️ HKMLE TRAP: Cardiac amyloidosis can have a NORMAL LVEF early. The clue is an ECG with LOW VOLTAGES contradicting echo LVH. "Low voltage ECG + echo LVH" = amyloid until proven otherwise. Distinguish from HCM (HCM has HIGH voltage on ECG).
Management of RCM:
- Treat underlying cause (dialysis for uraemia, steroids for sarcoid, venesection/chelation for haemochromatosis, tafamidis for ATTR amyloid - ATTR-ACT trial)
- Diuretics (carefully - preload dependent)
- Rate control (important - poorly tolerates tachycardia)
- Anticoagulation (high AF risk)
REQUIRED TABLES
⚠️ DRUG TRAPS TABLE
| Drug/Scenario | Trap | Correct Answer |
|---|
| GTN/Nitrates in AS | Can cause fatal hypotension (preload-dependent) | AVOID; if must use - extreme caution, small dose |
| IABP in AR | Increases diastolic pressure → worsens regurgitation | CONTRAINDICATED in AR |
| DOACs in rheumatic MS + AF | Inadequate evidence; RE-ALIGN study showed DOACs worse | Use WARFARIN (INR 2.5-3.5) |
| DOACs in mechanical prosthetic valves | Increased thromboembolic events | WARFARIN ONLY (NEVER DOACs) |
| Beta-blockers in HOCM | Beneficial - reduce heart rate, increase diastolic filling, reduce obstruction | USE (first-line); unlike HF where they reduce mortality |
| Vasodilators in HOCM | Reduce afterload → worsen LVOT obstruction | AVOID (nitrates, ACEIs for obstruction) |
| Digoxin in HOCM | Positive inotrope → worsens LVOT obstruction | AVOID in obstructive HCM |
| Amiodarone in HCM | Can be used for AF/VT but causes thyroid toxicity | Monitor TFTs; consider ablation |
| Aspirin in pericarditis | NSAIDs preferred EXCEPT in post-MI pericarditis (Dressler's) where aspirin preferred | Post-MI: use aspirin 650mg q6-8h |
| Starting antibiotics BEFORE blood cultures in IE | Leads to culture-negative IE; delays targeted therapy | ALWAYS take 3 sets of blood cultures first |
| Penicillin prophylaxis frequency for RHD | Every 4 weeks standard; high-risk = every 3 weeks | Frequency matters! Don't say "monthly" if high-risk group |
| Surgical LVEF threshold for MR | LVEF 50% threshold (borrowed from AS) - WRONG | MR threshold = LVEF <60% or LVESD ≥40mm |
| Endocarditis prophylaxis - dental | No longer for most conditions | Only for HIGHEST risk: prosthetic valves, prior IE, certain congenital HD |
📊 NOTABLE TRIALS TABLE
| Trial | Condition | Year | Key Finding | HKMLE Relevance |
|---|
| PARTNER 1 | Severe AS inoperable | 2010 | TAVI 30% vs medical 50% 1-year mortality | TAVI superior to medical in inoperable AS |
| PARTNER 2 | AS intermediate risk | 2016 | TAVI non-inferior to SAVR | Extended TAVI eligibility |
| PARTNER 3 | AS low risk | 2019 | TAVI 8.5% vs SAVR 15.1% composite endpoint | TAVI now for ALL risk groups (with Heart Team) |
| NOTION | AS low risk (any age) | 2015 | TAVI comparable to SAVR | Supports TAVI in younger low-risk patients |
| COPE trial | Acute pericarditis | 2005 | Colchicine halves recurrence (32% vs 16%) | Colchicine + NSAIDs is standard |
| ICAP trial | Acute pericarditis | 2013 | Colchicine + NSAIDs: remission 87% vs 62% | Confirms colchicine benefit |
| EXPLORER-HCM | Obstructive HCM | 2020 | Mavacamten (myosin inhibitor) reduced LVOT gradient, improved symptoms | New treatment option for HOCM |
| ATTR-ACT | ATTR cardiac amyloid | 2018 | Tafamidis reduced all-cause mortality (29% vs 42%), hospitalisation | Tafamidis approved for ATTR amyloid |
| EVEREST II | Severe MR | 2011 | MitraClip non-inferior to surgery for mortality, superior for safety | Percutaneous MR repair for high-risk surgical patients |
| COAPT | Heart failure + secondary MR | 2018 | MitraClip + GDMT vs GDMT alone: reduced hospitalisations and mortality | Transcatheter repair benefits HF patients |
| MITRA-FR | Secondary MR | 2018 | MitraClip no benefit vs GDMT | Conflicting with COAPT; patient selection key |
| SEAS trial | AS progression | 2008 | Statins did NOT slow AS progression | No disease-modifying medical therapy for AS |
| MADIT-II | IHD + low LVEF | 2002 | ICD reduces SCD in patients with LVEF ≤30% (cardiomyopathy benefit) | ICD indication benchmark |
| RAFT | HF + LBBB | 2010 | CRT-D superior to ICD alone in HF + QRS ≥120ms | CRT indication in DCM |
🧠 MASTER MNEMONICS TABLE
| Mnemonic | Condition | Stands For |
|---|
| SAD | AS symptoms | Syncope, Angina, Dyspnoea |
| SNAILS | AS signs | Slow-rising pulse, Narrow PP, Aortic ESM, Immobile soft A2, Late-peaking, Sustained apex |
| BRAC | AS aetiology | Bicuspid, Rheumatic, Atherosclerotic, Congenital |
| MARRED | AR aetiology | Marfan, Aortic dissection, Rheumatic, RA/AS, Endocarditis, Dilated root |
| WIDE PULSE | AR signs | Wide PP, Increased carotid, De Musset's, Early diastolic murmur, Pistol shot, Uvula, Landolfi, Sustained apex, Edema |
| DHOAF | MS symptoms | Dyspnoea, Haemoptysis, Ortner's, Atrial fibrillation, Fatigue |
| MAST-MOM | MS signs | Malar flush, AF, Small pulse, Tapping apex, Mid-diastolic rumble, Opening snap, Murmur accentuation |
| PRIME | MR aetiology | Prolapse, Rheumatic, Ischaemic, Myxomatous, Endocarditis |
| CASES | ARF major criteria | Carditis, Arthritis, Sydenham's chorea, Erythema marginatum, Subcutaneous nodules |
| VIBES | IE organisms | Viridans, IVDU (S. aureus), Bovis (→ colonoscopy!), Enterococcus, Staphylococcus |
| DIVE-CP | IE risk factors | Damaged valves, IVDU, VSD, Endocarditis-prior, CIED/prosthetic, Poor dental hygiene |
| HANES | IE complications | Heart failure, Abscess/heart block, Neuro/stroke, Emboli, Septic shock |
| VITAL | Pericarditis aetiology | Viral, Idiopathic, TB, Autoimmune, Local/other |
| CASH-SB | AS complications | CHF, Arrhythmia, Syncope, Haemolysis, Stroke, Bacterial endocarditis |
| PACED | MS complications | Pulm HTN, AF + emboli, Cardiac failure, Endocarditis, Dysphonia |
| FLASH | AR complications | Failure, LV dilation, Aortic dissection, Syncope, Heart block |
| Beck's Triad | Tamponade | Hypotension, Raised JVP, Muffled sounds |
| 3 Cs | IE surgery indications | Congestive failure, Controlled infection failure, Complications |
🔗 CROSS-MODULE LINKS
| Topic | Connected Module | Link |
|---|
| AS + hypertension management | Module 1A: Hypertension | ACEI/ARB caution in AS; avoid causing hypotension |
| AR + aortic dissection | Module 1B: Aortic disease | AR in Type A dissection = surgical emergency (dual pathology) |
| MR + ischaemic heart disease | Module 1C: IHD | Acute papillary muscle rupture post-STEMI; also functional MR in DCM |
| IE + Klebsiella liver abscess | Hepatology / GI | Klebsiella bacteraemia (HK prevalence) can cause right-sided IE |
| IE + Strep. bovis | Gastroenterology | Mandates colonoscopy to exclude colorectal carcinoma |
| ARF + GAS pharyngitis | Infectious disease | Primary prevention = adequate antibiotic treatment of strep throat |
| HCM + sudden cardiac death in athletes | Sports medicine | HCM = #1 cause of SCD in young competitive athletes in Asia |
| Cardiac amyloidosis + monoclonal protein | Haematology | AL amyloid → workup for myeloma (SPEP, BJP, bone marrow biopsy) |
| Tamponade + lung cancer | Oncology | Malignant pericardial effusion - most common cause of tamponade in elderly HK population |
| Pericarditis + TB | Respiratory/Infectious disease | TB pericarditis - CHP Cap.599 notifiable; treat with anti-TB + steroids |
| Rheumatic fever + chorea | Neurology | Sydenham's chorea can mimic psychiatric disorders; streptococcal autoimmunity |
| RCM + ATTR amyloid | Geriatrics | Wild-type ATTR amyloid increasingly recognised in HK elderly men with HFpEF |
| DCM + peripartum | Obstetrics | PPCM: diagnosis of exclusion; bromocriptine as specific therapy (controversial) |
| Warfarin anticoagulation | Pharmacology | TTR monitoring; interactions (amiodarone, antibiotics increase warfarin effect) |
| TAVI + coronary artery disease | Interventional cardiology | Co-existing CAD evaluated pre-TAVI; revascularisation may be concurrent |
❓ COMMON EXAM QUESTION BOX
Paper 1 MCQ-style:
-
A 78-year-old HK Chinese man presents with a 3-month history of exertional syncope. On examination, pulse is slow-rising, BP 110/90 mmHg, harsh ESM at RUSE radiating to carotids, absent A2. Echo shows AVA 0.75 cm², mean gradient 52 mmHg. What is the next step?
- Answer: Proceed to AVR or TAVI after multidisciplinary Heart Team discussion (symptomatic severe AS = Class I indication).
-
A 55-year-old woman from mainland China presents with breathlessness and palpitations. Examination shows irregular pulse, malar flush, tapping apex, opening snap, mid-diastolic rumble. TOE shows LA appendage thrombus and MVA 1.2 cm². What CANNOT be done?
- Answer: PMBV is contraindicated with LA appendage thrombus. She needs 3-6 months of warfarin therapy first, then repeat TOE before considering PMBV.
-
An IVDU patient presents with fever, new pansystolic murmur, and septic pulmonary emboli on CT. Blood cultures grow S. aureus. What antibiotic is first-line?
- Answer: IV Flucloxacillin (for MSSA) for at least 6 weeks. If MRSA suspected/confirmed: IV Vancomycin.
-
A 22-year-old athlete collapses on the football field in HK. Echo shows asymmetric septal hypertrophy 22mm, SAM, LVOT gradient 90 mmHg. Which manoeuvre will increase the gradient?
- Answer: Valsalva manoeuvre (or standing) — reduces preload, worsens dynamic LVOT obstruction.
-
A patient with confirmed IE is being treated with IV antibiotics for 4 days. They develop new complete heart block. What is the diagnosis and management?
- Answer: Periaortic abscess (aortic root extension of endocarditis). This requires EMERGENCY cardiac surgery.
Paper 2 SAQ-style:
Q: A 40-year-old woman with known rheumatic MS presents to A&E with acute pulmonary oedema, heart rate 140 bpm (irregularly irregular). She is on warfarin but recent INR was 1.6. Describe your immediate management.
Model Answer:
- ABCDE approach - O2, monitoring, IV access
- Rate control: IV metoprolol 2.5-5mg or IV diltiazem (avoid digoxin if hypotensive)
- Cautious IV furosemide 40mg for pulmonary oedema
- Avoid excessive diuresis (MS = preload dependent)
- Anticoagulation: LMWH or IV heparin (INR subtherapeutic → high stroke risk with AF in MS)
- DC cardioversion only if haemodynamically unstable after rate control attempt, but check TOE first if stable (LA thrombus risk)
- TOE when stable to exclude LA thrombus
- Long-term: optimise warfarin (target INR 2.5-3.5); discuss PMBV if valve suitable
🚨 RED FLAGS BOX
| Red Flag | Condition | Action |
|---|
| New fever + new murmur in any patient | IE | Blood cultures x3, urgent Echo, IE team referral |
| New complete heart block in IE patient | Aortic root abscess | Emergency surgery |
| Exertional syncope + harsh ESM | Severe AS | Urgent echo, no reassurance - surgical referral |
| Flash pulmonary oedema post-MI + NO murmur | Acute MR (papillary rupture) | Echo urgently - don't be reassured by absence of murmur |
| SBP drop >10mmHg on inspiration | Cardiac tamponade | Emergency echo + pericardiocentesis |
| JVP rises on inspiration | Constrictive pericarditis (Kussmaul's) | Echo, CT, TB exclusion, surgical referral |
| Young athlete + exertional syncope + ESM increasing with Valsalva | HCM | Echo, restrict exercise, ICD assessment |
| Low-voltage ECG + echo LVH | Cardiac amyloidosis | SPEP, BJP, CMR with gadolinium |
| MS patient + new AF | Acute decompensation risk + stroke | Urgent rate control + anticoagulation |
| Strep. bovis IE | Colorectal carcinoma | Colonoscopy before discharge |
| Haemoptysis + MS in HK immigrant | Consider TB (± rheumatic disease) | CXR, sputum AFB, Echo |
🔬 BASIC SCIENCE INTEGRATION BOX (Additional)
Molecular mimicry in ARF: GAS M-protein peptides share sequence homology with human cardiac myosin. Anti-M protein antibodies cross-react with cardiac myosin, N-acetylglucosamine (group A carbohydrate), tropomyosin, and valvular tissue. This triggers T-cell and antibody-mediated cardiac injury.
Why mitral valve is most affected in RHD: The mitral valve bears the highest closure pressure (systolic LV pressure ~120mmHg vs RV ~25mmHg). Repeated immune-mediated valve injury in a high-pressure environment leads to progressive fibrosis and dysfunction.
Virchow's Triad applied to IE: (1) Endothelial damage (valve disease, jet lesion) + (2) Hypercoagulable state (sterile vegetation = platelet-fibrin) + (3) Bacteremia (any source) = IE risk.
Laplace's Law in AS: Wall stress = Pressure × Radius / (2 × Wall thickness). AS increases pressure → LV hypertrophies (increases wall thickness) to normalise wall stress → concentric LVH.
Austin Flint mechanism: In severe AR, the regurgitant jet impinges on the anterior mitral leaflet, partially closing the mitral valve in diastole → functional mitral stenosis → mid-diastolic rumble (Austin Flint murmur). Clue: NO opening snap (mitral leaflets not fused).
Pulsus paradoxus mechanism: Normal inspiration → ↑ RV filling (↑ venous return) → RV expands → interventricular septum bows leftward → LV compliance ↓ → LV stroke volume ↓ → SBP drops slightly (<10mmHg normal). In tamponade, this exaggerated because: fixed pericardial volume → RV expansion during inspiration takes away from LV (ventricular interdependence). Result: SBP drops >10mmHg on inspiration = pulsus paradoxus.
🏢 HA CLINICAL PATHWAY - SUMMARY TABLE
| Condition | HA Standard | Notes |
|---|
| Severe symptomatic AS | Heart Team discussion for TAVI vs SAVR | Major centres: QMH, PWH, Grantham, Pamela Youde |
| Rheumatic MS | PMBV preferred (Wilkins ≤8) in Asian rheumatic MS | TOE mandatory before PMBV |
| MS-related AF anticoagulation | Warfarin INR 2.5-3.5 | DOACs not recommended |
| Mechanical valve anticoagulation | Warfarin ONLY | DOACs absolutely contraindicated |
| Rheumatic fever prophylaxis | Benzathine penicillin G 1.2 MU IM q3-4 weeks | Duration based on severity of valve disease |
| IE management | Multidisciplinary IE team; blood cultures before antibiotics | MRSA: Vancomycin; MSSA: Cloxacillin/Flucloxacillin |
| TB pericarditis | Anti-TB + prednisolone; notify DH (Cap. 599 TB) | ~40/100,000 TB notification rate in HK |
| HCM + SCD risk | ICD implantation per AHA/ESC HCM-SCD risk calculator | Mavacamten available in HK formulary |
Sources: Braunwald's Heart Disease (10e/12e), Robbins & Kumar Basic Pathology, Goldman-Cecil Medicine, Grainger & Allison's Diagnostic Radiology, Robbins Cotran & Kumar Pathologic Basis of Disease, Firestein & Kelley's Textbook of Rheumatology, ESC/EACTS 2021 VHD Guidelines, ACC/AHA 2021 VHD Guidelines, ESC 2021 IE Guidelines, CHP (Hong Kong) Notifiable Disease Data.Your complete ACE-level HKMLE Module 1D study note is above. Here's what's included:
What You Just Got
8 Major Sections covering every topic in your request:
- Aortic Stenosis - full SAD mnemonic, TAVI vs SAVR with PARTNER trial data, HK Heart Team pathway
- Aortic Regurgitation - all eponymous signs, Austin Flint trap, IABP contraindication
- Mitral Stenosis - Wilkins score, PMBV criteria, warfarin vs DOAC trap
- Mitral Regurgitation - Carpentier classification, acute vs chronic pathophysiology, LVEF 60% threshold
- Rheumatic Heart Disease - 2015 Jones criteria, penicillin prophylaxis durations, HK epidemiology
- Infective Endocarditis - Duke criteria, HACEK organisms, Klebsiella HK variant, Strep. bovis → colonoscopy
- Pericardial Disease - TB pericarditis (HK endemic), tamponade vs constriction, Kussmaul's sign
- Cardiomyopathies - HCM SAM/Valsalva trap, DCM/ATTR amyloid, Mavacamten
Special Elements Included:
- 15+ ⚠️ HKMLE TRAP boxes (most are Paper 1 MCQ killers)
- 🏢 HA Clinical Pathway boxes for TAVI, IE, RHD, PMBV, warfarin protocols
- 📋 CHP notification status (TB = notifiable; ARF = NOT notifiable in HK under Cap. 599)
- 🌏 Local variants: Klebsiella IE, rheumatic MS in HK immigrants, TB pericarditis, ATTR amyloid in elderly
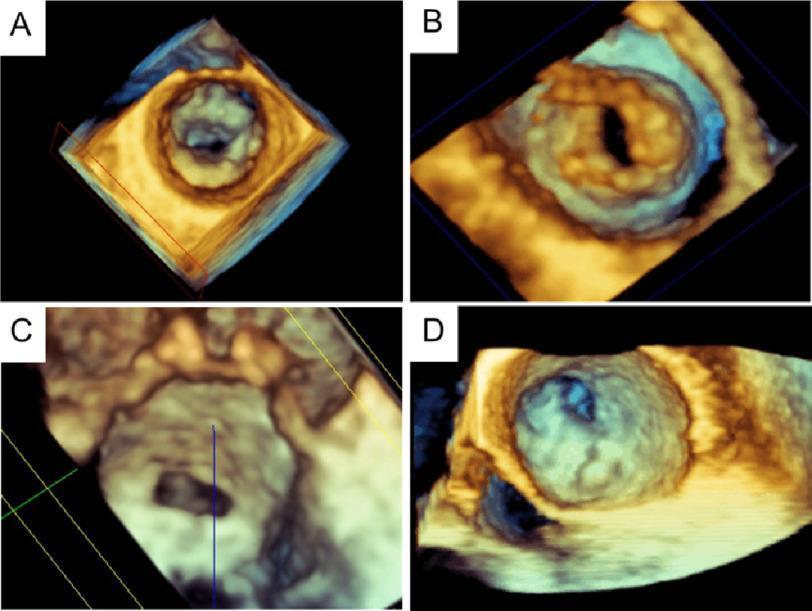
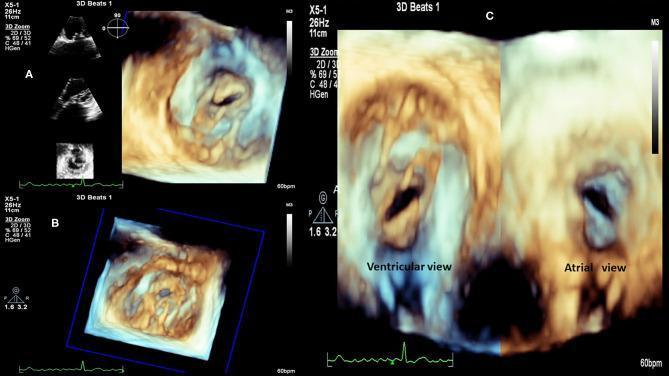
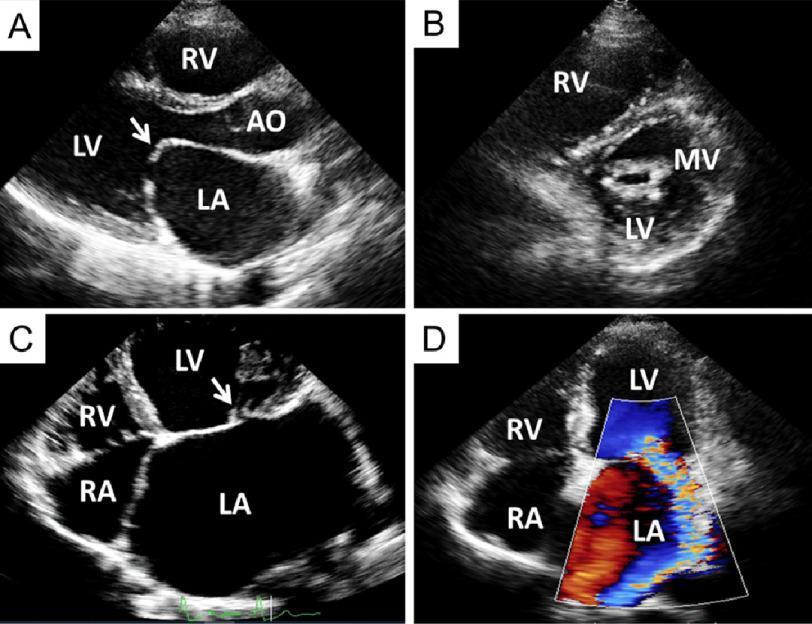
- Real clinical Echo images embedded (AS continuity equation, HCM SAM, rheumatic MS fish-mouth, IE peripheral stigmata)
- Drug Traps table, Notable Trials table, Master Mnemonics table, Cross-Module Links