Case control study and cohort study ,give full detailed explanation and long answer from park
Reading File
Finding Sources
Finding Sources
Reading File
Reading File
Reading File
Reading File
Reading File
Reading File
Reading File
Reading File
Reading File
Reading File
Reading File
Reading File
Loading Image
Loading Image
Finding Sources
I have everything needed. Now let me compile the full comprehensive answer from Park's textbook.
Case Control Study and Cohort Study
Park's Textbook of Preventive and Social Medicine
PART I: CASE CONTROL STUDY
Definition and Nature
Case control studies, often called "retrospective studies," are a common first approach to test causal hypotheses. In recent years, the case control approach has emerged as a permanent method of epidemiological investigation. The case control method has three distinct features:
- a. Both exposure and outcome (disease) have occurred before the start of the study
- b. The study proceeds backwards from effect to cause
- c. It uses a control or comparison group to support or refute an inference
By definition, a case control study involves two populations - cases and controls. The unit is the individual rather than the group. The focus is on a disease or some other health problem that has already developed.
Case control studies are basically comparison studies. Cases and controls must be comparable with respect to known "confounding factors" such as age, sex, occupation, social status, etc. The questions asked relate to personal characteristics and antecedent exposures which may be responsible for the condition studied. Case control studies have been used effectively for studies of many cancers, and other serious conditions such as cirrhosis of the liver, lupus erythematosus, and congestive heart failure.
Design of a Case Control Study (Fig. 8)
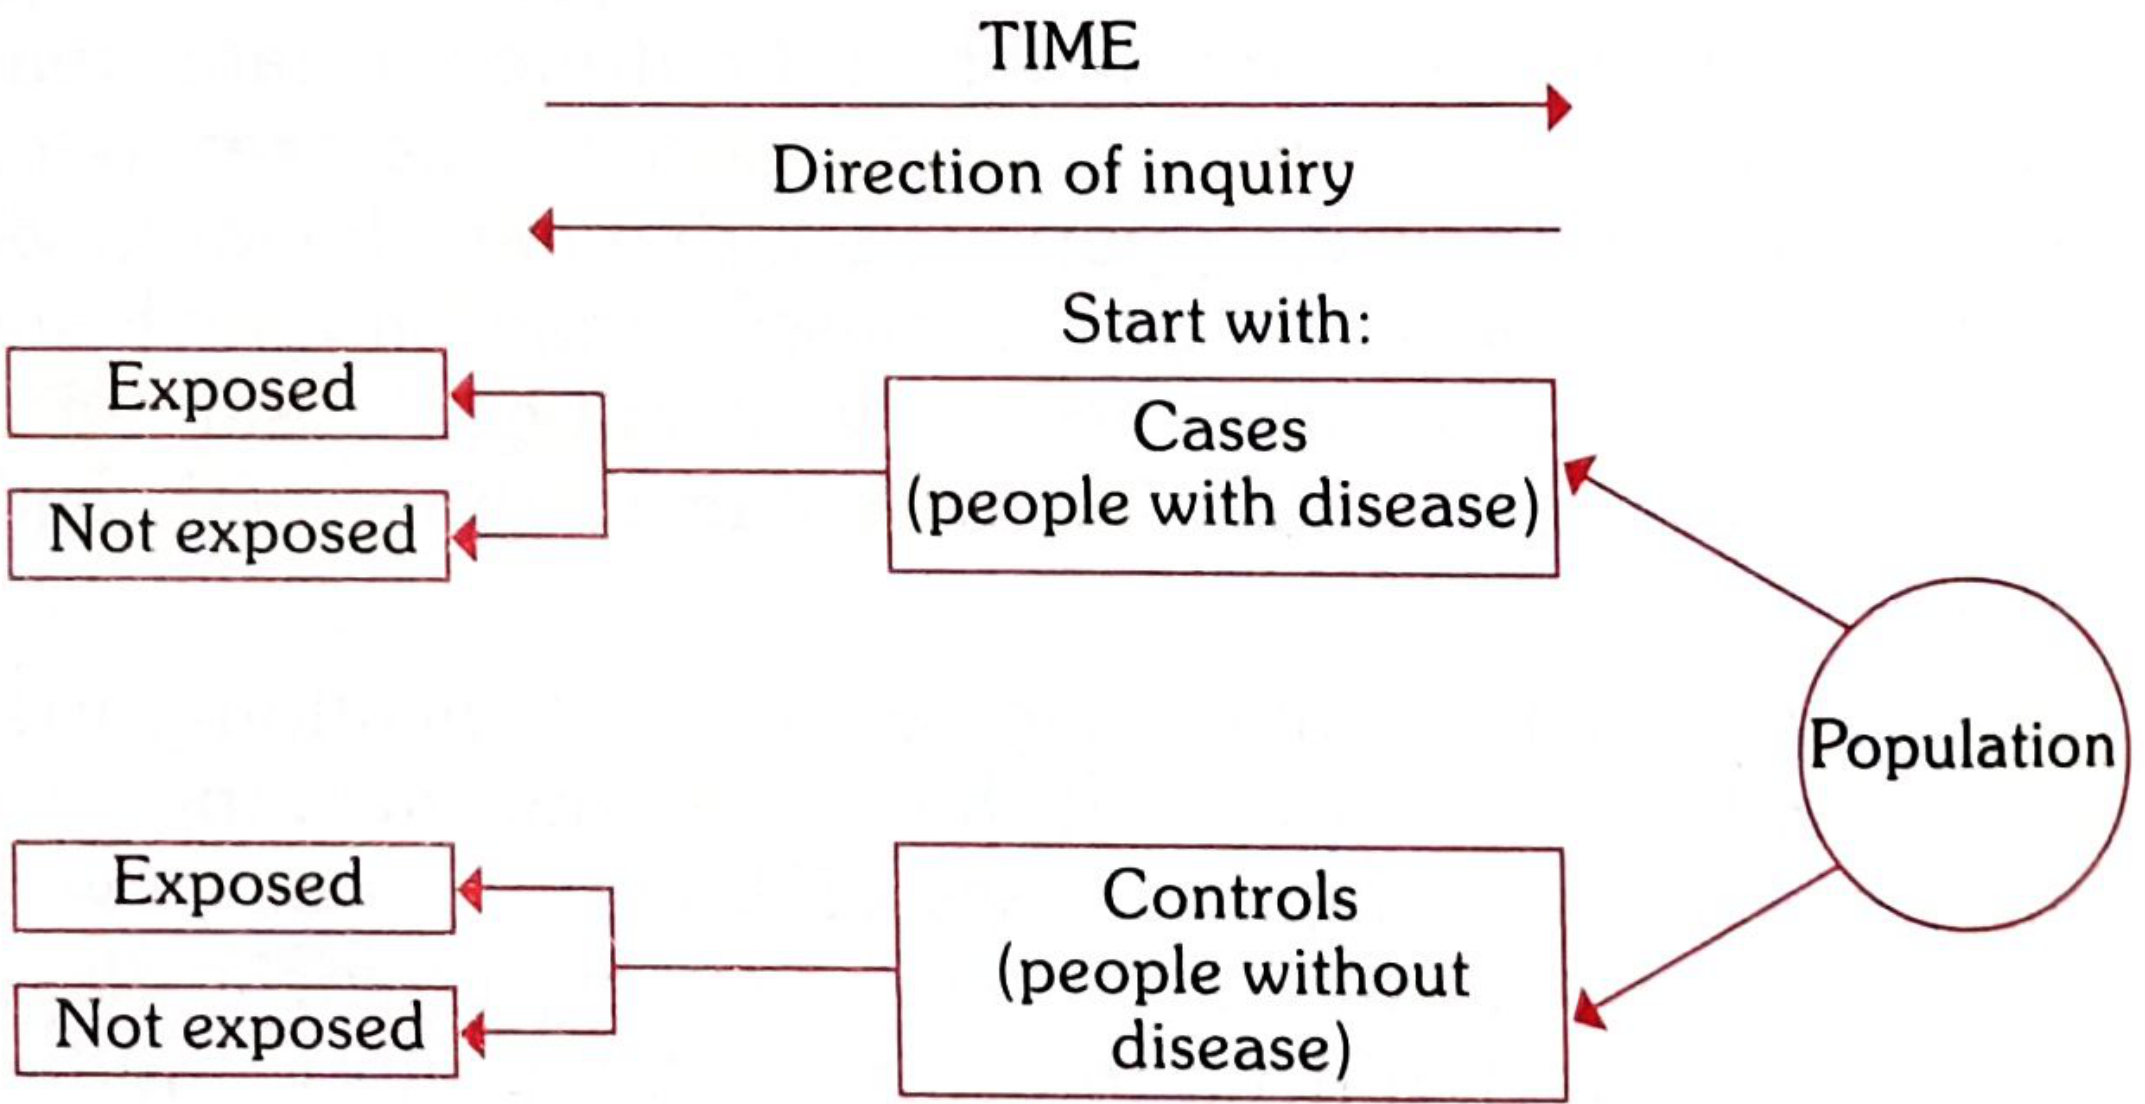
FIG. 8 (Case Control arm) - The direction of inquiry proceeds BACKWARDS in time - from disease status back to exposure history.
The basic design is the 2 x 2 contingency table (Table 11):
| Suspected Risk Factor | Cases (Disease Present) | Controls (Disease Absent) |
|---|---|---|
| Present | a | b |
| Absent | c | d |
| Total | a+c | b+d |
Illustrative example: To test the hypothesis that "cigarette smoking causes lung cancer," the investigation begins by assembling a group of lung cancer cases (a+c), and a group of suitably matched controls (b+d). One then explores the past history of both groups for the presence or absence of smoking. If the frequency of smoking, a/(a+c), is higher in cases than in controls b/(b+d), an association is said to exist between smoking and lung cancer.
Case control studies have their major use in the chronic disease problem when the causal pathway may span many decades.
Basic Steps in a Case Control Study
There are four basic steps:
- Selection of cases and controls
- Matching
- Measurement of exposure
- Analysis and interpretation
Step 1: Selection of Cases and Controls
(1) Selection of Cases
(a) Definition of a case: The prior definition of what constitutes a "case" requires two specifications:
- (i) Diagnostic criteria: The diagnostic criteria of the disease and the stage of disease must be specified before the study is undertaken. If investigating cancer, we must have histologically the same group. Once diagnostic criteria are established, they should not be altered or changed until the study is over.
- (ii) Eligibility criteria: A criterion customarily employed is the requirement that only newly diagnosed (incident) cases within a specified period of time are eligible - rather than old cases or cases in advanced stages (prevalent cases).
(b) Sources of cases: Cases may be drawn from:
- (i) Hospitals: It is often convenient to select cases from a single hospital or a network of hospitals admitted during a specified period. The entire case series or a random sample is selected.
- (ii) General population: In a population-based case control study, all cases of the study disease occurring within a defined geographic area during a specified period are ascertained - often through a survey, a disease registry, or hospital network. Cases should be fairly representative of all cases in the community.
(2) Selection of Controls
The controls must be free from the disease under study. They must be as similar to the cases as possible, except for the absence of the disease under study. Sources of controls include:
- Hospital controls: Other patients in the same hospital who do not have the disease under study. This is convenient but they may not represent the general population.
- General population controls: More representative but harder to obtain.
- Relatives and associates: Spouses, siblings, neighbors, or workmates of cases.
- Multiple control groups: Using more than one control group strengthens the study.
Step 2: Matching
Matching is the process of selecting controls so that they are similar to cases in certain characteristics such as age, sex, occupation, social status, etc. Matching is done to eliminate the effect of confounding variables.
Examples of confounding:
(a) In the study of the role of alcohol in the etiology of esophageal cancer, smoking is a confounding factor because: (i) it is associated with the consumption of alcohol and (ii) it is an independent risk factor for esophageal cancer. The effects of alcohol consumption can be determined only if the influence of smoking is neutralized by matching.
(b) Age could be a confounding variable. If women taking steroid contraceptives were younger than those in the comparison group, they would necessarily be at lower risk of breast cancer - since this disease becomes increasingly common with increasing age. This "confounding" effect of age can be neutralized by matching.
Important rule: The suspected aetiological factor or the variable we wish to measure should NOT be matched, because by matching, its aetiological role is eliminated in that study.
Types of matching:
- Group matching (frequency matching): Cases are assigned to sub-categories (strata) based on characteristics, and appropriate controls are established.
- Individual matching (pair matching): For each case, one control is chosen which can be matched closely. For example, for a 50-year-old mason with a disease, we search for a 50-year-old mason without the disease.
Caution: If matching is overdone, it may be difficult to find controls. Excess zeal in matching may reduce the odds ratio.
Step 3: Measurement of Exposure
Definitions and criteria about exposure are just as important as those used to define cases and controls. Information about exposure should be obtained in precisely the same manner both for cases and controls. This may be obtained by:
- Interviews
- Questionnaires
- Studying past records (hospital records, employment records, etc.)
It is important to recognize that bias or systematic error is the most important factor to be considered when case-control studies are used to test associations - even more important than the P values obtained.
Step 4: Analysis
(a) Exposure Rates
A case control study provides a direct estimation of the exposure rates (frequency of exposure) to a suspected factor in disease and non-disease groups.
Example (Table 12) - Smoking and Lung Cancer:
| Cases (with lung cancer) | Controls (without lung cancer) | Total | |
|---|---|---|---|
| Smokers (<5 cigarettes/day) | 33 (a) | 55 (b) | 88 |
| Non-smokers | 2 (c) | 27 (d) | 29 |
| Total | 35 | 82 | n |
Exposure rates:
- Cases = a/(a+c) = 33/35 = 94.2%
- Controls = b/(b+d) = 55/82 = 67.0%
- P < 0.001 - statistically significant
The test of significance for discrete variables (as in the present case) is usually the Chi-square test or the standard error of difference between two proportions. If P ≤ 0.05, it is regarded as "statistically significant." However, statistical association does not imply causation.
(b) Estimation of Risk - The Odds Ratio
A typical case control study does not provide incidence rates from which relative risk can be calculated directly, because there is no appropriate denominator or population at risk. Instead, from a case control study we derive the Odds Ratio (OR) - also called the cross-product ratio:
Odds Ratio = ad / bc
Using Table 12 data:
OR = (33 × 27) / (55 × 2) = 891/110 = 8.1
Smokers of less than 5 cigarettes per day showed a risk of having lung cancer 8.1 times that of non-smokers. The Odds Ratio is a key parameter in the analysis of case control studies.
Bias in Case Control Studies
Bias is any systematic error in the determination of the association between exposure and disease. Types include:
- (a) Bias due to confounding: Controlled by matching in case control studies.
- (b) Memory or recall bias: Cases may be more likely to recall certain events or factors than controls who are healthy persons. Cases may have a different recall of past events than controls.
- (c) Selection bias: Cases and controls may not be representative of the general population. There may be systematic differences in characteristics between cases and controls. Best controlled by prevention.
- (d) Berkesonian bias (Berkeson's bias): Named after Dr. Joseph Berkeson who recognized this problem. The bias arises because of different rates of admission to hospitals for people with different diseases (i.e., hospital cases and controls).
- (e) Interviewer's bias: Occurs when the interviewer knows the hypothesis and who the cases are. This may lead to more thorough questioning of cases than controls regarding a positive history. Eliminated by double-blinding.
Advantages and Disadvantages of Case Control Studies (Table 13)
ADVANTAGES
- Relatively easy to carry out
- Rapid and inexpensive (compared with cohort studies)
- Require comparatively few subjects
- Particularly suitable to investigate rare diseases or diseases about which little is known
- No risk to subjects
- Allows the study of several different aetiological factors simultaneously (e.g., smoking, physical activity and personality characteristics in myocardial infarction)
- Risk factors can be identified; rational prevention and control programmes can be established
- No attrition problems - case control studies do not require follow-up of individuals into the future
- Ethical problems minimal
DISADVANTAGES
- Relies on recall or records for information about past exposure - information may be incomplete and inaccurate
- Validation of information is difficult, sometimes impossible
- Control of extraneous variables may be incomplete
- Selection of an appropriate control group may be difficult
- Not suitable for rare exposures (but suitable for rare diseases)
- Incidence rates cannot be calculated
- Provides only an indirect measure of risk (Odds Ratio) - not relative risk directly
- Temporal relationship between exposure and disease may be difficult to establish
Classic Examples of Case Control Studies
Example 1: Adenocarcinoma of vagina and DES (1971)
An excellent example is the study of adenocarcinoma of the vagina in young women. There was an unusual occurrence of this tumor in 7 young women (15-22 years) born in one Boston hospital between 1966-1969. As this was a rare disease, for each case, four matched controls were identified from birth records. Information was collected about maternal age, smoking, antenatal radiology, and diethylstilbestrol (DES) exposure in fetal life.
| Information | Cases (8) | Controls (32) | Significance |
|---|---|---|---|
| Maternal age | 26.1 | 29.3 | n.s. |
| Maternal smoking | 7 | 21 | n.s. |
| Antenatal radiology | 1 | 4 | n.s. |
| Oestrogen (DES) exposure | 7 | 0 | P < 0.00001 |
Seven of the eight cases had been exposed to DES in fetal life - given to their mothers during the first trimester to prevent possible miscarriage. None of the mothers in the control group had received DES. The case control method played a critical role in revealing exposure to DES in utero as the cause of vaginal adenocarcinoma 10-20 years later.
Example 2: Oral contraceptives and thromboembolic disease (1965)
By August 1965, the British Committee on Safety of Drugs received reports of thromboembolic disease among young women on oral contraceptives. Case control studies confirmed this association. These were among the earliest pharmacoepidemiological case control investigations.
Other notable case control studies include: cigarette smoking and lung cancer, maternal smoking and congenital malformations, radiation and leukemia, oral contraceptive use and hepatocellular adenoma, herpes simplex and Bell's palsy, artificial sweeteners and bladder cancer.
PART II: COHORT STUDY
Definition and Nature
Cohort study is another type of analytical (observational) study which is usually undertaken to obtain additional evidence to refute or support the existence of an association between suspected cause and disease.
Cohort study is known by a variety of names: prospective study, longitudinal study, incidence study, and forward-looking study. The most widely used term, however, is "cohort study."
The distinguishing features of cohort studies are:
- a. The cohorts are identified prior to the appearance of the disease under investigation
- b. The study groups are observed over a period of time to determine the frequency of disease among them
- c. The study proceeds forward from cause to effect
A well-designed cohort study is considered the most reliable means of showing an association between a suspected risk factor and subsequent disease because it eliminates many of the problems of the case control study and approximates the experimental model of the physical sciences.
Design of a Cohort Study (Fig. 8)
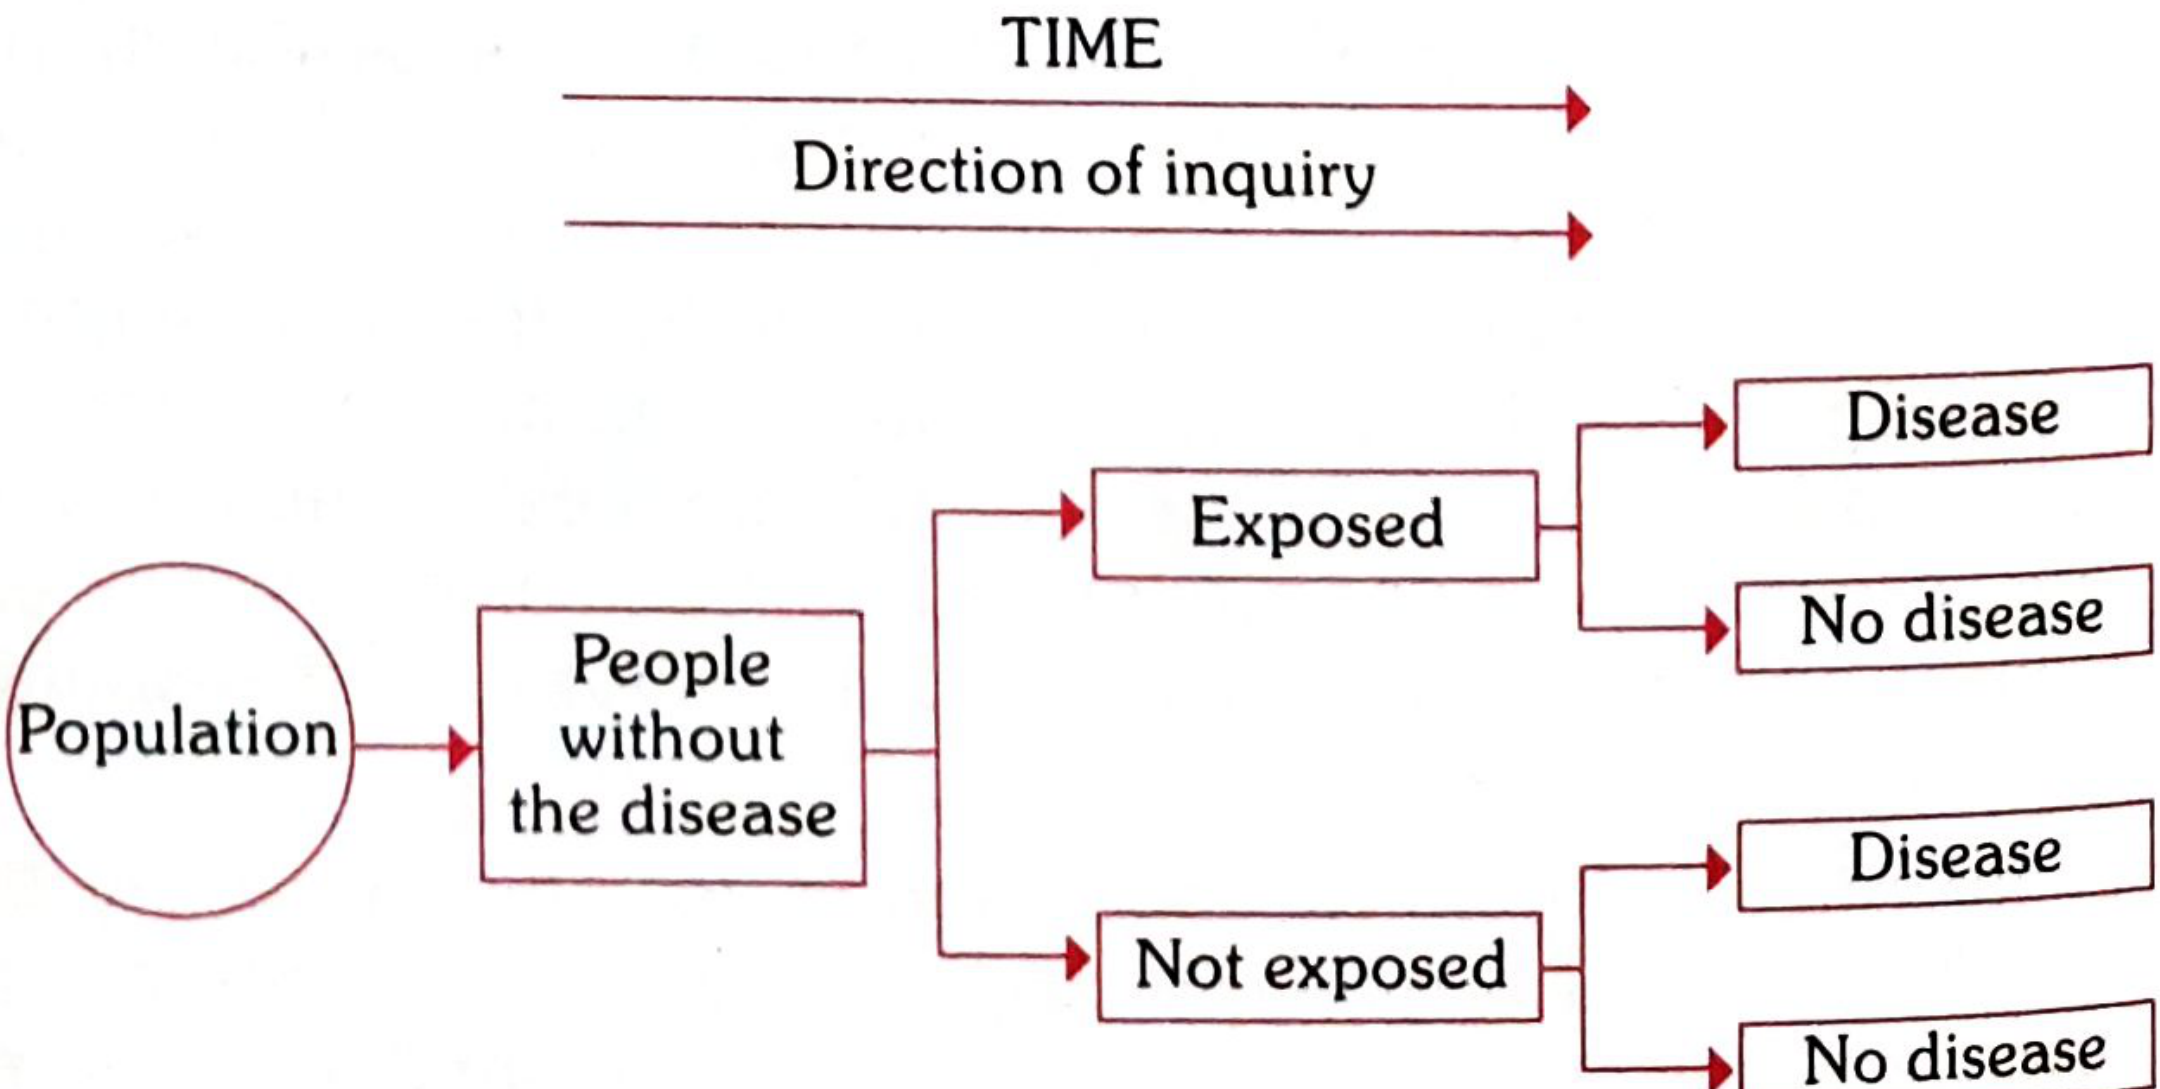
FIG. 8 (Cohort arm) - The direction of inquiry proceeds FORWARD in time - from exposure status toward disease outcome.
Concept of Cohort
In epidemiology, the term "cohort" is defined as a group of people who share a common characteristic or experience within a defined time period (e.g., age, occupation, exposure to a drug or vaccine, pregnancy, insured persons, etc.).
- A group of people born in the same period form a "birth cohort" - e.g., all those born in 2010 form the birth cohort of 2010.
- Persons exposed to a common drug, vaccine, or infection within a defined period constitute an "exposure cohort."
- A group of males or females married in the same period form a "marriage cohort."
- A cohort might be all those who survived a myocardial infarction in one particular year.
The comparison group may be the general population from which the cohort is drawn, or it may be another cohort of persons thought to have had little or no exposure to the substance, but otherwise similar.
Indications for Cohort Studies
Cohort studies are indicated:
- (a) When there is good evidence of an association between exposure and disease, as derived from clinical observations and supported by descriptive and case control studies
- (b) When exposure is rare, but the incidence of disease is high among the exposed - e.g., special exposure groups like those in industries, exposure to X-rays, etc.
- (c) When attrition of study population can be minimized - follow-up is easy, cohort is stable, cooperative, and easily accessible
- (d) When ample funds are available
Framework of a Cohort Study (Table 16)
In contrast to case control studies which proceed from "effect to cause," the basic approach in cohort studies is to work from "cause to effect." In a cohort study, the exposure has occurred, but the disease has not.
We begin with:
- A group or cohort (a+b) exposed to a particular factor thought to be related to disease occurrence - the "study cohort"
- A group (c+d) not exposed - the "control cohort"
Table 16: Framework of a cohort study
| Cohort | Disease: Yes | Disease: No | Total |
|---|---|---|---|
| Exposed to putative aetiological factor | a | b | a+b |
| Not exposed to putative aetiological factor | c | d | c+d |
General considerations when assembling cohorts:
- (a) The cohorts must be free from the disease under study at the start - those who already have evidence of the disease are excluded
- (b) Both the groups should be equally susceptible to the disease under study
- (c) Both the groups should be comparable in respect of all possible variables which may influence frequency of disease
- (d) The diagnostic and eligibility criteria of the disease must be defined beforehand
The groups are then followed over a period of time to determine the outcome (onset of disease, disability, or death) in both groups. If it is found that the incidence of the disease in the exposed group, a/(a+b), is significantly higher than in the non-exposed group, c/(c+d), it would suggest that the disease and suspected cause are associated.
Types of Cohort Studies
Three types of cohort studies have been distinguished on the basis of the time of occurrence of disease in relation to the time at which the investigation is initiated:
1. Prospective Cohort Studies ("Current" Cohort Study)
A prospective cohort study is one in which the outcome (e.g., disease) has not yet occurred at the time the study is initiated. The investigator identifies and assembles the cohort, records data on exposure and baseline characteristics, and then follows the cohort forward in time to determine who develops the disease.
Classic example: Doll and Hill's study on British doctors - a cohort of all British doctors listed in the Medical Register of the UK in 1951 was followed forward over time to study the relationship between smoking and lung cancer.
Characteristics:
- Incidence rates can be directly calculated
- True temporal relationship can be established
- Time-consuming and expensive
- Applicable to common diseases
2. Retrospective Cohort Studies ("Historical" Cohort Study)
A retrospective cohort study is one in which all outcomes have already occurred before the start of the investigation. The investigator goes back in time - sometimes 10 to 30 years - to select study groups from existing records of past employment, medical, or other records, and traces them forward through time from a past date usually up to the present.
Also known as: historical cohort study, prospective study in retrospect, non-concurrent prospective study.
Classic example: A cohort study undertaken in 1978 - a cohort of 17,080 babies born between January 1, 1969 and December 31, 1975 at a Boston hospital was investigated for the effects of electronic fetal monitoring during labor. The neonatal death rate was 1.7 times higher in unmonitored infants. The most notable retrospective cohort studies are those of occupational exposures - study of the role of arsenic in human carcinogenesis, study of lung cancer in uranium miners, study of mortality of physicians in relation to radiation exposure, angiosarcoma of the liver in relation to poly-vinyl chloride (PVC) workers.
Characteristics:
- More economical and produce results more quickly than prospective cohort studies
- Dependent on the quality and completeness of past records
3. Combination of Retrospective and Prospective Cohort Studies
Both retrospective and prospective elements are combined. The cohort is identified from past records and assessed to date for the outcome. The same cohort is then followed prospectively into the future for further assessment.
Classic example: Court-Brown and Doll (1957) assembled a cohort in 1955 consisting of 13,352 patients who had received large doses of radiation therapy for ankylosing spondylitis between 1934 and 1954. The outcome evaluated was death from leukemia or aplastic anemia between 1935-1954. The death rate from leukemia or aplastic anemia was substantially higher in their cohort than in the general population. A prospective component was then added to the study and the cohort was followed from 1955 to identify deaths occurring in subsequent years.
Elements of a Cohort Study
The elements of a cohort study are:
- Selection of study subjects
- Obtaining data on exposure
- Selection of comparison groups
- Follow-up
- Analysis
1. Selection of Study Subjects
The subjects of a cohort study are usually assembled in one of two ways:
(a) General population: When the exposure or cause of death is fairly frequent in the population, cohorts may be assembled from the general population residing in well-defined geographical, political and administrative areas. The most famous example is the Framingham Heart Study. If the population is very large, an appropriate sample is taken so that results can be generalized. The exposed and unexposed segments should be representative of the corresponding segments of the general population.
(b) Special groups:
- (i) Select groups: Professional groups (doctors, nurses, lawyers, teachers, civil servants), insured persons, obstetric population, college alumni, government employees, volunteers, etc. These are usually homogeneous populations. Doll's prospective study on smoking and lung cancer was carried out on British doctors listed in the Medical Register in 1951. Dorn's study on smoking and mortality involved 293,658 veterans in the US with life insurance policies. These groups are not only homogeneous but offer advantages of accessibility and easy follow-up for a protracted period.
- (ii) Exposure groups: If the exposure is rare, a cohort of persons known to have experienced the exposure is selected. Cohorts may be selected because of special exposure to physical, chemical, and other disease agents. A readily accessible source is workers in industries and those in high-risk situations (e.g., radiologists exposed to X-rays). When cohorts are selected for special exposure, it facilitates classification of cohort members according to the degree or duration of exposure.
2. Obtaining Data on Exposure
Information about exposure may be obtained from:
- (a) Cohort members directly: through personal interviews or mailed questionnaires (Doll and Hill used mailed questionnaires to collect smoking histories from British doctors)
- (b) Review of records: Certain information (dose of radiation, kinds of surgery, details of medical treatment) can be obtained only from medical records
- (c) Medical examination or special tests: blood pressure, serum cholesterol, ECG
- (d) Environmental surveys: Best source for obtaining information on exposure levels of the suspected factor in the environment where the cohort lived or worked
Information should be collected to allow classification of cohort members:
- (a) according to whether or not they have been exposed to the suspected factor
- (b) according to the level or degree of exposure (at least in broad classes)
Basic information about demographic variables which might affect disease frequency should also be collected for subsequent analysis.
Advantages and Disadvantages of Cohort Studies
ADVANTAGES
- Temporality is clear - the study proceeds from cause (exposure) to effect (disease), so the temporal relationship between exposure and outcome is established
- Incidence rates can be directly computed in both exposed and non-exposed groups
- Relative risk can be directly calculated (not just estimated via odds ratio)
- The cohort study can simultaneously examine the relationship between one exposure and multiple outcomes (diseases)
- Allows the direct study of natural history of disease
- Avoids recall bias - information about exposure is collected before the disease develops
- Less susceptible to selection bias than case control studies
- Good for rare exposures (in contrast to case control studies which are good for rare diseases)
- A well-designed cohort study approximates the experimental model
DISADVANTAGES
- Time-consuming and expensive - chronic diseases may require follow-up over many decades
- Requires large numbers of subjects
- Attrition (drop-out) problem - subjects may be lost to follow-up over time, which can introduce bias
- Changes in methods of disease diagnosis or classification may occur during the long follow-up period, making it difficult to compare early and late findings
- Not suitable for rare diseases - a very large cohort would be needed to yield even a small number of cases
- Not suitable when the latent period is very long (e.g., decades for some cancers)
- Ethical issues may arise - the study group is knowingly exposed to a suspected harmful factor
- Expensive to maintain and sustain over a long time
Classic Examples of Cohort Studies
- Framingham Heart Study - one of the most famous cohort studies, examining risk factors for coronary heart disease in the general population of Framingham, Massachusetts
- Doll and Hill (1951) - British Doctors Study on smoking and lung cancer - followed 34,000 British doctors registered with the Medical Register
- Dorn's Study - 293,658 US veterans with life insurance policies followed for smoking and mortality
- Court-Brown and Doll (1957) - ankylosing spondylitis patients irradiated for treatment - study of radiation and leukemia
KEY COMPARISON: Case Control vs. Cohort Study
| Feature | Case Control Study | Cohort Study |
|---|---|---|
| Starting point | Disease (cases) | Exposure |
| Direction | Backward (effect → cause) | Forward (cause → effect) |
| Also known as | Retrospective study | Prospective/longitudinal study |
| Measure of association | Odds Ratio (OR) | Relative Risk (RR) |
| Incidence rates | Cannot be calculated | Can be directly calculated |
| Suitable for | Rare diseases | Rare exposures |
| Time and cost | Less time, less expensive | More time, very expensive |
| Subjects needed | Few | Large numbers |
| Recall bias | Present (major limitation) | Not a problem |
| Attrition | Not a problem | Major problem |
| Multiple exposures | Can study multiple exposures | Can study multiple outcomes |
| Evidence of temporal relationship | Difficult to establish | Clearly established |
Source: Park's Textbook of Preventive and Social Medicine (Park K), Chapter on Epidemiology - Analytical Studies
All about Bias
Finding Sources
Finding Sources
Finding Sources
Finding Sources
Finding Sources
Finding Sources
Reading File
Finding Sources
Reading File
Finding Sources
Finding Sources
Reading File
Reading File
Reading File
I now have all the content I need from Park's on bias. Let me compile the full, comprehensive answer.
All About Bias
From Park's Textbook of Preventive and Social Medicine
DEFINITION OF BIAS
Bias is any systematic error in the determination of the association between the exposure and disease. The relative risk estimate may increase or decrease as a result of the bias; it reflects some type of non-comparability between the study and control groups. The possibility of bias must be considered when evaluating a possible cause and effect relationship.
Bias is distinct from random error (chance). While random error decreases with larger sample size, bias is a directional error - it does not cancel out with increasing numbers. It leads to results that are consistently wrong in a particular direction.
TYPES OF BIAS IN EPIDEMIOLOGICAL STUDIES
Park classifies the main varieties of bias arising in epidemiological studies as follows:
1. Bias Due to Confounding (Confounding Bias)
Confounding is one of the most important sources of bias in epidemiological studies.
A confounder is a variable that is:
- Associated with the exposure under study, AND
- An independent risk factor for the disease under study
- NOT in the causal pathway between the exposure and the disease
Example 1: In the study of the role of alcohol in the aetiology of esophageal cancer, smoking is a confounding factor because:
- It is associated with the consumption of alcohol
- It is an independent risk factor for esophageal cancer
In this situation, the effects of alcohol consumption can be determined only if the influence of smoking is neutralized.
Example 2: In the investigation of the relationship between steroid contraceptives and breast cancer, age could be a confounding variable. If the women taking contraceptives were younger than those in the comparison group, they would necessarily be at lower risk of breast cancer - since this disease becomes increasingly common with increasing age. This "confounding" effect of age must be neutralized.
Control of confounding bias:
- In case control studies: By matching - selecting controls similar to cases on known confounding variables (age, sex, occupation, social status, etc.)
- In cohort studies: By ensuring comparable groups
- In analysis: By stratification or multivariate analysis
- In experimental studies: By randomization
Important rule regarding matching: The suspected aetiological factor or the variable under investigation should NOT be matched, because by matching it, its aetiological role is eliminated in that study. The cases and controls would then become automatically alike with respect to that factor, making it impossible to investigate.
2. Memory Bias (Recall Bias)
Recall bias occurs in retrospective/case control studies where information about past exposure is obtained from subjects.
When cases and controls are asked questions about their past history, it is more likely for the cases (diseased persons) to recall the existence of certain events or factors than controls who are healthy persons.
Example: Those who have had a myocardial infarction might be more likely to remember and recall certain habits or events (dietary patterns, stress levels, physical activity) than those who have not suffered from it. Thus cases may have a different recall of past events than controls.
This creates a systematic error because:
- Cases tend to over-report exposure (they search their memory for a "cause")
- Controls may under-report the same exposure (they have no motivation to recall carefully)
- The resulting odds ratio will be falsely elevated
Prevention: Recall bias can be minimized by:
- Using objective records (hospital records, employment records) rather than self-report
- Using standardized questionnaires
- Including questions about exposures that are not hypothesized to be related to the disease (to check for differential reporting)
- Prospective cohort designs are not subject to recall bias since exposure data is collected before the disease develops
3. Selection Bias
Selection bias occurs when cases and controls (or exposed and unexposed groups) are not representative of the general population from which they are drawn. There may be systematic differences in characteristics between cases and controls.
Causes of selection bias:
- The manner in which cases and controls are identified and recruited
- Volunteer bias: Those who agree to participate may differ systematically from those who do not
- Admission rate bias (see Berkesonian bias below)
- Survival bias (Prevalence-incidence bias / Neyman bias): If prevalent (existing) cases are used instead of incident (new) cases, the study may select for cases who have survived longer - who may have different exposures from those who died quickly
Control: Selection bias is best controlled by its prevention - through careful study design, use of incident cases rather than prevalent cases, and ensuring representative sampling of both cases and controls.
4. Berkesonian Bias (Berkson's Bias)
A special and important type of selection bias described by Park.
Named after Dr. Joseph Berkeson who first recognized and described this problem.
Mechanism: The bias arises because of the different rates of admission to hospitals for people with different diseases. When both cases and controls are selected from hospitals, this can create a spurious association (or mask a true one) because:
- People with two diseases are more likely to be hospitalized than people with one disease
- Hospital patients are not representative of the general population
- Controls drawn from the same hospital may share certain characteristics that make them non-comparable with population controls
Example: If we study the relationship between gallstones and diabetes using hospital cases and hospital controls - because both conditions cause hospitalization, diabetics with gallstones may be over-represented among hospital admissions compared to the general population. This would produce a spurious association.
Prevention:
- Use population-based controls rather than hospital controls
- Use multiple control groups - one hospital-based and one population-based - and compare results
5. Interviewer's Bias (Observer Bias / Information Bias)
Bias may occur when the interviewer knows the hypothesis and also knows who the cases are. This prior knowledge may lead the interviewer to:
- Question cases more thoroughly than controls regarding a positive history of the suspected causal factor
- Probe for more detail from cases
- Record ambiguous answers differently for cases vs. controls
Detection: A useful check on interviewer's bias can be made by noting the length of time taken to interview the average case and the average case. If interviews with cases consistently take longer, it suggests the interviewer is probing more deeply.
Control:
- Blinding the interviewer - the interviewer should not know whether the subject is a case or control ("single blinding")
- Double blinding - neither the interviewer nor the subject knows the hypothesis being tested
- Structured questionnaires with standardized questions and response categories
- Training and standardization of interviewers
6. Measurement Bias (Information Bias)
This is a broad category that occurs when information about exposure or outcome is systematically inaccurate. It can be:
- Differential: The error differs between cases and controls (more serious, leads to spurious associations)
- Non-differential: The error is the same in both groups (tends to bias results toward the null - i.e., makes associations appear weaker than they really are)
Sources include:
- Inaccurate diagnostic criteria
- Poorly designed questionnaires
- Faulty laboratory methods
- Inconsistent definitions of exposure
7. Lead Time Bias
Though not detailed by name in Park's introductory section, this is relevant to screening studies:
When screening detects a disease earlier in its course, survival appears to be prolonged even if the outcome is not changed. The "lead time" is the interval between early (screen-detected) diagnosis and the time when the disease would have been diagnosed symptomatically. If lead time is not accounted for, a screening program may appear to improve survival even if it does not.
8. Length Bias
In screening programs, slowly progressing cases of disease have a longer pre-clinical detectable phase and are therefore more likely to be picked up by a periodic screening test. Rapidly progressing, more aggressive disease is less likely to be detected. This means screen-detected cases are biased toward slower, less severe disease, leading to an overestimate of the benefit of screening.
BIAS IN SPECIFIC STUDY DESIGNS
Bias in Case Control Studies
The bias types described by Park specifically in the context of case control studies:
| Type of Bias | Mechanism | Control |
|---|---|---|
| Confounding bias | Presence of an extraneous variable associated with both exposure and disease | Matching (cases and controls matched on confounders) |
| Recall (memory) bias | Cases recall exposure more vividly than controls | Use objective records; structured questionnaires |
| Selection bias | Cases and controls not representative of their respective populations | Careful, systematic case and control selection; use incident cases |
| Berkesonian bias | Different hospital admission rates for different diseases create spurious associations | Use population-based controls; multiple control groups |
| Interviewer bias | Interviewer knows who the cases are and questions them more thoroughly | Double-blinding; standardized instruments |
Bias in Cohort Studies
Cohort studies are generally less susceptible to bias than case control studies, but the following can occur:
| Type of Bias | Mechanism | Control |
|---|---|---|
| Selection bias | The cohort may not be representative of the general population | Careful cohort assembly; representative sampling |
| Attrition bias (follow-up bias) | Those lost to follow-up may differ systematically from those who remain | Minimize loss to follow-up; analyze characteristics of those lost |
| Confounding bias | Extraneous variables in the exposed and unexposed cohorts | Careful study design; multivariate analysis |
| Diagnostic or surveillance bias | The exposed group may be examined more closely than the unexposed group, leading to detection of more disease | Standardized follow-up procedures; blinded outcome assessment |
Bias in Experimental Studies (Clinical Trials)
The key mechanism for controlling bias in experimental (interventional) studies is randomization, which controls for both known and unknown confounders. Additional control is achieved by blinding.
Types of blinding:
- Single blind: Subject does not know which treatment they are receiving
- Double blind: Neither subject nor investigator knows - this eliminates both subject bias (placebo effect, differential compliance) and observer bias (differential assessment of outcomes)
- Triple blind: Subject, investigator, AND data analyst are all blinded
CONFOUNDING - A DEEPER LOOK
Confounding deserves special emphasis as it is the most pervasive type of bias in observational epidemiology.
Criteria for a confounder:
- Must be associated with the exposure in the study population
- Must be an independent risk factor for the disease
- Must NOT be in the causal pathway between the exposure and the disease
How confounding distorts the true association:
- Positive confounding: The confounder makes the association appear stronger than it truly is
- Negative confounding: The confounder makes the association appear weaker than it truly is (can even mask a true association)
Methods to control confounding:
| Stage | Method |
|---|---|
| Design stage | Randomization (experimental studies only); Matching; Restriction (limiting study to a specific group, e.g., only males) |
| Analysis stage | Stratification (Mantel-Haenszel technique); Standardization; Multivariate analysis (logistic regression, Cox regression) |
IMPORTANCE OF BIAS IN EPIDEMIOLOGICAL INFERENCE
Park emphasizes that when case-control studies are being used to test associations, the most important factor to be considered - even more important than the P values obtained - is the question of "bias" or systematic error which must be ruled out.
This is because:
- Statistical significance (low P value) does not rule out bias
- A study can be highly statistically significant yet completely wrong due to systematic bias
- The validity of an epidemiological study depends on how well bias has been controlled
The critical distinction is:
- Random error (chance) - reduced by increasing sample size; expressed through P values and confidence intervals
- Systematic error (bias) - NOT reduced by increasing sample size; must be controlled at the design stage
A biased study with 10,000 subjects will give a more precisely wrong answer than a biased study with 100 subjects - larger sample size only reduces random error, never bias.
SUMMARY TABLE: Types of Bias in Epidemiology (Park)
| Bias | Definition | Study Design Most Affected | Control |
|---|---|---|---|
| Confounding bias | Extraneous variable distorts the exposure-disease relationship | All observational studies | Matching, restriction, stratification, multivariate analysis, randomization |
| Recall (memory) bias | Differential recall of exposure between cases and controls | Case control (retrospective) | Objective records, standardized questionnaires |
| Selection bias | Non-representative sampling of cases/controls | Case control, cross-sectional | Careful case definition, use of incident cases, representative controls |
| Berkesonian bias | Differential hospital admission rates create spurious association | Hospital-based case control | Population-based controls, multiple control groups |
| Interviewer bias | Differential questioning based on knowledge of case/control status | Case control | Double blinding, standardized tools |
| Attrition bias | Differential loss to follow-up | Cohort studies | Minimize dropout, analyze characteristics of lost subjects |
| Lead time bias | Earlier diagnosis falsely inflates survival duration | Screening studies | Measure age-specific or disease-specific mortality |
| Length bias | Screening preferentially detects slow-progressing disease | Screening studies | Randomized controlled trials of screening |
Source: Park's Textbook of Preventive and Social Medicine (Park K) - Chapter on Epidemiology, Analytical Studies & Research Methodology
This is a shared conversation. Sign in to Orris to start your own chat.