
What are the factors affecting the cardiac output? And the cardiac- ... the heart rate and the heart rate output of a person in rest, in exercise, and their graphs. Explain them in detail.
Reading File
Now let me search the medical library for cardiac output, heart rate, and exercise physiology content in parallel.
Finding Sources
Finding Sources
Searching the Web
cardiac output factors affecting heart rate rest exercise graphs physiology
Now let me read the most relevant textbook sections in parallel - Costanzo Physiology is the best source for this topic.
Reading File
Finding Sources
Finding Sources
Excellent sources found. Now let me read the Guyton & Hall and Costanzo sections on exercise cardiovascular responses in parallel.
Reading File
Reading File
Reading File
Great content. Let me now read the Costanzo section on factors affecting stroke volume and heart rate, and also fetch the key graphs from Guyton & Hall.
Reading File
Loading Image
Loading Image
Excellent! I have all the key information and graphs. Let me also fetch the Frank-Starling relationship graph and read the section on heart rate control factors from Costanzo.
Loading Image
Finding Sources
I now have comprehensive information and graphs from authoritative textbooks. Let me compile a detailed, well-structured answer.
Cardiac Output: Factors, Heart Rate, and Exercise Physiology
1. What is Cardiac Output?
Cardiac output (CO) is the total volume of blood ejected by one ventricle per minute. It is calculated as:
CO = Stroke Volume (SV) × Heart Rate (HR)
Normal resting values (70-kg man):
- Stroke Volume: ~70 mL/beat
- Heart Rate: ~72 beats/min
- Cardiac Output: ~5,000 mL/min (5 L/min)
(Costanzo Physiology 7th Edition, p. 155)
2. Factors Affecting Cardiac Output
Since CO = SV × HR, anything that affects either stroke volume or heart rate will affect cardiac output.
A. Factors Affecting STROKE VOLUME
Stroke volume is controlled by three key determinants:
1. Preload (End-Diastolic Volume)
Preload is the volume of blood filling the ventricle at the end of diastole (EDV). It is governed by the Frank-Starling Law of the Heart:
"The volume of blood ejected by the ventricle depends on the volume present in the ventricle at the end of diastole."
The more blood that returns to the heart (venous return), the more the myocardial fibers are stretched before contraction. Greater stretch = greater force of contraction = greater stroke volume. This is the length-tension relationship applied to cardiac muscle.
Frank-Starling Relationship Graph:
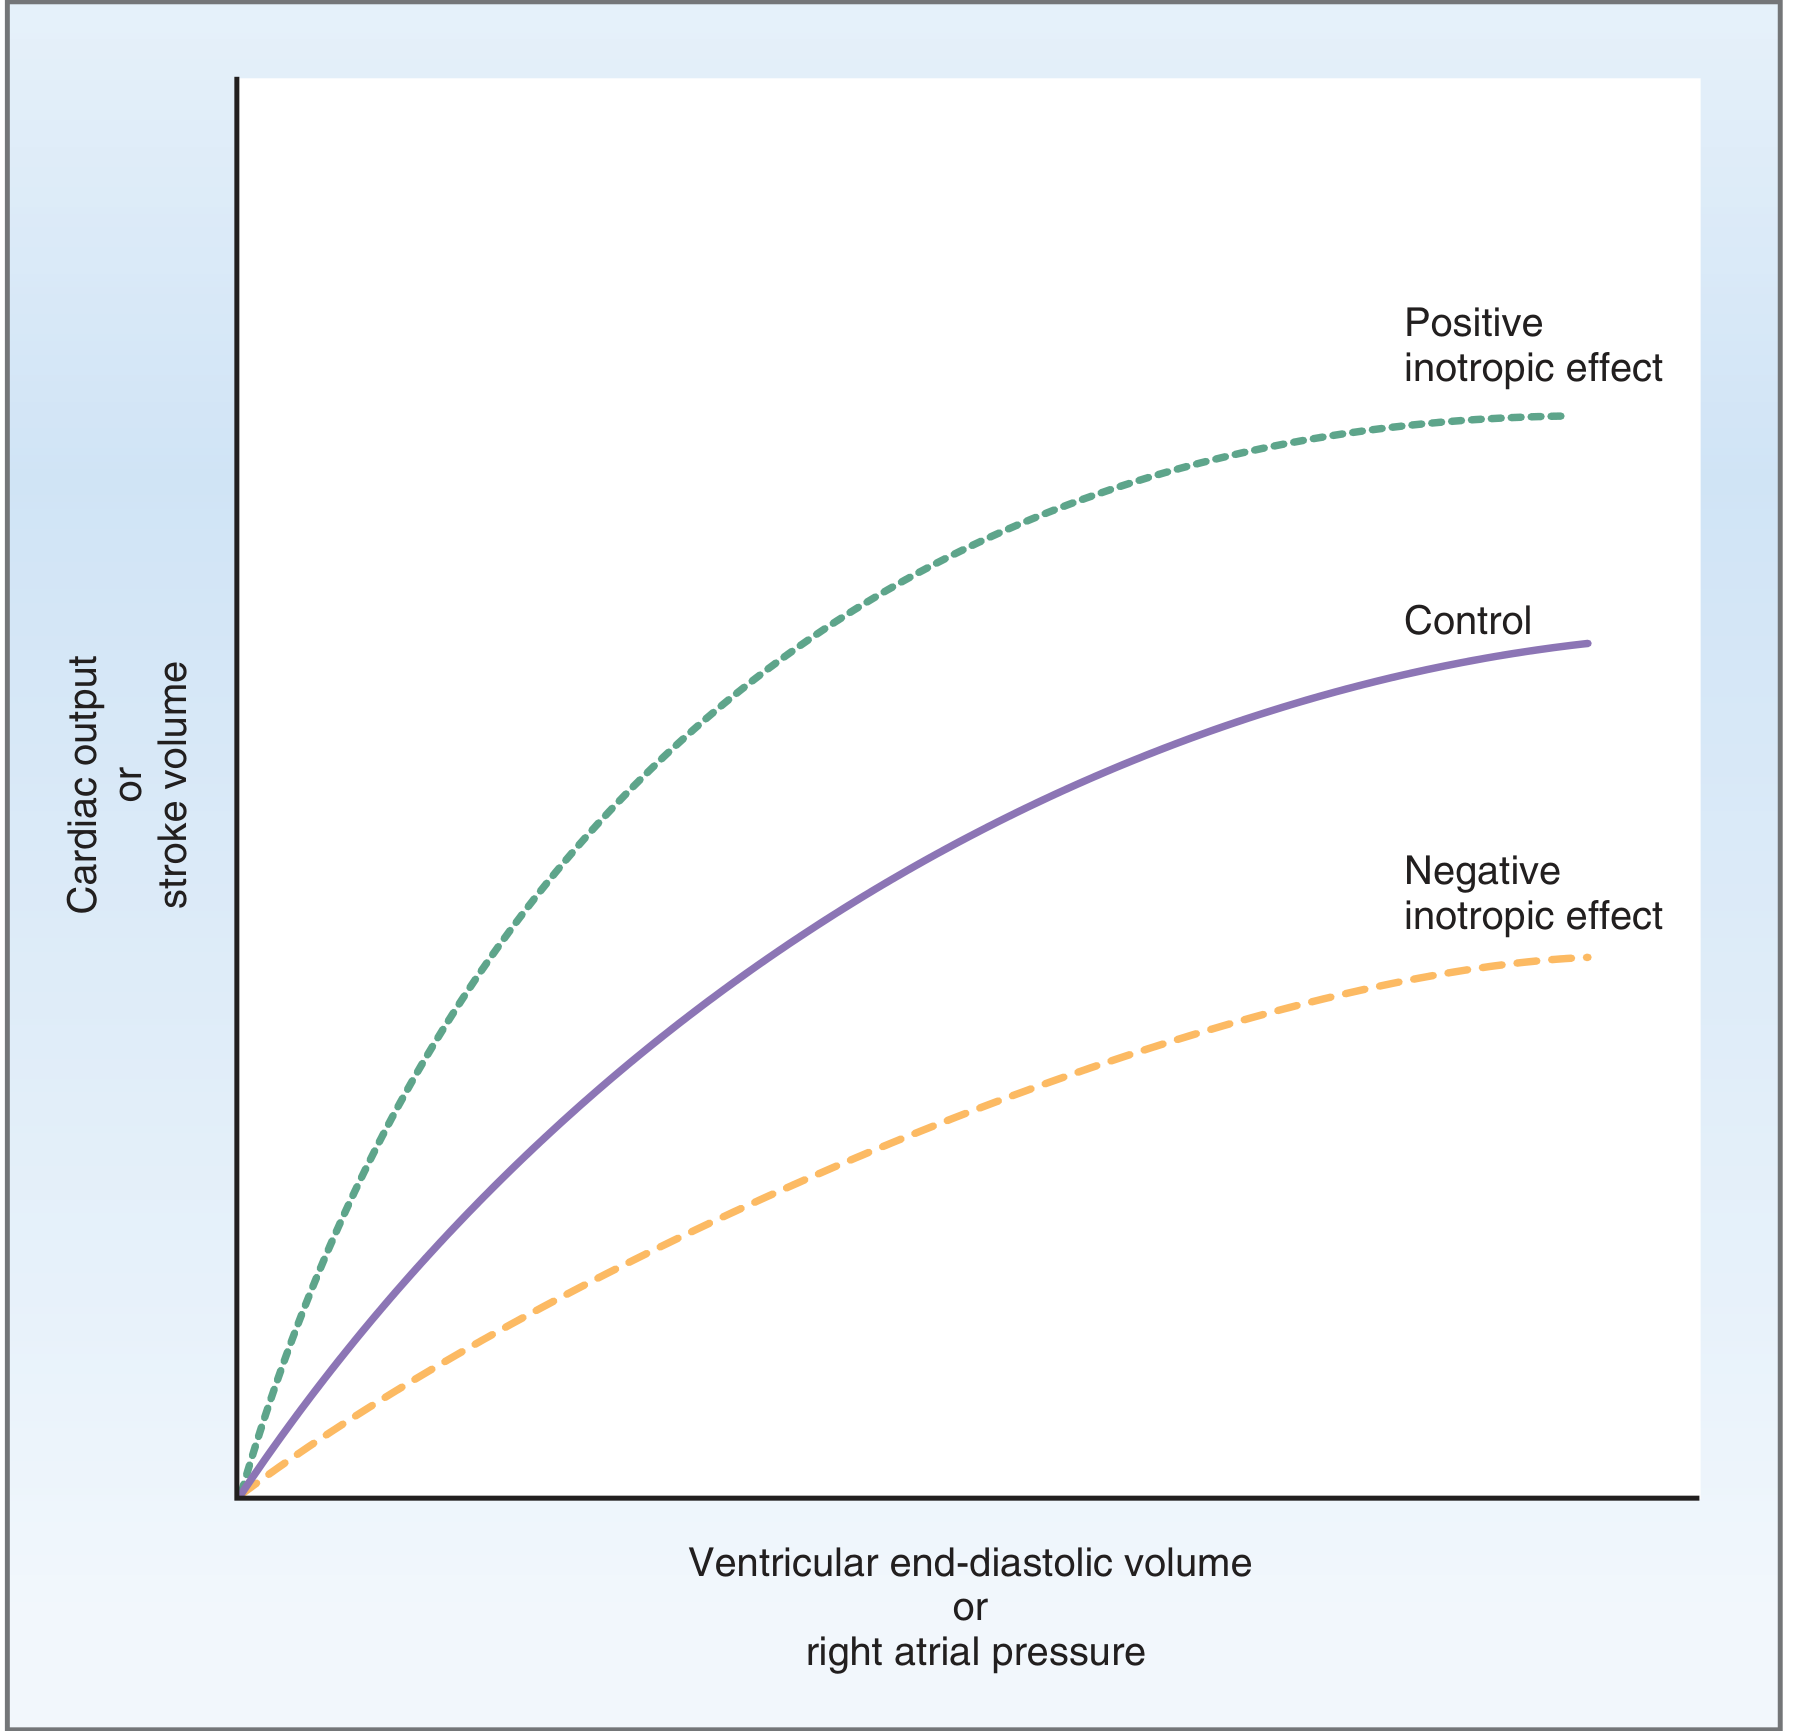
The three curves show: Control (normal), Positive inotropic effect (curve shifts upward - more stroke volume for same EDV), Negative inotropic effect (curve shifts downward). - Costanzo Physiology 7th Edition, Fig. 4.22
Factors that INCREASE preload (increase CO):
- Increased venous return (e.g., exercise, increased blood volume)
- Bradycardia (longer diastolic filling time)
- Lying down (increased venous return from legs)
Factors that DECREASE preload (decrease CO):
- Hemorrhage / dehydration
- Venodilators (e.g., nitroglycerin)
- Standing up suddenly (blood pools in lower extremities)
2. Afterload
Afterload is the resistance the ventricle must overcome to eject blood - primarily determined by aortic pressure (systemic vascular resistance). It is the "load" the heart must pump against.
- Increased afterload (e.g., hypertension, aortic stenosis): the ventricle cannot eject as much blood, so end-systolic volume increases and stroke volume falls.
- Decreased afterload (e.g., vasodilators like ACE inhibitors): the ventricle ejects more easily, stroke volume increases.
3. Myocardial Contractility (Inotropy)
Contractility is the intrinsic ability of the heart muscle to generate force at a given fiber length, independent of preload or afterload. It reflects how much Ca²+ is available to the contractile proteins (actin-myosin).
Positive inotropic factors (increase contractility):
- Sympathetic stimulation / catecholamines (norepinephrine, epinephrine) - act via β1 receptors → increased cAMP → increased intracellular Ca²+
- Digoxin (inhibits Na⁺/K⁺-ATPase → increases intracellular Ca²+)
- Increased heart rate (Bowditch/Treppe effect - more Ca²+ accumulates)
- Exercise
Negative inotropic factors (decrease contractility):
- Parasympathetic stimulation
- Acidosis
- Hypoxia
- Beta-blockers
- Calcium channel blockers
- Heart failure
As shown in the Frank-Starling graph above, positive inotropes shift the curve upward (more CO per given EDV), and negative inotropes shift it downward.
B. Factors Affecting HEART RATE
Heart rate is primarily controlled by the autonomic nervous system acting on the SA node:
| Factor | Effect on HR | Mechanism |
|---|---|---|
| Sympathetic stimulation | Increases HR (positive chronotropy) | Norepinephrine/Epinephrine → β1 receptors → increases slope of pacemaker potential |
| Parasympathetic stimulation (vagus) | Decreases HR (negative chronotropy) | Acetylcholine → M2 receptors → increases K+ conductance → hyperpolarizes SA node |
| Epinephrine (circulating) | Increases HR | β1 adrenergic |
| Fever/increased body temperature | Increases HR (~10 bpm per 1°C rise) | Direct effect on SA node spontaneous depolarization rate |
| Thyroid hormone | Increases HR | Increased sensitivity to catecholamines, direct effect |
| Hypoxia | Increases HR | Chemoreceptor-mediated sympathetic activation |
| Baroreceptor reflex | Modulates HR | Fall in BP → HR increases; rise in BP → HR decreases |
| Age | Decreases maximal HR | Max HR ≈ 220 - age |
| Athletic training | Decreases resting HR | Increased vagal tone (athlete's bradycardia) |
| Hypovolemia | Increases HR | Compensatory sympathetic activation |
3. Cardiac Output at Rest vs. Exercise
At Rest
- Heart rate: 60-80 beats/min (typically ~72 bpm)
- Stroke volume: ~70 mL
- Cardiac output: ~5 L/min
The resting heart is under predominant parasympathetic (vagal) tone which keeps HR relatively low. Trained athletes may have resting HR as low as 40-50 bpm due to enhanced vagal tone, but their stroke volumes are larger (larger chamber size due to cardiac hypertrophy), so CO is maintained normally at ~5 L/min.
During Exercise
Exercise dramatically increases metabolic demand for oxygen, and the cardiovascular system responds with large increases in CO.
Typical cardiac outputs at different exercise levels (Guyton & Hall):
| State | Cardiac Output |
|---|---|
| Young man at rest | 5.5 L/min |
| Maximal exercise - untrained young man | ~23 L/min |
| Maximal exercise - average male marathoner | ~30 L/min |
| Elite marathoners | 35-40 L/min |
The increase in CO during exercise results from both increased HR and increased SV, but not equally at all intensities.
The Two Phases of CO Increase During Exercise
Phase 1 - Up to 50-60% of maximal HR:
- Both HR and SV increase
- SV increases due to: (a) increased venous return via the muscle pump (Frank-Starling mechanism), (b) increased sympathetic contractility, (c) reduced peripheral resistance (vasodilation in active muscles)
Phase 2 - Above 60% of maximal HR:
- SV plateaus and no longer rises
- Further increases in CO are achieved solely by continued increases in HR
- The heart beats so fast at high intensities that diastolic filling time becomes too short to allow further increases in SV
(PT Direct / Medical Physiology - Boron & Boulpaep)
Graph: Cardiac Output vs. Work Output During Exercise
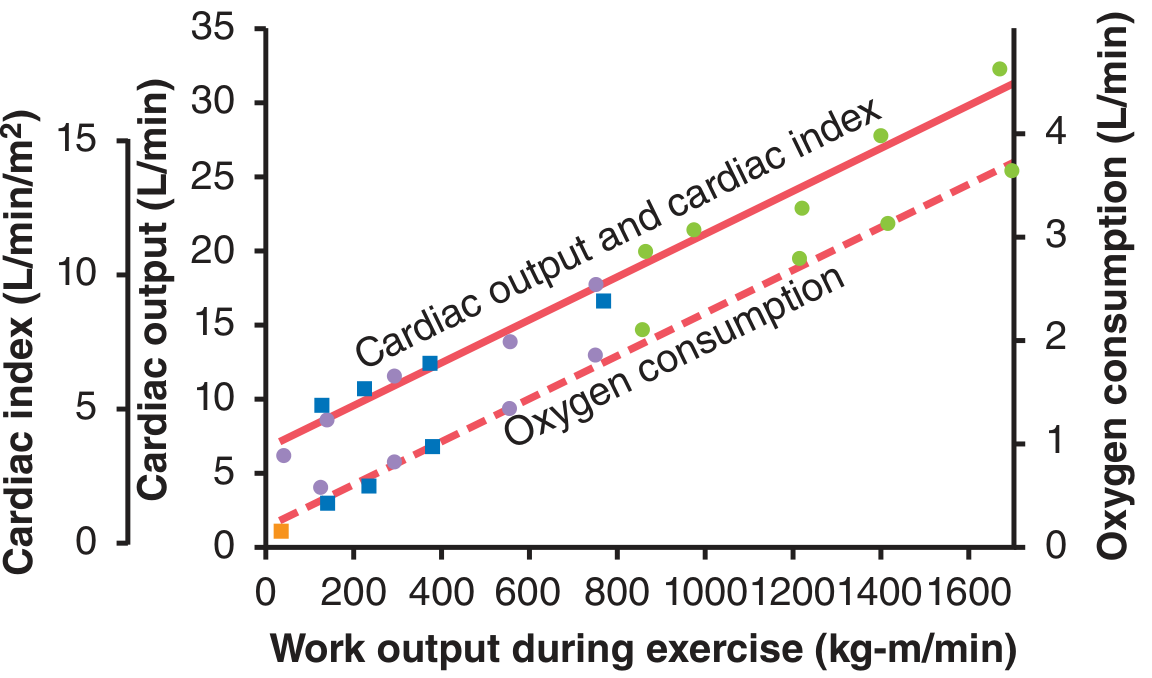
Guyton & Hall, Fig. 85.10 - Both cardiac output (solid red line) and oxygen consumption (dashed red line) increase in a linear fashion with increasing work output during exercise. CO starts at ~5.5 L/min at rest and can reach 23-30+ L/min at maximal exercise.
Graph: Venous Return and Cardiac Output Curves in Exercise
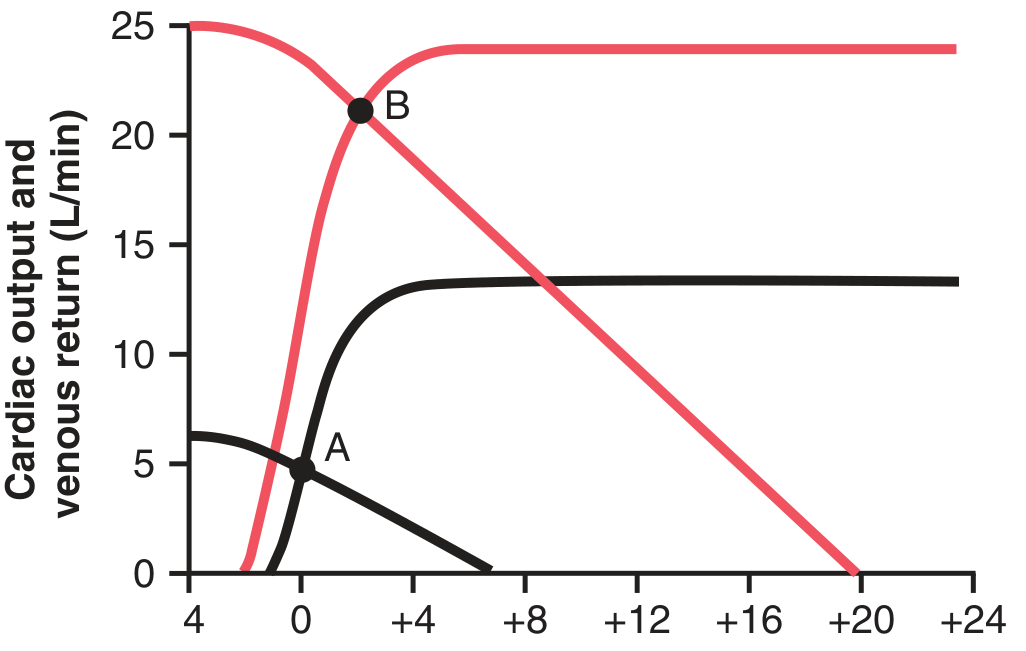
Guyton & Hall, Fig. 21.2 - Black curves = normal circulation (equilibrium at Point A, ~5 L/min). Red curves = heavy exercise (equilibrium at Point B, ~21 L/min). Both the cardiac output curve (upward shift from sympathetic stimulation) and the venous return curve (upward rotation from increased mean systemic filling pressure + decreased venous resistance) shift to achieve the new high-output equilibrium.
4. Mechanisms Driving CO Increase in Exercise
Three main pathways act simultaneously:
1. Central Command (Early/Anticipatory)
Higher brain centers (motor cortex) send signals to the cardiovascular control centers even before exercise starts, causing an immediate increase in sympathetic outflow and withdrawal of parasympathetic tone. This is why HR rises within the first breath of exercise - it is not driven by muscle chemicals, but by anticipation.
2. Mechanical Response from Muscle Pump (Delayed)
Contracting skeletal muscles compress veins, squeezing blood back to the heart. This increases venous return → raises EDV → Frank-Starling mechanism increases SV → CO rises. (Boron & Boulpaep, Medical Physiology)
3. Chemical/Metabolic Response (Delayed)
Active muscles release CO₂, lactic acid, K⁺, adenosine, and lower local O₂ and pH. These metabolites cause local arteriolar vasodilation in active muscle, reducing total peripheral resistance and allowing more blood flow. The fall in BP triggers baroreceptors → reflex sympathetic activation → HR and contractility increase.
Sympathetic changes at maximal exercise (Guyton & Hall):
- HR increases to 170-190 beats/min
- Contractility increases to ~2x normal
- Mean systemic filling pressure rises from 7 mmHg → up to 30 mmHg (sympathetic venoconstriction + muscle compression)
- Peripheral vascular resistance falls in active muscles (blood flow increases up to 25x)
5. Summary Comparison Table
| Parameter | Rest | Moderate Exercise | Maximal Exercise |
|---|---|---|---|
| Heart Rate | 60-80 bpm | ~120-140 bpm | 170-190+ bpm |
| Stroke Volume | ~70 mL | ~100-120 mL | ~110-130 mL (plateaus) |
| Cardiac Output | ~5 L/min | ~15-18 L/min | ~20-30 L/min |
| Dominant mechanism | Vagal tone maintains low HR | Both HR and SV rise | HR continues rising; SV plateaus |
| Sympathetic tone | Low | Moderate | Very high |
6. Key Formulas
- CO = SV × HR
- SV = EDV - ESV (EDV = end-diastolic volume; ESV = end-systolic volume)
- Ejection Fraction = SV / EDV (normal ≥55%)
- Cardiac Index = CO / Body Surface Area (normal ~2.5-4.0 L/min/m²)
- Max HR (approx) = 220 - age (in years)
Sources:
- Costanzo Physiology 7th Edition, pp. 155-156
- Guyton & Hall Textbook of Medical Physiology, Chs. 21 & 85
- Medical Physiology - Boron & Boulpaep, Ch. 25
Shock and it’s types
Reading File
This is a broad medical topic. Let me run parallel searches across the library for all aspects of shock.
Finding Sources
Finding Sources
Searching the Web
shock types classification pathophysiology hypovolemic cardiogenic distributive obstructive
Excellent - multiple authoritative textbook sources found. Let me read the key sections from Goldman-Cecil Medicine, Harrison's, Miller's Anesthesia, and Greenfield's Surgery in parallel.
Reading File
Reading File
Reading File
Good start. Now let me read deeper into pathophysiology from Greenfield's Surgery and Harrison's, and also look for images/diagrams.
Reading File
Reading File
Finding Sources
Excellent content retrieved. Let me now look for the stages of shock, septic shock in more detail, and any diagrams.
Reading File
Finding Sources
Finding Sources
Found the stages of shock in Guyton & Hall. Let me read that section and look for any diagnostic/classification images.
Reading File
Finding Sources
Found the ATLS classification table. Let me read that and also fetch the hemorrhagic shock graph.
Reading File
Loading Image
I now have all the rich content needed for a comprehensive answer. Let me compile the full detailed response.
Shock and Its Types
Definition
Shock is an acute circulatory dysfunction that results in inadequate tissue perfusion, leading to cellular hypoxia, metabolic failure, and, if untreated, multisystem organ failure and death. The key concept is not just low blood pressure - it is the failure to deliver sufficient oxygen to meet tissue metabolic demands.
"Shock is the clinical syndrome that results from inadequate tissue perfusion." - Mulholland & Greenfield's Surgery, 7th Ed.
Hypotension (SBP <90 mmHg or MAP <65 mmHg) is common but not always present, especially early in distributive shock or in patients who are normally hypertensive.
Classification - The Four Types of Shock
All shock states fall into four major categories:
| Type | Core Defect | CO | SVR | CVP/JVP |
|---|---|---|---|---|
| Hypovolemic | Low intravascular volume | ↓ | ↑ | ↓ |
| Cardiogenic | Pump failure | ↓ | ↑ | ↑ |
| Distributive | Loss of vascular tone | ↑ or normal | ↓↓ | ↓ |
| Obstructive | Mechanical obstruction to flow | ↓ | ↑ | ↑ |
(Goldman-Cecil Medicine; Harrison's Principles of Internal Medicine 22e)
1. Hypovolemic Shock
Definition: Shock caused by a decrease in intravascular volume, reducing venous return, preload, and thus cardiac output.
Causes
Hemorrhagic (most common):
- Trauma (most common cause of hemorrhagic shock)
- Gastrointestinal bleeding (peptic ulcer, varices)
- Ruptured aortic aneurysm
- Obstetric hemorrhage (placenta previa, postpartum hemorrhage)
Non-hemorrhagic:
- Vomiting, diarrhea (dehydration)
- Burns (massive plasma loss)
- Polyuria (diabetic ketoacidosis, diabetes insipidus)
- Pancreatitis (third-space fluid loss)
- Anaphylaxis (capillary leak)
Pathophysiology
Blood volume falls → venous return falls → preload falls → CO falls → arterial pressure falls → baroreceptors detect the fall → massive sympathetic activation:
- Arteriolar vasoconstriction → increased SVR (maintains BP initially)
- Venoconstriction → mobilizes venous blood reservoir
- Tachycardia → compensatory increase in CO
- RAAS activation → aldosterone → salt and water retention
- ADH (vasopressin) release → water reabsorption
- Blood flow is redistributed away from skin, gut, kidneys toward brain and heart
Key point: Up to ~10% blood volume loss can be compensated with almost no change in BP or CO. BP does not fall reliably until ~30% of blood volume is lost. CO falls first.
ATLS Classification of Hemorrhagic Shock
(Sabiston Textbook of Surgery / ATLS Course)
| Class I | Class II | Class III | Class IV | |
|---|---|---|---|---|
| Blood loss (%) | 0-15 | 15-30 | 30-40 | >40 |
| CNS | Slightly anxious | Mildly anxious | Anxious/confused | Confused/lethargic |
| Pulse (bpm) | <100 | >100 | >120 | >140 |
| Blood pressure | Normal | Normal | Decreased | Decreased |
| Pulse pressure | Normal | Decreased | Decreased | Decreased |
| Respiratory rate | 14-20/min | 20-30/min | 30-40/min | >35/min |
| Urine output (mL/h) | >30 | 20-30 | 5-15 | Negligible |
| Fluid replacement | Crystalloid | Crystalloid | Crystalloid + blood | Crystalloid + blood |
Graph: Effect of Hemorrhage on Cardiac Output and Arterial Pressure
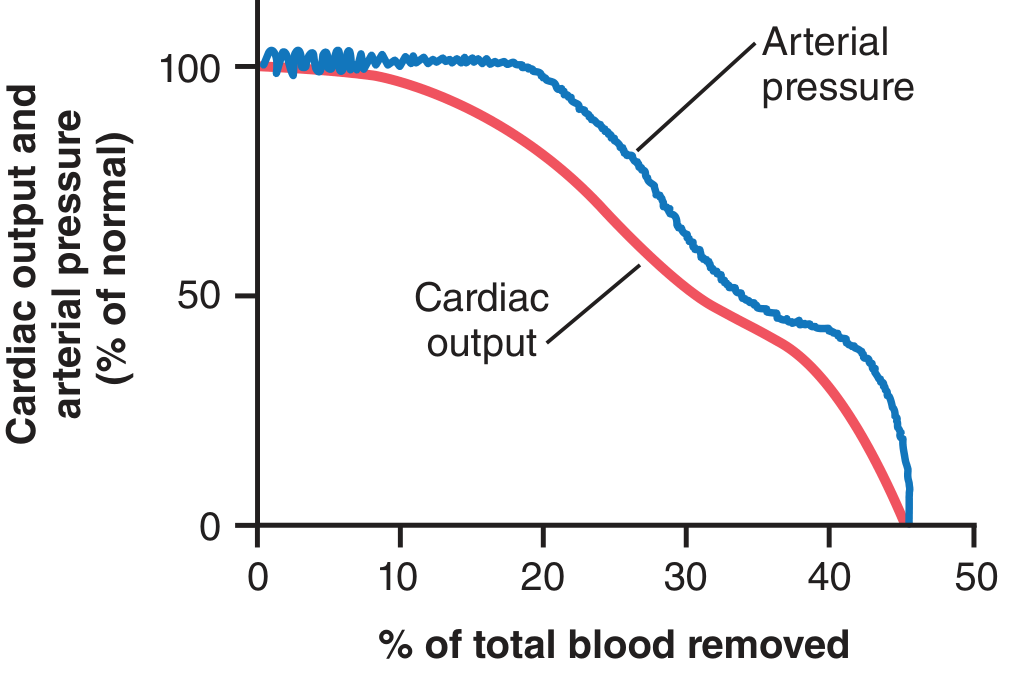
Guyton & Hall, Fig. 24.1 - Cardiac output (red) begins to fall earlier than arterial pressure (blue), which is maintained by sympathetic vasoconstriction. Both reach zero when ~40-45% of total blood volume is removed.
2. Cardiogenic Shock
Definition: Shock due to intrinsic failure of the heart as a pump ("pump failure"), with reduced cardiac output despite adequate or elevated filling pressures.
Causes
- Acute myocardial infarction (most common - loss of >40% of left ventricular myocardium)
- Acute valvular dysfunction (mitral regurgitation, aortic stenosis)
- Severe arrhythmias (ventricular tachycardia/fibrillation, complete heart block)
- Myocarditis
- Dilated cardiomyopathy (end-stage heart failure)
- Ventricular wall rupture post-MI
- Intracardiac obstructive lesions (valvular stenoses - classified here by convention)
Pathophysiology
Heart fails to pump → CO falls → organ hypoperfusion → compensatory sympathetic activation → vasoconstriction (↑SVR = increased afterload) → further worsening of pump performance → vicious cycle of progressive pump failure. Because the pump is failing, blood backs up: left ventricular end-diastolic pressure rises → pulmonary venous pressure rises → pulmonary edema. Right-sided backing up causes elevated JVP and peripheral edema.
Clinical Features
- Low CO, low BP, high SVR
- Tachycardia
- Cold, clammy extremities (low CO + vasoconstriction)
- Elevated JVP (distinguishes from hypovolemic shock)
- Pulmonary rales (pulmonary edema)
- S3 gallop, displaced apex
- Narrow pulse pressure
3. Distributive Shock
Definition: Shock caused by profound peripheral vasodilation and loss of vasomotor tone, leading to maldistribution of blood flow - blood is present but not reaching cells effectively. It is the most common type of shock overall.
Distributive shock is uniquely a high CO, low SVR state - the opposite of hypovolemic and cardiogenic shock. Extremities are warm, pulse pressure is wide. Despite high CO, tissues are hypoperfused due to arteriovenous shunting and microcirculatory dysfunction.
Sub-types
A. Septic Shock (most common distributive shock)
Definition: Sepsis + hemodynamic compromise despite adequate fluid resuscitation. Caused by bacterial (gram-positive/negative), fungal, viral, or rickettsial infections, or their toxins (e.g., LPS from gram-negative bacteria, toxic shock syndrome toxin).
Mortality: 40-50% (StatPearls/NCBI)
Two stages:
Early (Warm / Hyperdynamic) Septic Shock:
- Bacterial toxins + immune mediators (TNF-α, IL-1, IL-6, NO) → peripheral vasodilation
- Skin is warm and flushed
- CO is elevated (compensatory tachycardia + reduced afterload)
- Despite high CO, BP is low (very low SVR)
Late (Cold / Hypodynamic) Septic Shock:
- Myocardial depressant factors released → impaired contractility
- CO falls, vasoconstriction returns
- Skin becomes cold and mottled
- Progressive organ failure
- Toxins (e.g., LPS) also impair mitochondrial oxygen utilization - tissue cannot use the oxygen even when it is delivered ("cytopathic hypoxia")
B. Neurogenic Shock
- Caused by major spinal cord injury (typically above T6) - sudden loss of sympathetic tone to blood vessels
- Massive vasodilation below the level of injury → warm, dry skin, low SVR, relative bradycardia (paradoxically - no tachycardia because sympathetic innervation to SA node is also lost)
- Triad: Hypotension + bradycardia + warm peripheries
- Distinguished from other shock by the absence of tachycardia
C. Anaphylactic Shock
- IgE-mediated hypersensitivity reaction (bee stings, foods, drugs, contrast media) → massive mast cell and basophil degranulation → histamine, leukotrienes, prostaglandins
- Profound vasodilation + capillary leak + bronchoconstriction
- Features: urticaria, angioedema, bronchospasm, hypotension, tachycardia
- Pulmonary vasoconstriction increases right heart afterload → can reduce pulmonary blood flow → further reduces left heart preload → CO falls
- Treatment: epinephrine IM is the cornerstone (combines α1 vasoconstriction + β2 bronchodilation + mast cell stabilization)
D. Adrenal (Addisonian) Shock
- Adrenal insufficiency → loss of cortisol → vascular unresponsiveness to catecholamines → vasodilation + low SVR
- Often triggered by an acute stressor in a patient on chronic corticosteroids who suddenly stops
4. Obstructive Shock
Definition: Shock caused by a mechanical obstruction outside the heart that prevents adequate cardiac filling or emptying, reducing CO despite normal pump function and normal blood volume.
Causes
| Obstruction | Mechanism |
|---|---|
| Cardiac tamponade | Pericardial effusion compresses the heart → impairs diastolic filling → CO falls |
| Tension pneumothorax | Air accumulates in pleural space under pressure → mediastinal shift → compresses vena cava → preload falls → CO falls |
| Massive pulmonary embolism | Saddle PE blocks pulmonary outflow → right ventricle fails acutely → obstructs left heart preload → CO falls |
| Constrictive pericarditis | Fibrous pericardium restricts all chamber filling |
| Aortic dissection | Can obstruct coronary or aortic outflow |
| Status asthmaticus | Severe air trapping raises intrathoracic pressure → impedes venous return |
Clinical Features
- Low CO, elevated JVP (like cardiogenic, but no pulmonary edema in PE/tamponade/tension pneumo)
- Beck's triad in tamponade: hypotension + elevated JVP + muffled heart sounds
- Tension pneumothorax: absent breath sounds + tracheal deviation + elevated JVP + hypotension
- Massive PE: acute right heart strain, prominent P2, signs of DVT, hypoxia
3 Stages of Shock (Guyton & Hall)
Regardless of type, all shock progresses through three stages:
Stage 1 - Non-Progressive (Compensated)
- Body's compensatory mechanisms (sympathetic activation, RAAS, ADH) restore perfusion
- Patient can recover without intervention
- Tachycardia, mild narrowing of pulse pressure, slight anxiety
- Serum lactate may be mildly elevated
Stage 2 - Progressive (Decompensated)
- Compensatory mechanisms become overwhelmed
- Positive feedback loops begin: hypoperfused heart → weaker contractions → further drop in CO → worsening hypoperfusion
- Anaerobic metabolism → lactic acidosis → vasomotor failure
- Cellular ATP depletion → failure of Na⁺/K⁺ ATPase → cell swelling
- Without therapy, patient will die
Stage 3 - Irreversible
- Shock so severe that even with maximum therapy, survival is impossible
- Massive cellular necrosis across all organ systems
- Irreversible myocardial damage
- Endotoxin release from ischemic gut (bacterial translocation)
- Multiorgan failure (MOF): ARDS + acute kidney injury + hepatic failure + DIC
Key Biochemical Markers in Shock
| Marker | What It Reflects | Significance |
|---|---|---|
| Serum lactate | Anaerobic metabolism | >2 mmol/L = tissue hypoperfusion; >4 = severe; normalization correlates with survival |
| Base deficit | Metabolic acidosis severity | Normal: -2 to +2; Mild: -3 to -5; Moderate: -6 to -9; Severe: <-10 |
| ScvO₂ (central venous O₂ sat) | Oxygen extraction ratio | <65% = inadequate oxygen delivery; used to guide resuscitation |
| Urine output | Renal perfusion proxy | <0.5 mL/kg/h = oliguria = significant hypoperfusion |
Distinguishing the Types at the Bedside
| Finding | Hypovolemic | Cardiogenic | Distributive | Obstructive |
|---|---|---|---|---|
| Skin temperature | Cold | Cold | Warm (early) | Cold |
| JVP | ↓ | ↑ | ↓ | ↑ |
| Lung sounds | Clear | Rales (pulmonary edema) | Clear | Clear (PE, tamponade) |
| Pulse pressure | Narrow | Narrow | Wide | Narrow |
| Response to fluids | Good | Poor/worsens edema | Partial | Specific cause must be fixed |
| Cardiac output | ↓ | ↓↓ | ↑ or N | ↓ |
(Harrison's Principles of Internal Medicine 22e, 2025)
Epidemiology (Goldman-Cecil Medicine)
- ~500,000 cases of shock per year in the United States
- Septic shock: >250,000 cases/year (most common)
- Hemorrhagic shock: 60,000 deaths/year (mainly trauma)
- Cardiogenic shock: ~25,000/year (~4% of AMI cases)
- Pulmonary embolism-related shock: ~25,000/year (~13% of significant PE cases)
Sources:
- Goldman-Cecil Medicine, International Edition, Ch. 92
- Harrison's Principles of Internal Medicine, 22e (2025), Ch. on Shock
- Guyton & Hall Textbook of Medical Physiology, Ch. 24
- Mulholland & Greenfield's Surgery, 7e, Ch. on Shock
- Miller's Anesthesia, 10e, Classification of Shock
- Sabiston Textbook of Surgery, ATLS Classification
Explain the subdivisions of distributive shock. In simple language.
Finding Sources
Finding Sources
Finding Sources
Finding Sources
Finding Sources
Reading File
Reading File
Finding Sources
Reading File
Reading File
Finding Sources
Your credits are exhausted. You can purchase a top-up or subscribe to a plan to continue using Orris. If you're already subscribed, your daily credits will reset tomorrow.
Explain the foetal circulation
Your credits are exhausted. You can purchase a top-up or subscribe to a plan to continue using Orris. If you're already subscribed, your daily credits will reset tomorrow.
This is a shared conversation. Sign in to Orris to start your own chat.