
Cardiac output 10 marker 5 sheets minimum Physiology
Reading File
Reading File
Now let me extract the PDF content and search the medical library simultaneously.
Running Command
python3 -c " from pypdf import PdfReader reader = PdfReader('/home/daytona/workspace/attachments/1c0cc0e6-444d-4df5-a501-61526825f075/CARDIAC OUTPUT final 2019.pdf') print(f'Pages: {len(reader.pages)}') text = '' for i, page in enumerate(reader.pages): t = page.extract_text() print(f'--- PAGE {i+1} ---') print(t) print() "
Finding Sources
Now let me read the Costanzo Physiology content on cardiac output - the best textbook source for a physiology exam answer:
Reading File
Finding Sources
Excellent! I have comprehensive content from both the student's PDF and Costanzo Physiology. Let me also read the Guyton & Hall content on CO control and Fick principle:
Reading File
Reading File
I now have all the material needed. Let me fetch the Frank-Starling diagram image for visual inclusion:
Loading Image
I have all the material needed. Here is a complete, exam-ready 10-marker answer on Cardiac Output (5 sheets minimum):
CARDIAC OUTPUT
Physiology | 10 Marks
1. DEFINITION
Cardiac Output (CO) is defined as the total volume of blood pumped by each ventricle into the circulation per minute.
The volume of blood pumped by each ventricle per single beat is called Stroke Volume (SV) - normal value is 70-80 mL.
Formula:
CO = Heart Rate (HR) × Stroke Volume (SV)
Normal values:
- CO = 5-6 L/min (average: 5.5 L/min)
- HR = 72 beats/min (adult resting)
- SV = 70-80 mL/beat
- Cardiac Index = CO / Body Surface Area = ~3.2 L/min/m²
Example calculation: EDV = 140 mL, ESV = 70 mL, HR = 75 bpm SV = 140 - 70 = 70 mL; CO = 70 × 75 = 5250 mL/min; Ejection Fraction = 70/140 = 0.50 (50%)
The outputs of the two ventricles are exactly equal in the steady state. - Costanzo Physiology 7th Ed.
2. DISTRIBUTION OF CARDIAC OUTPUT
| Organ | Blood Flow (mL/min) |
|---|---|
| Liver | 1500 |
| Kidneys | 1300 |
| Brain | 750 |
| Skeletal muscle + others | 1000 |
| Lungs | 500 |
| Skin | 500 |
| Heart | 250 |
Distribution changes markedly during exercise - skeletal muscle flow may increase 20-fold while splanchnic flow is redirected.
3. CONTROL OF CARDIAC OUTPUT
Cardiac output is controlled by two main regulatory processes:
A. Control of Heart Rate (Extrinsic/Chronotropic Regulation)
(i) Cardiac Innervation
Sympathetic innervation:
- Origin: Intermediolateral horn, spinal cord T1-T5
- Supply: SA node, AV node, atria and ventricles (epicardial fibers)
- Effects:
- (+) Chronotropic - increases heart rate
- (+) Inotropic - increases force of contraction
- (+) Dromotropic - increases conduction velocity
- (+) Bathmotropic - increases excitability
Parasympathetic (Vagal) innervation:
- Origin: Nucleus ambiguus in medulla; cell bodies in dorsal motor nucleus of vagus
- Supply: SA node, AV node, and atrial muscles only (endocardiac fibers); NO vagal motor fibers to ventricles
- Effects:
- (-) Chronotropic - decreases heart rate (dominant resting effect = vagal tone)
- (-) Dromotropic - decreases conduction velocity
- (-) Inotropic - decreases atrial contractility only; does NOT influence ventricular contraction
(ii) Medullary Cardiac Centres
Vasomotor Centre (VMC) / Sympathetic Centre:
- Groups of neurons bilaterally in reticular formation of medulla (floor of 4th ventricle)
- Stimulation produces: vasoconstriction, increased BP, venoconstriction (increases VR), increased HR, increased myocardial contractility, increased peripheral resistance
Cardiac Vagal Centre / Parasympathetic Centre:
- Neurons: dorsal motor nucleus of vagus + nucleus ambiguus + nucleus tractus solitarius
- Responsible for resting vagal tone via constant impulse discharge
- Stimulation: reduces heart rate (bradycardia)
Afferent Inputs to Both Centres:
- Baroreceptors: Solely responsible for resting vagal tone in a normally breathing individual
- Chemoreceptors: In hypoxia, produce marked hyperpnoea and bradycardia
- Corticohypothalamic descending pathways: Mediate emotional and cortical influences
(iii) Factors Affecting Heart Rate
| Factor | Effect |
|---|---|
| Age (birth to adult) | HR falls as vagal tone rises (140 → 70 bpm); rises again in old age (fall in vagal tone) |
| Sex | Females slightly higher HR (lower vagal tone) |
| Body temperature | Each 1°F rise → +10 bpm (direct effect on SA node) |
| Sympathetic stimulation | Tachycardia |
| Epinephrine / Norepinephrine | Tachycardia (β1-adrenergic) |
| Thyroid hormone | Positive chronotropic; potentiates catecholamines |
| Exercise | HR increases linearly with severity |
| Superficial pain | Tachycardia + rise in BP (sympathetic) |
| Deep pain | Bradycardia + fall in BP (sympathetic inhibition) |
| Inspiration | HR increases (sinus arrhythmia) |
| Expiration | HR decreases |
B. Control of Stroke Volume (Intrinsic Autoregulation)
Stroke volume is governed by two mechanisms:
B1. HETEROMETRIC REGULATION (Frank-Starling Mechanism)
Principle: Force of contraction of the myocardium varies with the initial length of cardiac muscle fibers (preload-dependent).
Starling's Law of the Heart:
"The energy released by the cardiac muscle during contraction is proportional to the initial resting length of the muscle fibers (i.e., end-diastolic volume)."
- Preload = directly proportional to End-Diastolic Volume (EDV) = blood volume remaining in ventricles at end of diastole (normal EDV = 120-140 mL)
- Any factor that increases Venous Return (VR) → increases EDV → stretches myocardium → increases length of sarcomeres → more optimal actin-myosin overlap → greater force of contraction → greater stroke volume
The Frank-Starling law ensures cardiac output equals venous return in the steady state. It is the built-in mechanism allowing the heart to automatically pump whatever blood flows in from the veins. - Costanzo Physiology 7th Ed.; Guyton & Hall
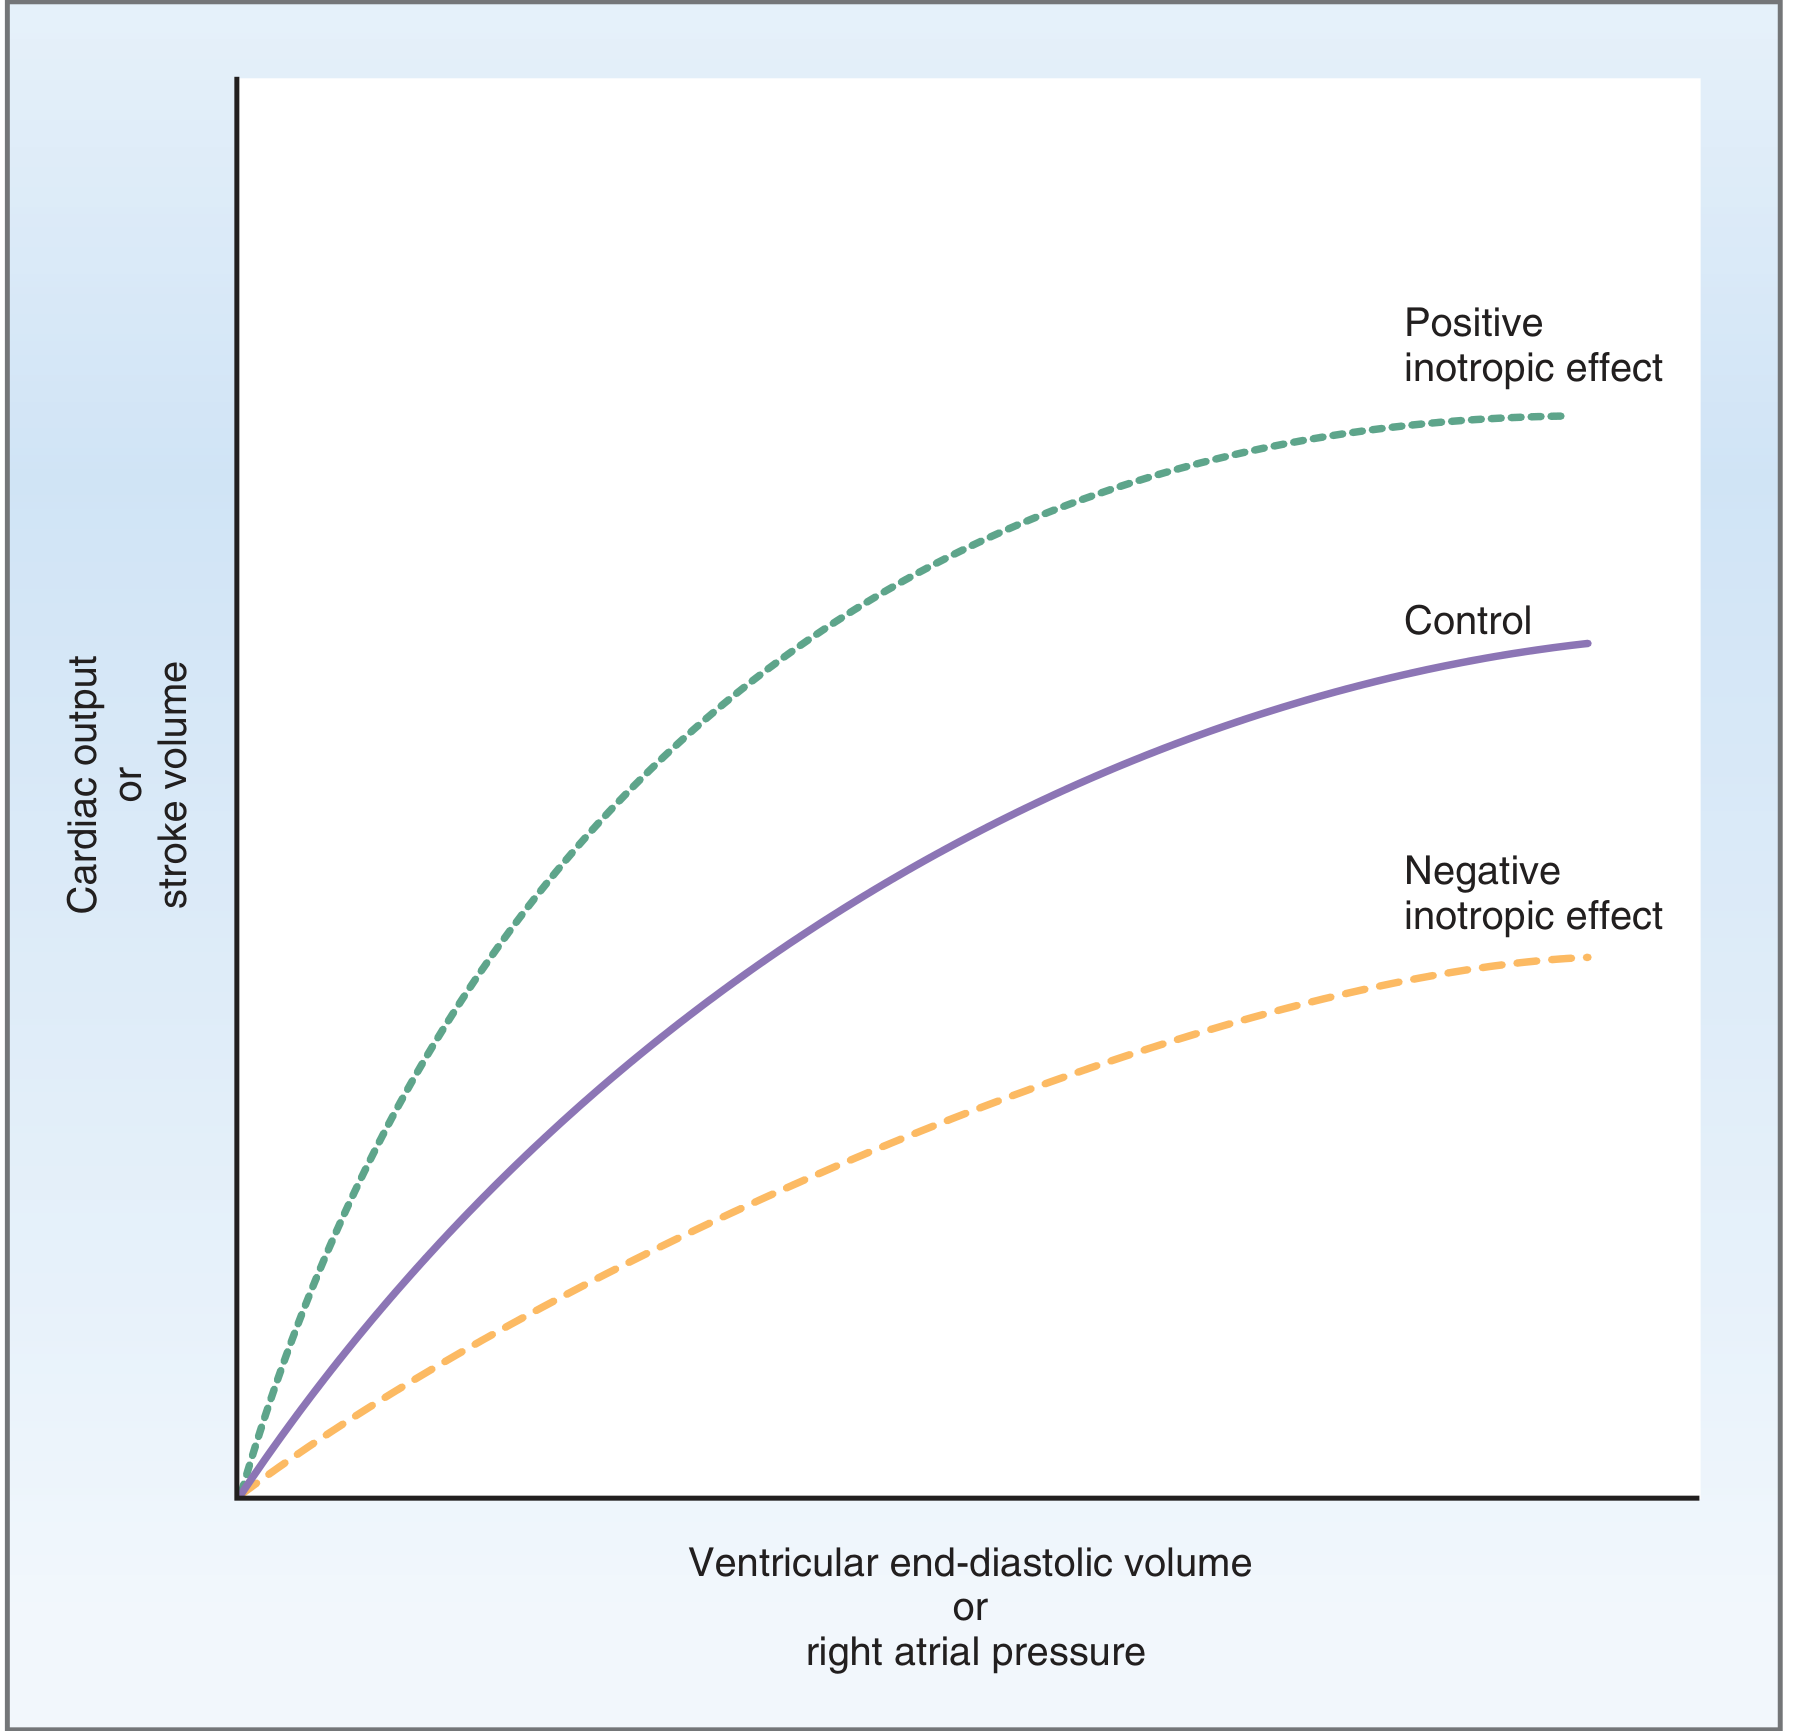
Fig: Frank-Starling relationship. As ventricular end-diastolic volume increases, cardiac output and stroke volume increase (curvilinear). Positive inotropic agents shift the curve upward; negative inotropic agents shift it downward.
Factors Affecting Venous Return (and thus preload):
- Respiratory/Thoracic pump - inspiration creates negative intrathoracic pressure, compresses vena cava and right atrium, pulls blood toward heart
- Cardiac pump - ventricular systole creates suction effect at venous end
- Muscle pump - rhythmic skeletal muscle contraction compresses veins, propelling blood toward heart (valves prevent backflow)
- Total blood volume - increased volume → increased VR
- Capacity of venous system - venoconstriction decreases venous capacitance → increases VR
- Body position - supine position increases VR (removes gravity); standing reduces it
- Ventricular compliance - reduced compliance (stiff ventricle) limits filling
B2. HOMOMETRIC REGULATION (Contractility-Based, Preload-Independent)
Principle: Myocardial contractility changes independently of initial muscle fiber length.
Increased contractility means:
- Ventricles develop tension more rapidly
- Ejection of blood is faster
- Greater stroke volume for the same EDV (curve shifts up - see diagram above)
Factors INCREASING myocardial contractility (+ve Inotropic):
- Catecholamines (epinephrine, norepinephrine) - via β1-adrenergic receptors → increase cAMP → increase Ca²⁺ entry
- Sympathetic stimulation - same mechanism as catecholamines
- Increased heart rate - within physiologic limits, ↑HR → ↑contractility (Bowditch effect / Treppe phenomenon)
- Drugs:
- Caffeine and theophylline - positive inotropic effect
- Glucagon - increases cAMP formation
- Digitalis (Digoxin) - inhibits Na⁺/K⁺-ATPase pump → ↑intracellular Na⁺ → ↑intracellular Ca²⁺ via Na⁺/Ca²⁺ exchanger → increases force of contraction (used in CHF)
Factors DECREASING myocardial contractility (-ve Inotropic):
- Vagal stimulation - negative inotropic effect on atria
- Intrinsic myocardial depression - as in heart failure
- Myocardial infarction - fibrosis of myocardium → non-functional muscle
- Hypercapnia, hypoxia, acidosis - metabolic depression
- Drugs: Barbiturates
4. MEASUREMENT OF CARDIAC OUTPUT
(i) Direct Fick Method
Fick's Principle:
"The amount of a substance taken up by an organ per unit time equals the arterial concentration minus the venous concentration of that substance, multiplied by blood flow."
Using oxygen as the marker substance:
$$\text{CO} = \frac{\text{O}_2 \text{ consumed per minute (mL/min)}}{\text{Arterial O}_2 \text{ content} - \text{Venous O}_2 \text{ content (mL/100 mL)}}$$
- Requires: arterial sample (aorta), mixed venous sample (pulmonary artery via catheter), and expired air O₂ measurement
- Gold standard for accuracy but invasive
Example: O₂ consumption = 250 mL/min; AO₂ = 20 mL/dL; VO₂ = 15 mL/dL
CO = 250 / (20-15) = 250/5 = 5000 mL/min = 5 L/min
(ii) Indicator Dilution Method
A known quantity of dye (e.g., Evans blue) or cold saline (thermodilution) is injected; its dilution in collected blood over time gives cardiac output (Stewart-Hamilton equation). Thermodilution via Swan-Ganz catheter is the most widely used clinical method.
(iii) Echocardiography / Doppler
Non-invasive; CO calculated from stroke volume (aortic cross-sectional area × velocity-time integral) × HR.
5. CARDIAC OUTPUT IN SPECIAL STATES
| State | CO Change | Mechanism |
|---|---|---|
| Exercise | ↑↑ (up to 20-25 L/min) | ↑HR + ↑SV; ↑VR via muscle/respiratory pump |
| Pregnancy | ↑ ~40% | ↑ Blood volume, ↑HR, ↑VR |
| Fever | ↑ | ↑HR (10 bpm per 1°F), vasodilation |
| Heart failure | ↓ | ↓ Contractility; may increase if compensated |
| Haemorrhage | ↓ | ↓ VR → ↓ EDV → ↓ SV |
| Supine position | slight ↑ | ↑ VR vs standing |
SUMMARY TABLE
| Parameter | Normal Value |
|---|---|
| Cardiac Output | 5-6 L/min |
| Stroke Volume | 70-80 mL/beat |
| Heart Rate | 70-90 bpm (adult) |
| End-Diastolic Volume | 120-140 mL |
| End-Systolic Volume | ~50 mL |
| Ejection Fraction | 55-70% |
| Cardiac Index | ~3.2 L/min/m² |
Key Diagrams to draw in exam:
- Heterometric regulation - Frank-Starling curve (CO vs EDV, showing effects of positive/negative inotropes)
- Homometric regulation - Box diagram showing factors increasing/decreasing contractility at same preload
- Cardiac innervation - Sympathetic (T1-T5) and parasympathetic (vagus/nucleus ambiguus) supply to SA node, AV node, atria, ventricles
Sources: Costanzo Physiology 7th Ed., p.155-156; Guyton & Hall Textbook of Medical Physiology; CVS-6 lecture notes (CARDIAC OUTPUT final 2019.pdf)
It's a 10 marker question. Define cardiac output, give its normal value, describe the various mechanism of regulation of cardiac output, enumerate the various method used for its measurement. Physiology
Here is a complete, structured 10-marker answer ready to write on 5 sheets:
CARDIAC OUTPUT
10-Mark Answer | Physiology
I. DEFINITION & NORMAL VALUE
Cardiac Output (CO) is defined as the total volume of blood pumped by each ventricle into the circulation per minute.
Stroke Volume (SV) = volume pumped per beat = 70–80 mL
Formula:
CO = Heart Rate (HR) × Stroke Volume (SV) = 72 beats/min × 70 mL = ~5040 mL/min
Normal Values:
| Parameter | Value |
|---|---|
| Cardiac Output | 5–6 L/min (average 5.5 L/min) |
| Stroke Volume | 70–80 mL/beat |
| Heart Rate (adult) | 70–90 beats/min |
| End-Diastolic Volume (EDV) | 120–140 mL |
| End-Systolic Volume (ESV) | ~50 mL |
| Ejection Fraction | 55–70% |
| Cardiac Index | ~3.2 L/min/m² (CO ÷ BSA) |
Both ventricles pump equal outputs in the steady state. The outputs differ only transiently.
II. REGULATION OF CARDIAC OUTPUT
CO = HR × SV, so regulation operates through two main channels:
A. Regulation of Heart Rate (Extrinsic / Chronotropic)
B. Regulation of Stroke Volume (Intrinsic Autoregulation)
A. REGULATION OF HEART RATE
1. Cardiac Innervation
(a) Sympathetic Innervation
- Origin: Intermediolateral horn, spinal cord segments T1–T5
- Supply: SA node, AV node, atria and ventricles (epicardial fibers)
- Neurotransmitter: Norepinephrine → β₁-adrenergic receptors
Effects (all POSITIVE):
| Effect | Term |
|---|---|
| ↑ Heart rate | (+) Chronotropic |
| ↑ Force of contraction | (+) Inotropic |
| ↑ Conduction velocity | (+) Dromotropic |
| ↑ Excitability | (+) Bathmotropic |
(b) Parasympathetic (Vagal) Innervation
- Origin: Nucleus ambiguus and dorsal motor nucleus of vagus, medulla
- Supply: SA node, AV node, atrial muscles only - NO fibers to ventricles
- Neurotransmitter: Acetylcholine → muscarinic receptors
Effects (all NEGATIVE):
| Effect | Term |
|---|---|
| ↓ Heart rate | (-) Chronotropic |
| ↓ Conduction velocity | (-) Dromotropic |
| ↓ Atrial contractility only | (-) Inotropic (atria only) |
| Resting vagal tone | Dominant at rest |
2. Medullary Cardiovascular Centres
(a) Vasomotor Centre (VMC) / Sympathetic Centre
- Located bilaterally in reticular formation of medulla (floor of 4th ventricle)
- Stimulation → vasoconstriction, ↑BP, venoconstriction (↑VR), ↑HR, ↑myocardial contractility
(b) Cardiac Vagal Centre / Parasympathetic Centre
- Neurons: dorsal motor nucleus of vagus + nucleus ambiguus + nucleus tractus solitarius
- Tonically active → responsible for resting vagal tone
- Stimulation → bradycardia
(c) Afferent Inputs to Both Centres:
- Baroreceptors (carotid sinus, aortic arch) - solely responsible for resting vagal tone
- Chemoreceptors - in hypoxia → bradycardia + hyperpnoea
- Corticohypothalamic pathways - mediate emotional/cortical effects
3. Other Factors Affecting Heart Rate
| Factor | Effect on HR | Mechanism |
|---|---|---|
| Age (birth→adult) | Falls (140→70 bpm) | ↑ Vagal tone |
| Old age | Rises (to ~100 bpm) | Fall in vagal tone |
| Female sex | Slightly higher | Lower vagal tone |
| Body temperature ↑ 1°F | +10 bpm | Direct effect on SA node |
| Epinephrine / Thyroid hormone | ↑ HR | β₁ stimulation / chronotropic |
| Exercise | ↑ HR (linearly) | Sympathetic + ↓ vagal tone |
| Superficial pain | Tachycardia | ↑ Sympathetic |
| Deep visceral pain | Bradycardia | Sympathetic inhibition |
| Inspiration | ↑ HR | Sinus arrhythmia |
| Expiration | ↓ HR | Sinus arrhythmia |
B. REGULATION OF STROKE VOLUME
(Intrinsic Autoregulation - Two Mechanisms)
B1. HETEROMETRIC REGULATION
(Frank-Starling / Starling's Law of the Heart)
Principle: Force of myocardial contraction varies with the initial length of the cardiac muscle fiber (i.e., preload-dependent).
Starling's Law:
"The more the cardiac muscle is stretched during diastole (up to a physiological limit), the greater is the force of contraction during systole."
Mechanism:
- Preload ∝ End-Diastolic Volume (EDV)
- ↑ Venous Return → ↑ EDV → ↑ stretch of myocardium → ↑ sarcomere length → more optimal actin-myosin overlap → ↑ force of contraction → ↑ SV → ↑ CO
This mechanism ensures that CO = Venous Return in the steady state.
Physiological basis: Length-tension relationship of cardiac muscle fibers.
Factors Affecting Venous Return (and hence Heterometric Regulation):
| Factor | How it affects VR |
|---|---|
| 1. Respiratory (Thoracic) pump | Inspiration → -ve intrathoracic pressure → compresses vena cava/RA → blood drawn toward heart → ↑ VR |
| 2. Cardiac pump | Ventricular systole creates suction at venous end → ↑ VR |
| 3. Muscle pump | Skeletal muscle contraction compresses veins → propels blood toward heart (valves prevent backflow) |
| 4. Total blood volume | ↑ Blood volume → ↑ VR |
| 5. Venous capacitance | Venoconstriction → ↓ venous capacitance → ↑ VR |
| 6. Body position | Supine → ↑ VR; Standing → ↓ VR (gravity pools blood in legs) |
| 7. Ventricular compliance | ↓ Compliance (stiff ventricle) → limits diastolic filling → ↓ VR effective |
B2. HOMOMETRIC REGULATION
(Contractility-Based / Preload-Independent)
Principle: Myocardial contractility changes independently of initial muscle fiber length (EDV unchanged).
- Ventricles develop tension more rapidly
- Ejection of blood is faster
- Greater SV for the same EDV → shifts Frank-Starling curve upward (positive inotropism) or downward (negative inotropism)
Factors INCREASING Contractility (+ve Inotropic):
| Agent | Mechanism |
|---|---|
| Catecholamines (Epi, NorEpi) | β₁ receptor → ↑ cAMP → ↑ Ca²⁺ entry |
| Sympathetic stimulation | Same as catecholamines |
| ↑ Heart rate (within limits) | Bowditch/Treppe effect |
| Digitalis / Digoxin | Inhibits Na⁺/K⁺-ATPase → ↑ intracellular Na⁺ → ↑ Ca²⁺ via Na⁺/Ca²⁺ exchanger |
| Caffeine / Theophylline | Positive inotropic effect |
| Glucagon | ↑ cAMP formation |
Factors DECREASING Contractility (-ve Inotropic):
| Agent | Mechanism |
|---|---|
| Vagal stimulation | Negative inotropic (atria only) |
| Heart failure | Intrinsic myocardial depression |
| Myocardial infarction | Fibrosis → non-functional muscle |
| Hypoxia, Hypercapnia, Acidosis | Metabolic depression of myocardium |
| Barbiturates | Direct myocardial depression |
III. METHODS OF MEASUREMENT OF CARDIAC OUTPUT
1. Direct Fick Method (Gold Standard)
Fick's Principle:
"The amount of a substance taken up by an organ per unit time equals blood flow × (arterio-venous difference of that substance)."
Using O₂ as the indicator:
$$CO = \frac{O_2 \text{ consumed per min (mL/min)}}{Arterial\ O_2 \text{ content} - Mixed\ venous\ O_2 \text{ content (mL/dL)}} \times 100$$
Example: O₂ consumption = 250 mL/min; A-O₂ = 20 mL/dL; V-O₂ = 15 mL/dL
CO = 250 ÷ (20 - 15) × 100 = 5000 mL/min = 5 L/min
- Requires: arterial sample (aorta) + mixed venous sample (pulmonary artery via right heart catheter) + expired air O₂ analysis
- Accurate but invasive
2. Indicator Dilution Method
- A known amount of dye (e.g., Evans blue / indocyanine green) or cold saline is injected into a vein
- Concentration measured over time in arterial blood (Stewart-Hamilton equation)
- Thermodilution via Swan-Ganz catheter - most widely used clinical method
$$CO = \frac{\text{Amount of indicator injected}}{\text{Area under concentration-time curve}}$$
3. Pulse Contour / Pulse Pressure Method
- CO estimated from the arterial pulse pressure waveform
- Less invasive; used in ICU monitoring
4. Echocardiography (Doppler Method)
- Non-invasive
- CO = SV × HR
- SV calculated from: Aortic cross-sectional area × Velocity-Time Integral (VTI) of aortic flow
- Widely used clinically; no catheterization required
5. Impedance Cardiography (ICG)
- Measures changes in thoracic electrical impedance during cardiac cycle
- Completely non-invasive; less accurate than Fick
6. Radioactive Isotope Dilution
- Radioactive-labeled RBCs or albumin injected; dilution measured
- Research use; gives both CO and blood volume
SUMMARY
Cardiac Output
├── Definition: Volume/ventricle/min = HR × SV
├── Normal: 5–6 L/min
│
├── Regulation
│   ├── A. Heart Rate (Extrinsic)
│   │   ├── Sympathetic (T1-T5): +chrono, +ino, +dromo, +bathmo
│   │   ├── Parasympathetic (Vagus/Nucleus ambiguus): -chrono, -dromo, -ino (atria)
│   │   ├── Medullary Centres (VMC + Vagal Centre)
│   │   └── Factors: Age, Sex, Temp, Hormones, Exercise, Pain
│   │
│   └── B. Stroke Volume (Intrinsic)
│       ├── Heterometric (Frank-Starling): EDV → stretch → force ↑
│       │   └── Factors affecting VR: Respiratory pump, Muscle pump,
│       │       Blood volume, Venous tone, Posture, Ventricular compliance
│       └── Homometric (Contractility): Independent of fiber length
│           ├── +ve Inotropes: Catecholamines, Digoxin, Caffeine, Glucagon
│           └── -ve Inotropes: Vagus, Hypoxia, MI, Barbiturates
│
└── Measurement
    ├── Fick Method (Gold standard - invasive)
    ├── Indicator dilution / Thermodilution (Swan-Ganz)
    ├── Echocardiography/Doppler (non-invasive)
    ├── Impedance cardiography
    └── Isotope dilution
Diagrams to draw:
- Frank-Starling curve (CO vs EDV - normal, +ve inotropic, -ve inotropic curves)
- Heterometric regulation flow chart (VR → EDV → stretch → Starling → ↑CO)
- Cardiac innervation diagram (sympathetic T1-T5 vs vagus/nucleus ambiguus; supply to SA, AV, atria, ventricles)
Sources: Costanzo Physiology 7th Ed., pp. 155-156; Guyton & Hall Textbook of Medical Physiology, Ch. 20; CVS-6 lecture notes
Edit this answer and explain factors affecting heart rate according to pdf
The PDF content is already in my context from the previous session. Here is the full edited answer with the Factors Affecting Heart Rate section expanded exactly as per your PDF (CVS-6, Cardiac Output final 2019):
CARDIAC OUTPUT
10-Mark Answer | Physiology
I. DEFINITION & NORMAL VALUE
Cardiac Output (CO) is defined as the total volume of blood pumped by each ventricle into the circulation per minute.
Stroke Volume (SV) = volume pumped per beat = 70–80 mL
Formula:
CO = Heart Rate (HR) × Stroke Volume (SV) = 72 beats/min × 70 mL = ~5040 mL/min
Normal Values:
| Parameter | Value |
|---|---|
| Cardiac Output | 5–6 L/min (average 5.5 L/min) |
| Stroke Volume | 70–80 mL/beat |
| Heart Rate (adult) | 70–90 beats/min |
| End-Diastolic Volume (EDV) | 120–140 mL |
| End-Systolic Volume (ESV) | ~50 mL |
| Ejection Fraction | 55–70% |
| Cardiac Index | ~3.2 L/min/m² (CO ÷ BSA) |
Both ventricles pump equal outputs in the steady state.
II. REGULATION OF CARDIAC OUTPUT
CO = HR × SV, so regulation operates through two main channels:
A. Regulation of Heart Rate (Extrinsic / Chronotropic)
B. Regulation of Stroke Volume (Intrinsic Autoregulation)
A. REGULATION OF HEART RATE
1. Cardiac Innervation
(a) Sympathetic Innervation
- Origin: Intermediolateral horn, spinal cord segments T1–T5
- Supply: SA node, AV node, atria and ventricles (epicardial fibers)
- Neurotransmitter: Norepinephrine → β₁-adrenergic receptors
Effects (all POSITIVE):
| Effect | Term |
|---|---|
| ↑ Heart rate | (+) Chronotropic |
| ↑ Force of contraction | (+) Inotropic |
| ↑ Conduction velocity | (+) Dromotropic |
| ↑ Excitability | (+) Bathmotropic |
(b) Parasympathetic (Vagal) Innervation
- Origin: Nucleus ambiguus and dorsal motor nucleus of vagus, medulla
- Supply: SA node, AV node, atrial muscles only - NO fibers to ventricles
- Neurotransmitter: Acetylcholine → muscarinic receptors
Effects (all NEGATIVE):
| Effect | Term |
|---|---|
| ↓ Heart rate | (-) Chronotropic |
| ↓ Conduction velocity | (-) Dromotropic |
| ↓ Atrial contractility only | (-) Inotropic (atria only) |
| Resting vagal tone | Dominant at rest |
2. Medullary Cardiovascular Centres
(a) Vasomotor Centre (VMC) / Sympathetic Centre
- Located bilaterally in reticular formation of medulla (floor of 4th ventricle)
- Stimulation → vasoconstriction, ↑BP, venoconstriction (↑VR), ↑HR, ↑myocardial contractility
(b) Cardiac Vagal Centre / Parasympathetic Centre
- Neurons: dorsal motor nucleus of vagus + nucleus ambiguus + nucleus tractus solitarius
- Tonically active → responsible for resting vagal tone
- Stimulation → bradycardia
(c) Afferent Inputs to Both Centres:
- Baroreceptors - solely responsible for resting vagal tone
- Chemoreceptors - in hypoxia → bradycardia + hyperpnoea
- Corticohypothalamic pathways - mediate emotional/cortical effects
3. FACTORS AFFECTING HEART RATE
(As per PDF - CVS-6)
Normal resting HR in adults = 70–90 beats/min
1. AGE
| Stage | Heart Rate |
|---|---|
| Fetal HR | 140–150 bpm |
| At birth | 130–140 bpm |
| At 12 years | up to 100 bpm |
| Adults | 70–90 bpm |
| Old age | up to 100 bpm |
- After birth, as age increases → vagal tone increases → HR decreases
- In old age, vagal tone falls again → HR rises back up to ~100 bpm
2. SEX (GENDER DIFFERENCE)
- Heart rate is slightly higher in females as compared to males
- Reason: lower vagal tone in females
3. BODY TEMPERATURE
- For each 1°F rise in body temperature → HR increases by ~10 bpm
- Mechanism: direct effect on the SA node (heat increases automaticity)
- Vasodilatation also occurs → decrease in BP
- Fall in body temperature → decreases HR + vasoconstriction → BP rises
4. EMOTIONAL STIMULI
| Emotion | Effect on HR |
|---|---|
| Excitement, Fear, Anger | Tachycardia |
| Shock, Grief, Apprehension | Bradycardia |
- Mediated via corticohypothalamic pathways → sympathetic or parasympathetic activation
5. EXERCISE
- HR increases in linearity with severity of exercise
- Mechanism: withdrawal of vagal tone initially, then sympathetic activation
- Hormones (epinephrine) released during exercise further increase HR
6. PAINFUL STIMULI
| Type of Pain | Effect |
|---|---|
| Superficial pain | Tachycardia + rise in BP (stimulation of sympathetic nerves) |
| Deep tissue pain | Bradycardia + fall in systemic BP (sympathetic inhibition) |
7. RESPIRATION (Sinus Arrhythmia)
- HR increases with inspiration
- HR decreases during expiration
- This phenomenon is called Sinus Arrhythmia
- Mechanism: During inspiration → negative intrathoracic pressure → ↑ venous return → stretch of RA → Bainbridge reflex → ↑ HR
8. HORMONES
| Hormone | Effect |
|---|---|
| Epinephrine & Norepinephrine | Released from adrenal medulla in response to sympathetic stimulation; ↑ CO by increasing rate AND force of contraction |
| Thyroid Hormone (Thyroxine) | High resting HR; direct chronotropic effect on heart; potentiates action of circulating catecholamines |
9. DRUGS
- Digitalis → slows HR (slow, steady, but stronger beat - used in CHF)
- Drugs causing tachycardia: atropine, sympathomimetics
- Drugs causing bradycardia: beta-blockers, calcium channel blockers
10. DISEASES
| Disease | Effect |
|---|---|
| Thyrotoxicosis | Tachycardia |
| Hypoxia | Tachycardia (initially); bradycardia (severe) |
| Increased intracranial tension | Bradycardia (Cushing's reflex) |
| Congestive Heart Failure (CHF) | Decline in pumping efficiency; heart worn out and pumps weakly; compensatory tachycardia |
B. REGULATION OF STROKE VOLUME
(Intrinsic Autoregulation - Two Mechanisms)
B1. HETEROMETRIC REGULATION
(Frank-Starling / Starling's Law of the Heart)
Principle: Force of myocardial contraction varies with the initial length of the cardiac muscle fiber (preload-dependent).
Starling's Law:
"The more the cardiac muscle is stretched during diastole (up to a physiological limit), the greater is the force of contraction during systole."
Mechanism:
- Preload ∝ End-Diastolic Volume (EDV)
- ↑ Venous Return → ↑ EDV → ↑ stretch of myocardium → ↑ sarcomere length → more optimal actin-myosin overlap → ↑ force of contraction → ↑ SV → ↑ CO
This mechanism ensures CO = Venous Return in the steady state.
Factors Affecting Venous Return:
| Factor | Mechanism |
|---|---|
| 1. Respiratory pump | Inspiration → -ve intrathoracic pressure → ↑ VR |
| 2. Cardiac pump | Systole creates suction at venous end |
| 3. Muscle pump | Skeletal muscle contraction propels blood toward heart |
| 4. Total blood volume | ↑ Volume → ↑ VR |
| 5. Venous capacitance | Venoconstriction → ↓ capacitance → ↑ VR |
| 6. Body position | Supine → ↑ VR; Standing → ↓ VR |
| 7. Ventricular compliance | ↓ Compliance → limits diastolic filling |
B2. HOMOMETRIC REGULATION
(Contractility-Based / Preload-Independent)
Principle: Myocardial contractility changes independently of initial muscle fiber length.
Factors INCREASING Contractility (+ve Inotropic):
| Agent | Mechanism |
|---|---|
| Catecholamines (Epi, NorEpi) | β₁ receptor → ↑ cAMP → ↑ Ca²⁺ entry |
| Sympathetic stimulation | Same as catecholamines |
| ↑ Heart rate (within limits) | Bowditch / Treppe effect |
| Digitalis / Digoxin | Inhibits Na⁺/K⁺-ATPase → ↑ intracellular Ca²⁺ |
| Caffeine / Theophylline | Positive inotropic effect |
| Glucagon | ↑ cAMP formation |
Factors DECREASING Contractility (-ve Inotropic):
| Agent | Mechanism |
|---|---|
| Vagal stimulation | Negative inotropic (atria only) |
| Heart failure | Intrinsic myocardial depression |
| Myocardial infarction | Fibrosis → non-functional muscle |
| Hypoxia, Hypercapnia, Acidosis | Metabolic depression |
| Barbiturates | Direct myocardial depression |
III. METHODS OF MEASUREMENT OF CARDIAC OUTPUT
1. Direct Fick Method (Gold Standard)
Fick's Principle:
"The amount of a substance taken up by an organ per unit time equals blood flow × arterio-venous difference of that substance."
$$CO = \frac{O_2 \text{ consumed per min (mL/min)}}{(A-V) \ O_2 \text{ difference (mL/dL)}} \times 100$$
Example: O₂ consumption = 250 mL/min; A-O₂ = 20 mL/dL; V-O₂ = 15 mL/dL
→ CO = 250 ÷ 5 × 100 = 5000 mL/min
- Requires arterial + mixed venous (PA) samples + expired air analysis
- Accurate but invasive
2. Indicator Dilution Method
- Known amount of Evans blue dye or cold saline injected
- Concentration measured over time → Stewart-Hamilton equation
- Thermodilution via Swan-Ganz catheter = most used clinical method
3. Echocardiography / Doppler Method
- Non-invasive
- CO = SV × HR; SV = Aortic area × Velocity-Time Integral (VTI)
4. Impedance Cardiography (ICG)
- Measures changes in thoracic electrical impedance during cardiac cycle
- Completely non-invasive
5. Radioactive Isotope Dilution
- Radioactive-labeled RBCs injected; dilution measured
- Gives both CO and blood volume
SUMMARY FLOWCHART
CARDIAC OUTPUT (5–6 L/min) = HR × SV
│
├── A. Heart Rate (Extrinsic)
│   ├── Sympathetic (T1-T5): +chrono/ino/dromo/bathmo
│   ├── Parasympathetic (Vagus): -chrono/dromo/ino (atria only)
│   ├── Medullary Centres (VMC + Vagal)
│   └── Factors (PDF):
│       Age | Sex | Body Temp | Emotional Stimuli
│       Exercise | Painful Stimuli | Respiration
│       Hormones | Drugs | Diseases
│
└── B. Stroke Volume (Intrinsic)
    ├── Heterometric (Frank-Starling): EDV → stretch → ↑ force
    │   └── VR factors: Resp pump, Muscle pump, Blood vol,
    │       Venous tone, Posture, Compliance
    └── Homometric (Contractility - preload independent)
        ├── +ve: Catecholamines, Digoxin, Caffeine, Glucagon
        └── -ve: Vagus, Hypoxia, MI, Barbiturates

MEASUREMENT:
Fick (gold standard) | Indicator dilution / Thermodilution
Echo-Doppler | Impedance cardiography | Isotope dilution
Diagrams to draw:
- Frank-Starling curve (CO vs EDV - three curves: normal, +ve inotropic, -ve inotropic)
- Cardiac innervation diagram (Sympathetic T1-T5 vs Vagus/nucleus ambiguus)
- Flow chart of factors affecting HR (10 factors from PDF)
Sources: CVS-6 Cardiac Output final 2019.pdf; Costanzo Physiology 7th Ed., p.155–156; Guyton & Hall Textbook of Medical Physiology
This is a shared conversation. Sign in to Orris to start your own chat.