I want to learn ECG from basic
Reading File
Finding Sources
Finding Sources
Searching the Web
ECG basics for beginners cardiac conduction system P wave QRS T wave explained
Finding Sources
Finding Sources
Reading File
Reading File
Reading File
Finding Sources
Finding Sources
Loading Image
Reading File
Reading File
Loading Image
Reading File
Loading Image
Reading File
I now have excellent content from Harrison's, Guyton, and Gray's Anatomy. Let me compile a comprehensive beginner's ECG guide.
Here is a complete, structured guide to learning ECG from the basics, sourced from Harrison's Principles of Internal Medicine (22nd Ed.), Guyton & Hall Medical Physiology, and Gray's Anatomy for Students.
ECG from the Basics: A Complete Beginner's Guide
1. What Is an ECG?
An electrocardiogram (ECG or EKG) is a recording of the electrical activity of the heart over time. When a cardiac impulse passes through the heart, electrical currents spread into the surrounding tissues and all the way to the skin surface. Electrodes placed on the skin pick up these tiny voltage differences and trace them on graph paper. The result is the familiar "squiggly line" pattern you see on monitors.
- Guyton & Hall Medical Physiology
2. The Cardiac Conduction System (The Foundation)
Before reading an ECG, you must understand why the heart generates electricity. The conduction system initiates and coordinates contraction in a specific order:
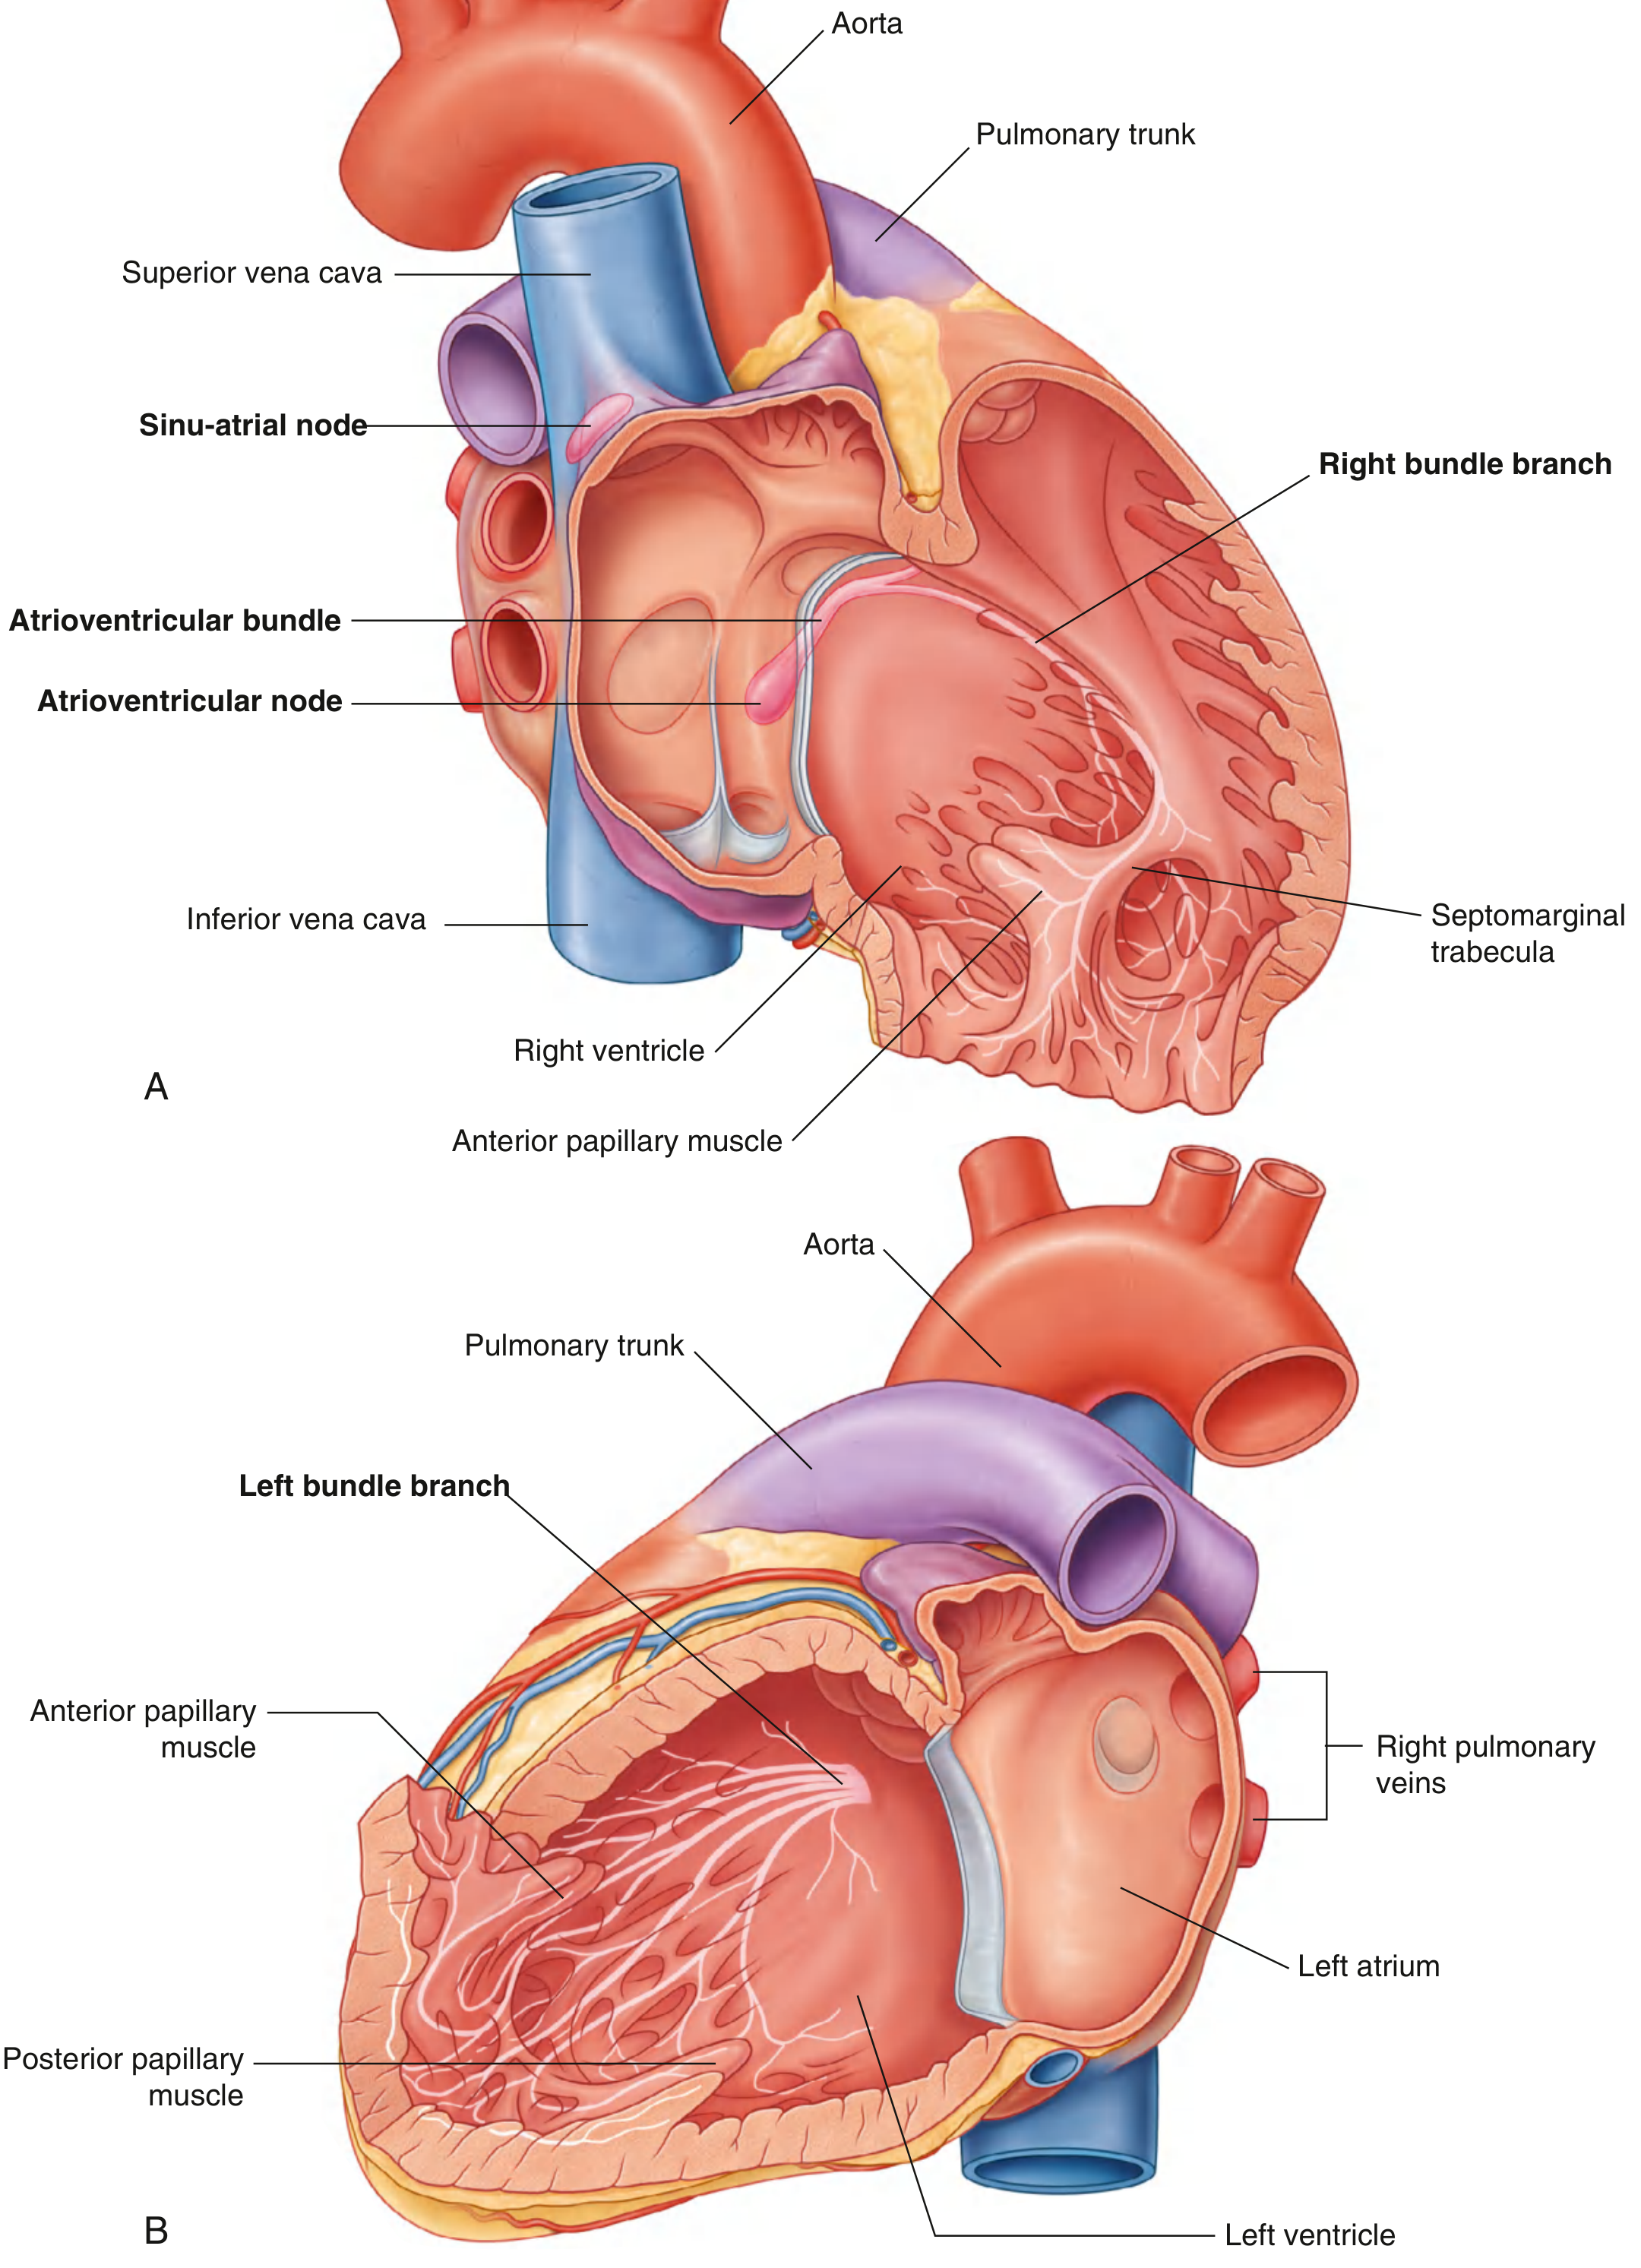
Fig. 3.86 from Gray's Anatomy for Students - Conduction System of the Heart
The pathway flows in this order:
| Step | Structure | What happens |
|---|---|---|
| 1 | SA node (sinoatrial node) | The heart's natural pacemaker. Located at the junction of the superior vena cava and right atrium. Fires spontaneously ~60-100 times/min. |
| 2 | Atria | The electrical wave spreads across both atria, causing them to contract. |
| 3 | AV node (atrioventricular node) | Near the tricuspid valve. Deliberately slows the impulse to give ventricles time to fill with blood. |
| 4 | Bundle of His | Carries impulse down the interventricular septum. |
| 5 | Right & Left Bundle Branches | Split and carry signals to right and left ventricles respectively. |
| 6 | Purkinje fibers | Final network that spreads activation through the ventricular walls from endocardium to epicardium, triggering coordinated contraction. |
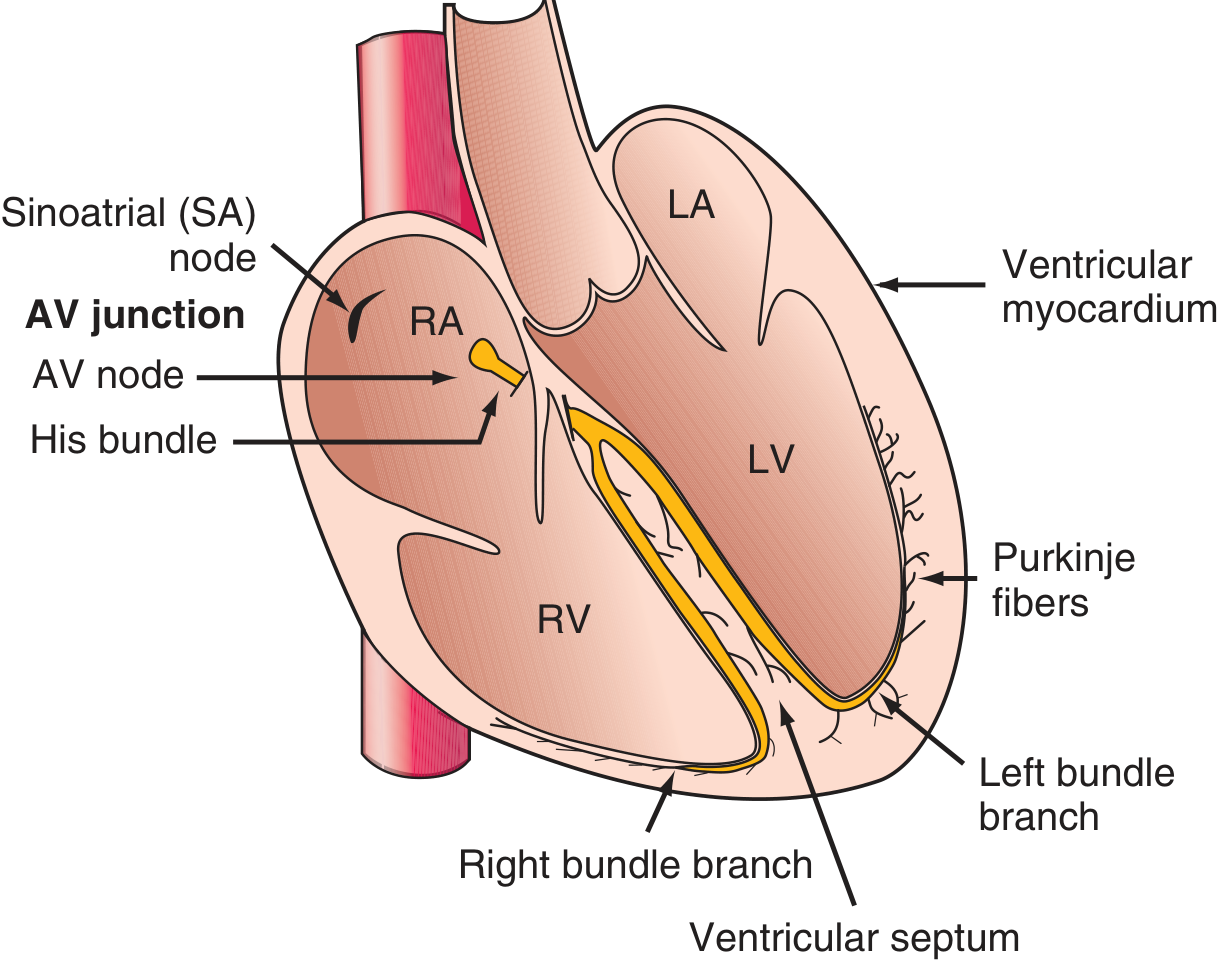
FIGURE 247-1 from Harrison's Principles of Internal Medicine 22E - Schematic of the cardiac conduction system
Key clinical point: If the SA node fails, the AV node takes over at ~40-60 bpm. If the AV node fails, the ventricles pace themselves at ~20-40 bpm (very slow and dangerous).
- Gray's Anatomy for Students; Harrison's 22E
3. The ECG Waveform: P-QRS-T
Every single heartbeat produces a characteristic pattern of waves. Here is what each represents:
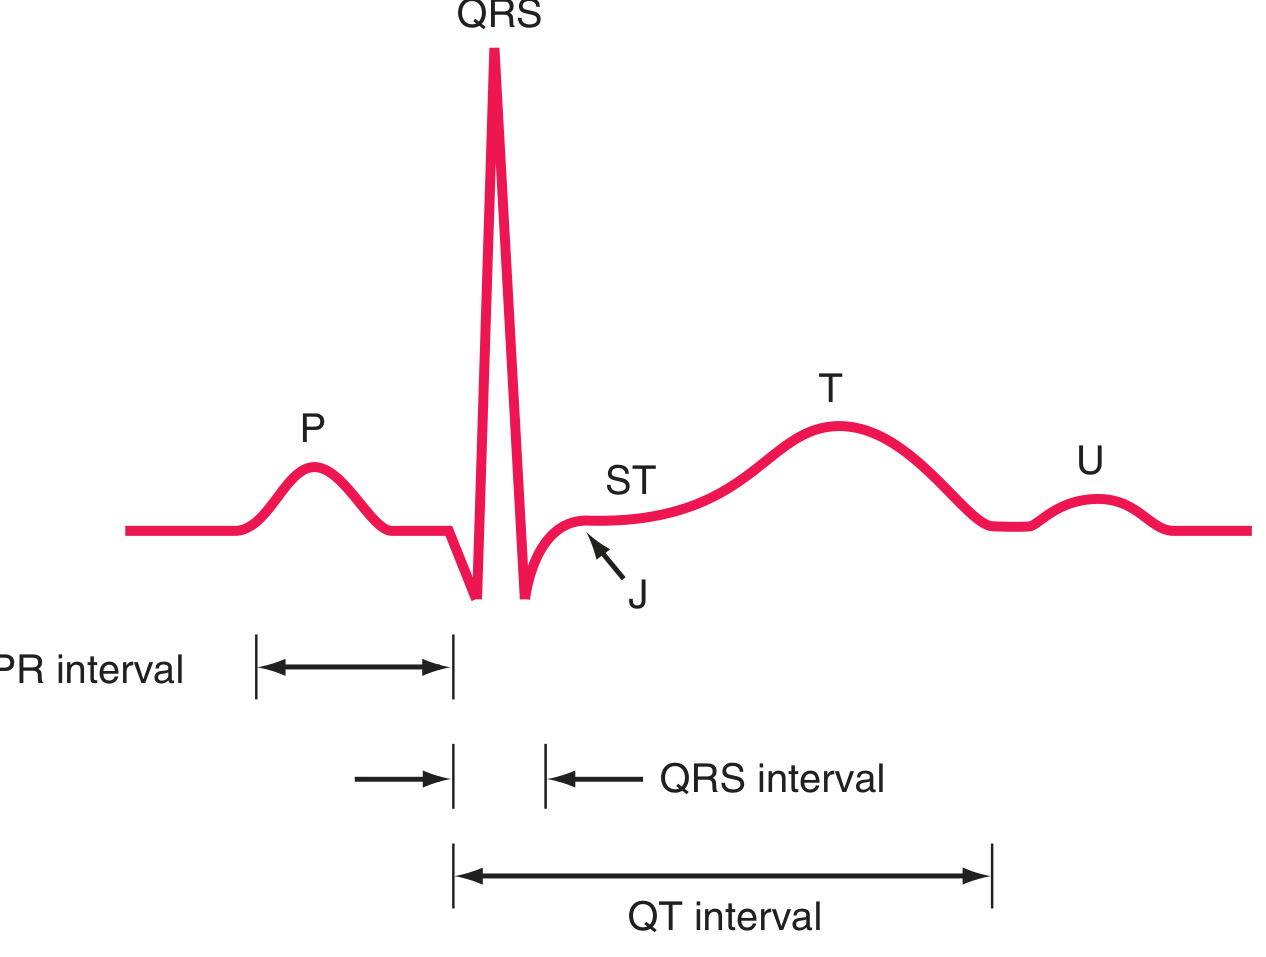
FIGURE 247-2 from Harrison's Principles of Internal Medicine 22E - Basic ECG waveforms and intervals
P Wave
- Represents: Atrial depolarization (both atria contract)
- Duration: 0.06-0.12 seconds (1.5-3 small boxes)
- Amplitude: 2-3 mm high normally
- Normal appearance: Small, rounded, upright in lead II; negative in aVR
- In lead V1, it may be biphasic (positive component = right atrium, negative = left atrium)
PR Interval
- Represents: Time from start of atrial depolarization to start of ventricular depolarization - includes the AV node delay
- Normal: 120-200 ms (3-5 small boxes)
- A prolonged PR (>200 ms) = first-degree AV block
QRS Complex
- Represents: Ventricular depolarization (both ventricles contract)
- Duration: Normally ≤100-110 ms (≤2.5 small boxes)
- The QRS is larger than the P wave because ventricular muscle mass is much greater than atrial mass
- Q wave: Small initial downward deflection (septal depolarization, left→right)
- R wave: Tall upward spike
- S wave: Downward deflection after R
- Not every QRS will have all three components
ST Segment
- Represents: Ventricular plateau phase (phase 2 of action potential) - isoelectric period between depolarization and repolarization
- Normally flat (isoelectric)
- ST elevation = acute myocardial infarction (STEMI) or pericarditis
- ST depression = ischemia or NSTEMI
T Wave
- Represents: Ventricular repolarization (ventricles "recharging")
- Occurs 0.25-0.35 seconds after depolarization
- Normally upright in most leads
- This is a repolarization wave (opposite mechanism to the depolarization waves)
QT Interval
- Represents: Total ventricular activity (depolarization + repolarization)
- Normally: ≤460 ms in women, ≤450 ms in men (corrected for rate = QTc)
- Prolonged QT = risk of dangerous arrhythmia (torsades de pointes)
U Wave
- Small wave after T wave; seen in some leads
- May represent late repolarization of Purkinje fibers
Mnemonic: "P-QRS-T" = Please Queen, Rest Some Time
- Harrison's Principles of Internal Medicine 22E; Guyton & Hall Medical Physiology
4. The ECG Paper
The ECG is recorded on standardized graph paper at a speed of 25 mm/second:
| Division | Size | Time | Voltage |
|---|---|---|---|
| Small box | 1 mm | 0.04 s (40 ms) | 0.1 mV |
| Large box | 5 mm | 0.20 s (200 ms) | 0.5 mV |
Standard calibration: 1 mV = 10 mm (a 1 mV calibration pulse = 2 large boxes tall).
5. Calculating Heart Rate
Regular rhythm - two quick methods:
-
300 ÷ number of large boxes between two R waves
- 1 large box = 300 bpm, 2 = 150, 3 = 100, 4 = 75, 5 = 60, 6 = 50
- Easy memory trick: "300, 150, 100, 75, 60, 50"
-
For irregular rhythms: Count the number of QRS complexes in 10 seconds (one rhythm strip) and multiply by 6.
Normal heart rate: 60-100 bpm
6. The 12 ECG Leads
A standard ECG has 12 leads - think of them as 12 different "camera angles" looking at the same electrical activity from different directions.
Two groups:
Limb Leads (6) - view the heart in the frontal plane:
| Lead | View |
|---|---|
| I | Lateral |
| II | Inferior |
| III | Inferior |
| aVR | Right side (normally negative) |
| aVL | Lateral |
| aVF | Inferior |
Precordial Leads (6) - view the heart in the horizontal plane:
| Lead | Position | View |
|---|---|---|
| V1 | 4th intercostal space, right sternal border | Septal/Right ventricle |
| V2 | 4th intercostal space, left sternal border | Septal |
| V3 | Between V2 and V4 | Anterior |
| V4 | 5th intercostal space, midclavicular line | Anterior |
| V5 | Anterior axillary line | Lateral |
| V6 | Midaxillary line | Lateral |
Key rule: A lead records a positive (upward) deflection when the depolarization wave moves toward its positive electrode; a negative deflection when it moves away.
- Harrison's Principles of Internal Medicine 22E
7. A Systematic Approach to Reading Any ECG
Use this checklist on every ECG you read - never skip steps:
- Rate - Is it normal (60-100), slow (<60 = bradycardia), or fast (>100 = tachycardia)?
- Rhythm - Regular or irregular? Is every P wave followed by a QRS?
- P wave - Present? Normal shape? Upright in II? Every P followed by QRS?
- PR interval - Normal (120-200 ms)?
- QRS duration - Narrow (<120 ms) or wide (≥120 ms)? Wide = bundle branch block or ventricular origin
- ST segment - Flat, elevated, or depressed?
- T wave - Upright, inverted, peaked?
- QT interval - Normal for the rate?
- Axis - Normal (-30° to +90°)? Left or right axis deviation?
8. Common Beginner Patterns to Recognize
| Pattern | Key Finding |
|---|---|
| Normal sinus rhythm | P before every QRS, rate 60-100, regular |
| Sinus tachycardia | Same as above, rate >100 |
| Sinus bradycardia | Same as above, rate <60 |
| Atrial fibrillation | No P waves, irregularly irregular rhythm |
| 1st degree AV block | Long PR interval (>200 ms) |
| STEMI | ST elevation in contiguous leads |
| Left bundle branch block | Wide QRS ≥120 ms, "W" in V1, "M" in V6 |
9. What to Study Next (Learning Roadmap)
- Start with: Normal sinus rhythm recognition - master the normal before the abnormal
- Then: Arrhythmias - sinus tachycardia/bradycardia, atrial fibrillation, SVT
- Then: Conduction blocks - AV blocks (1st, 2nd, 3rd degree) and bundle branch blocks
- Then: Ischemia/infarction patterns - STEMI, NSTEMI, old MI (Q waves)
- Then: Axis determination and chamber hypertrophy
- Advanced: Electrolyte abnormalities on ECG, drug effects (digoxin, QT-prolonging drugs)
Recommended resources:
- Goldberger's Clinical Electrocardiography (10th ed.) - the classic beginner textbook
- Life in the Fast Lane ECG Library - free, comprehensive online reference
- ECG Wave-Maven (Harvard) - free ECG practice cases
- Ninja Nerd ECG Lecture - popular video lecture
Sources: Harrison's Principles of Internal Medicine 22E (2025); Guyton & Hall Textbook of Medical Physiology; Gray's Anatomy for Students
Explain how to calculate electrical axis and measure axis deviation
Finding Sources
Finding Sources
Searching the Web
ECG electrical axis calculation method lead I aVF hexaxial reference system axis deviation
Finding Sources
Reading File
Reading File
Loading Image
Reading File
Loading Image
Reading File
Loading Image
Excellent - I now have everything needed from Guyton & Hall and Harrison's. Let me compile the full explanation.
Electrical Axis: How to Calculate It and Identify Axis Deviation
1. What Is the Electrical Axis?
The mean electrical axis is the average direction of the depolarization wavefront as it travels through the ventricular myocardium during a single heartbeat. Because the left ventricle has far more muscle mass than the right, the net electrical force during depolarization normally points downward and to the left - toward the apex of the heart.
The mean electrical axis of the normal ventricles is approximately +59°, and it can range from about +20° to +100° in healthy individuals, depending on heart position, body habitus, and Purkinje distribution.
- Guyton & Hall Textbook of Medical Physiology
2. The Hexaxial Reference System
The six limb leads (I, II, III, aVR, aVL, aVF) are arranged around the heart at fixed angles. Together they form the hexaxial reference system - a 360° "clock face" around the heart that allows you to assign a degree value to any axis.
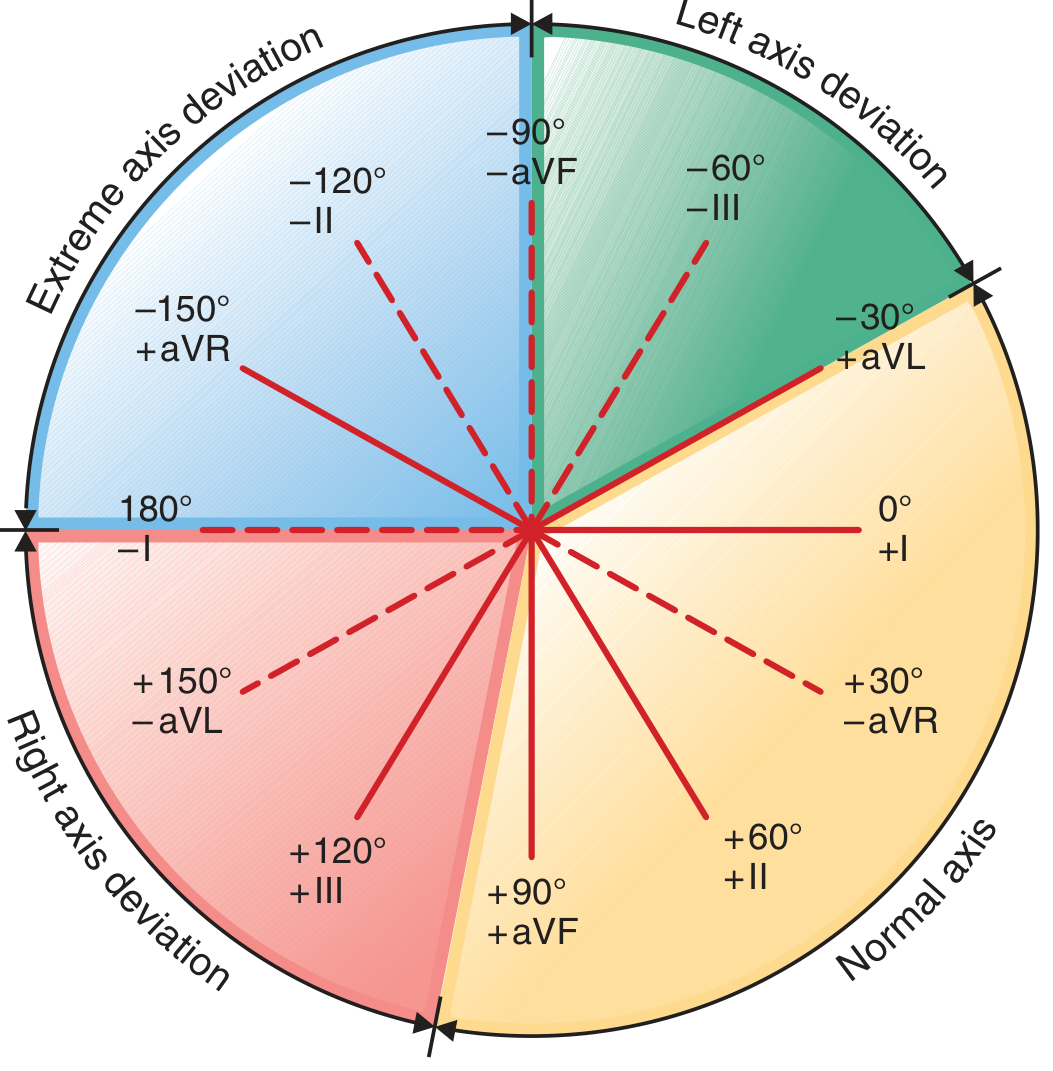
FIGURE 247-4 from Harrison's Principles of Internal Medicine 22E - The hexaxial diagram
Lead positions on the hexaxial circle:
| Lead | Positive Pole Angle |
|---|---|
| Lead I | 0° (pointing left) |
| Lead II | +60° |
| aVF | +90° (pointing down) |
| Lead III | +120° |
| aVL | −30° |
| aVR | −150° |
The rule: A lead records a positive (upward) deflection when the depolarization wave moves toward its positive pole, and a negative deflection when it moves away. If the vector is perpendicular to a lead, the QRS is biphasic (equally positive and negative).
3. Methods of Calculating the Axis
Method 1 - The Precise Vector Method (Guyton)
This is the mathematically exact approach using Leads I and III:
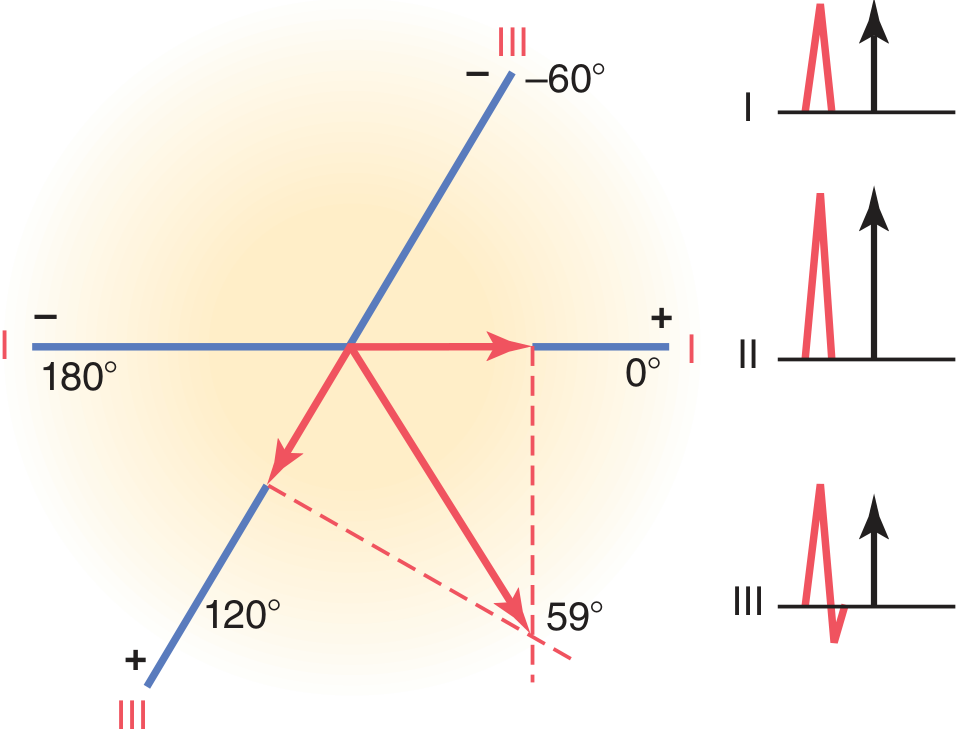
Figure 12.11 from Guyton & Hall - Plotting the mean electrical axis from leads I and III
Steps:
- Measure the net QRS deflection in Lead I - add up positive mm, subtract negative mm (R - S - Q = net)
- Measure the net QRS deflection in Lead III - same method
- Draw the hexaxial diagram on paper
- Plot the Lead I net value along the Lead I axis (0° line), measured from the center
- Plot the Lead III net value along the Lead III axis (120° line), measured from the center
- Drop perpendicular lines from the tip of each plotted point
- The point where the two perpendiculars intersect = the tip of the mean QRS vector
- Draw a line from the center of the diagram to that intersection point - this is your axis
- Read the angle from the hexaxial reference
Example from Guyton: Lead I net = positive, Lead III net = positive → perpendiculars intersect at approximately +59° = normal axis.
- Guyton & Hall Textbook of Medical Physiology
Method 2 - The Quick Two-Lead Quadrant Method (Clinical Bedside)
In practice, the fastest and most widely used method uses Lead I and Lead aVF to place the axis into one of four quadrants:
| Lead I | Lead aVF | Axis Quadrant | Interpretation |
|---|---|---|---|
| ✅ Positive | ✅ Positive | 0° to +90° | Normal axis |
| ✅ Positive | ❌ Negative | 0° to −90° | Left axis deviation (LAD) |
| ❌ Negative | ✅ Positive | +90° to +180° | Right axis deviation (RAD) |
| ❌ Negative | ❌ Negative | −90° to ±180° | Extreme axis deviation ("northwest axis") |
Then use Lead II to refine within the LAD quadrant:
- Lead I positive + aVF negative + Lead II positive → axis between 0° and −30° → normal variant (or physiologic LAD)
- Lead I positive + aVF negative + Lead II negative → axis more negative than −30° → true pathological LAD
Method 3 - The Isoelectric (Perpendicular) Method
This is the most precise quick method:
- Find the lead with the most biphasic/isoelectric QRS (positive and negative deflections roughly equal, net ≈ 0)
- The true axis is perpendicular to that lead (90° away)
- Look at the perpendicular lead to determine which of the two possible perpendicular directions is positive
Example: If lead aVL (at −30°) is isoelectric, the axis must be perpendicular = either +60° or −120°. Look at lead II (+60°): if lead II is positive, the axis is +60°.
4. Normal vs. Abnormal Axis - Reference Table
| Category | Axis Range | Lead I | aVF | Lead II |
|---|---|---|---|---|
| Normal axis | −30° to +90° | Positive | Positive | Positive |
| Left axis deviation (LAD) | −30° to −90° | Positive | Negative | Negative |
| Right axis deviation (RAD) | +90° to +180° | Negative | Positive | Positive/Negative |
| Extreme axis deviation | −90° to ±180° | Negative | Negative | - |
Note: Some sources define normal as 0° to +90°, treating −30° to 0° as "physiologic LAD." The clinical threshold for pathological LAD is more negative than −30°.
5. Causes of Axis Deviation
Left Axis Deviation (LAD) - axis more negative than −30°
The axis shifts left when the left side of the heart dominates electrically or conducts more slowly:
| Cause | Mechanism |
|---|---|
| Left ventricular hypertrophy | More LV muscle mass generates greater leftward potential |
| Left anterior fascicular block (LAFB) | Most common cause of LAD; blocks anterior division of left bundle |
| Left bundle branch block (LBBB) | RV depolarizes first → vector points toward delayed LV (−50°) |
| Inferior MI | Loss of inferior wall depolarization forces shifts axis superiorly |
| Obesity / high diaphragm | Heart physically tilts left |
| Wolff-Parkinson-White | Accessory pathway changes initial vector |
| Hyperkalemia | Slows conduction asymmetrically |
From Guyton: In LBBB, the left ventricle remains electropositive while the right has already depolarized - creating a strong vector toward the left, producing axis around −50°.
Right Axis Deviation (RAD) - axis more positive than +90°
| Cause | Mechanism |
|---|---|
| Right ventricular hypertrophy | More RV mass (e.g., pulmonary hypertension, pulmonary stenosis, cor pulmonale) |
| Right bundle branch block (RBBB) | LV depolarizes first → vector points toward delayed RV (+105°) |
| Left posterior fascicular block (LPFB) | Blocks posterior division; diagnosis of exclusion |
| Anterolateral MI | Loss of leftward forces from LV lateral wall |
| Tall, thin body habitus | Heart hangs vertically |
| Deep inspiration | Diaphragm descends, heart becomes more vertical |
| Dextrocardia | Heart in right chest |
| Wolff-Parkinson-White (left-sided pathway) | Accessory pathway changes vector |
From Guyton: In right ventricular hypertrophy from pulmonary valve stenosis, the axis can reach +170° - 111° to the right of the normal axis of +59°.
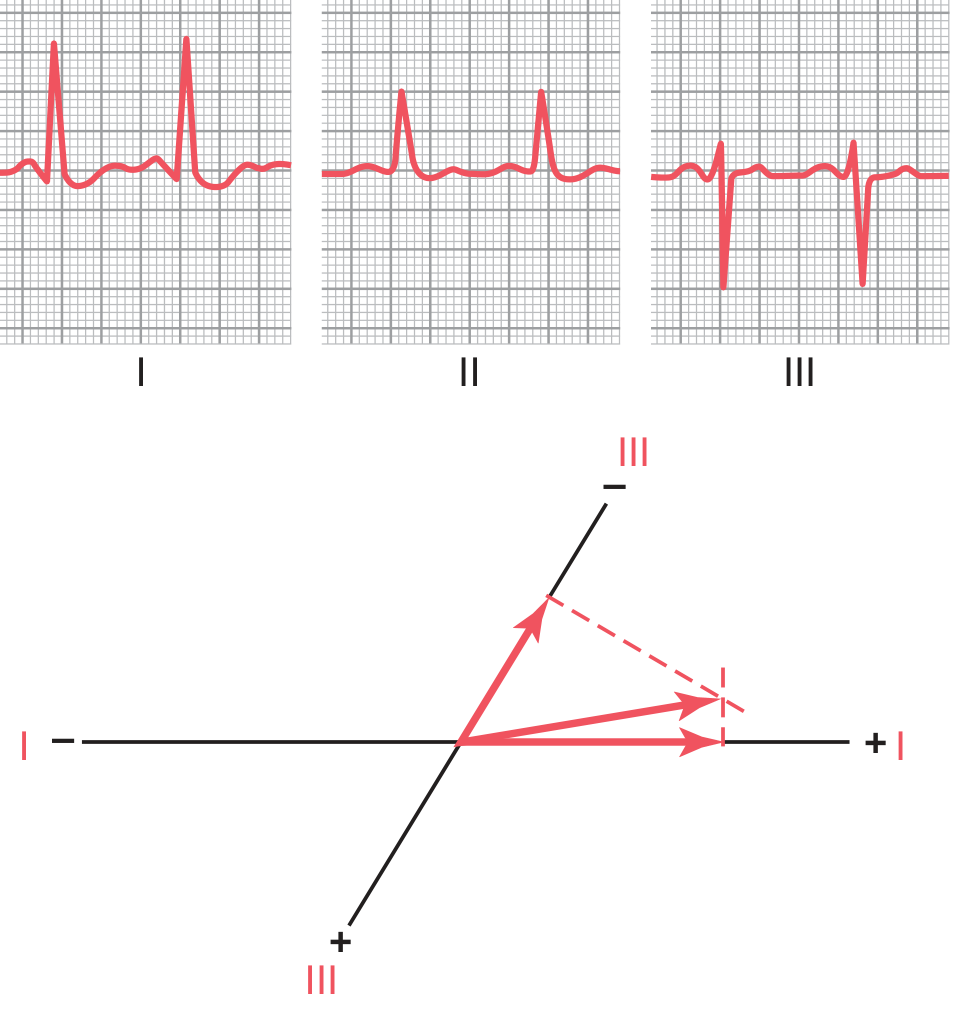
Figure 12.12 from Guyton & Hall - Left axis deviation in hypertensive LVH, axis at −15°
6. Worked Example - How to Determine Axis Step by Step
Given ECG findings:
- Lead I: tall R wave (positive, net +8 mm)
- aVF: small net negative (−2 mm)
- Lead II: net negative
Step 1: Lead I positive, aVF negative → upper-left quadrant (0° to −90°) → LAD
Step 2: Lead II is also negative → axis is more negative than −30° → pathological LAD
Step 3 (optional refinement): Look for the most isoelectric lead. If aVR is isoelectric (net ≈ 0), the axis is perpendicular to aVR (−150°), meaning it's at either −60° or +30°. Since we already know it's in the LAD quadrant → axis ≈ −60°
Conclusion: Pathological left axis deviation. In the right clinical context, this suggests left anterior fascicular block or LVH.
7. Quick Summary Card
NORMAL: Lead I ↑ aVF ↑ → 0° to +90°
LAD: Lead I ↑ aVF ↓ → more negative than −30°
RAD: Lead I ↓ aVF ↑ → more positive than +90°
EXTREME: Lead I ↓ aVF ↓ → "northwest" axis
Refine LAD with Lead II:
Lead II ↑ = mild/physiologic (0° to −30°)
Lead II ↓ = pathological (< −30°)
Most common causes:
LAD → LAFB, LVH, inferior MI
RAD → RVH, RBBB, LPFB
Sources: Guyton & Hall Textbook of Medical Physiology; Harrison's Principles of Internal Medicine 22E (2025)
Now i want to learn different abnornal ecg
Asking for Preferences
Finding Sources
Finding Sources
Finding Sources
Finding Sources
Finding Sources
Finding Sources
Finding Sources
Reading File
Reading File
Reading File
Reading File
Loading Image
Loading Image
Reading File
Reading File
Loading Image
Loading Image
Reading File
Reading File
Loading Image
Loading Image
Finding Sources
Reading File
Finding Sources
Loading Image
Reading File
That covers all five major categories at an advanced level. Here is a quick map of what was covered:
6 Sections, 30+ patterns:
- Arrhythmias - AF, atrial flutter, SVT/AVNRT, VT (with Brugada algorithm for VT vs SVT-aberrancy), VF, Torsades de Pointes
- Conduction Blocks - 1st/2nd/3rd degree AV blocks (Mobitz I vs II differentiation in detail), RBBB, LBBB, Sgarbossa criteria for ischemia in LBBB, fascicular blocks
- Ischemia/MI - Mechanisms of ST deviation, STEMI by territory with culprit arteries, evolutionary changes, Wellens syndrome, NSTEMI, posterior STEMI (most commonly missed), pericarditis vs STEMI
- Hypertrophy - LVH voltage criteria (Sokolow-Lyon, Cornell), RVH, right/left atrial enlargement
- Electrolytes/Drugs - Hyperkalemia progression to sine-wave, hypokalemia U waves, hypo/hypercalcemia, hypothermia Osborn wave, digoxin scooping, QT-prolonging drugs
- Special Patterns - WPW (with danger of AF+WPW), Brugada syndrome, early repolarization, congenital long QT
The summary table at the end can serve as a quick revision card. Let me know if you'd like any section expanded further - for example, a dedicated deep-dive into localization of MI territories, or specific arrhythmia management algorithms.
This is a shared conversation. Sign in to Orris to start your own chat.