
Urine formation notes for university exam
urine formation nephron glomerular filtration reabsorption secretion diagram
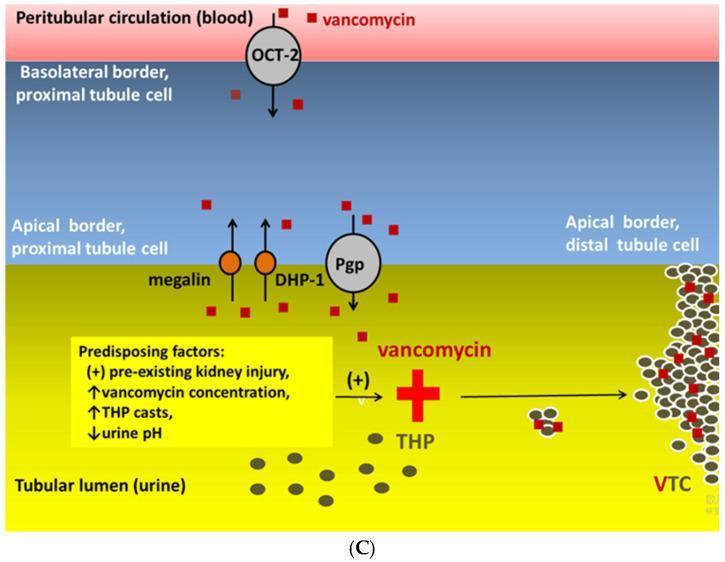
A medical pathophysiology diagram illustrating the formation of vancomycin-associated tubular casts (VTC) within the nephron. The schematic depicts four horizontal compartments: the peritubular circulation (blood), the proximal tubule cell (basolateral and apical borders), and the tubular lumen (urine). Vancomycin molecules, represented as red squares, are shown entering the proximal tubule cell from the blood via the OCT-2 (organic cation transporter 2) at the basolateral border. At the apical border, reabsorption is mediated by megalin and dehydropeptidase-1 (DHP-1), while P-glycoprotein (Pgp) facilitates transport between the lumen and distal tubule cells. In the tubular lumen, vancomycin interacts with Tamm-Horsfall glycoprotein (THP), leading to the formation of large VTC aggregates (indicated by a red plus sign). A yellow text box highlights predisposing factors for VTC formation, including pre-existing kidney injury, elevated vancomycin concentration, increased THP casts, and decreased urine pH. This diagram serves as an educational tool for understanding the localized necrotic and obstructive mechanisms of vancomycin-induced acute kidney injury (VA-AKI).
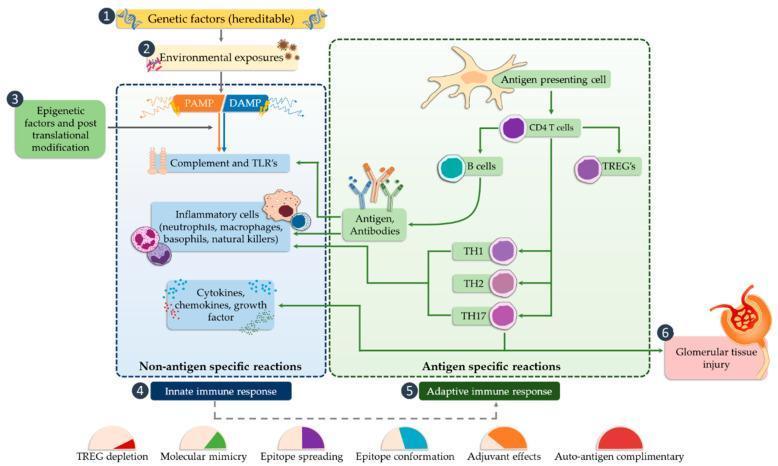
This pathophysiology flow diagram illustrates the multi-step immune signaling pathway leading to glomerular tissue injury in the nephron. The process is initiated by three primary drivers: genetic factors (heritable), environmental exposures, and epigenetic factors coupled with post-translational modifications. These drivers trigger the 'Innate Immune Response' (Non-antigen specific reactions), characterized by the activation of Pathogen-Associated Molecular Patterns (PAMPs) and Damage-Associated Molecular Patterns (DAMPs). This activates the complement system, Toll-Like Receptors (TLRs), and inflammatory cells (neutrophils, macrophages, basophils, NK cells), leading to the release of cytokines, chemokines, and growth factors. The pathway then transitions to the 'Adaptive Immune Response' (Antigen-specific reactions), where antigen-presenting cells activate CD4+ T cells, B cells, and TREGs. Further differentiation into TH1, TH2, and TH17 cells, along with antigen-antibody complex formation, culminates in glomerular tissue injury. The diagram also identifies key mechanisms of immune dysregulation below the main flow, including TREG depletion, molecular mimicry, epitope spreading, epitope conformation, adjuvant effects, and auto-antigen complementarity.
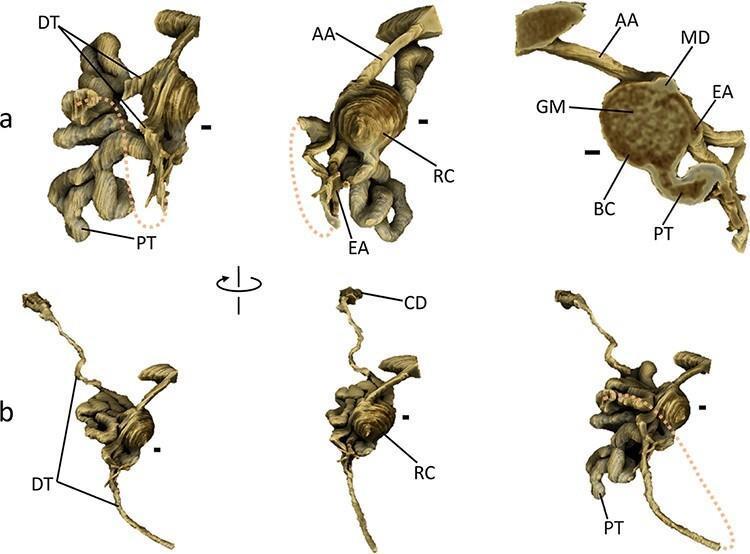
Anatomical diagram featuring high-resolution 3D renderings of a single mouse nephron, highlighting renal microstructure and spatial arrangement. Panel (a) provides detailed views of the renal corpuscle (RC), demonstrating the spherical Bowman's capsule (BC) and internal glomerulus (GM). It clearly illustrates the vascular pole with the afferent arteriole (AA), efferent arteriole (EA), and the macula densa (MD) of the distal tubule (DT) forming a v-shaped contact point. The tubular pole shows the exit of the highly convoluted proximal tubule (PT). Panel (b) illustrates the longitudinal progression from the renal corpuscle through the PT and DT to the collecting duct (CD). The rendering distinguishes between the intensely convoluted segments near the corpuscle and the straighter distal segments of the tubules. Key educational concepts include the juxtaglomerular apparatus anatomy, the morphology of glomerular filtration components, and the physical relationship between various segments of the nephron and their associated vasculature, essential for understanding renal physiology and pathology.
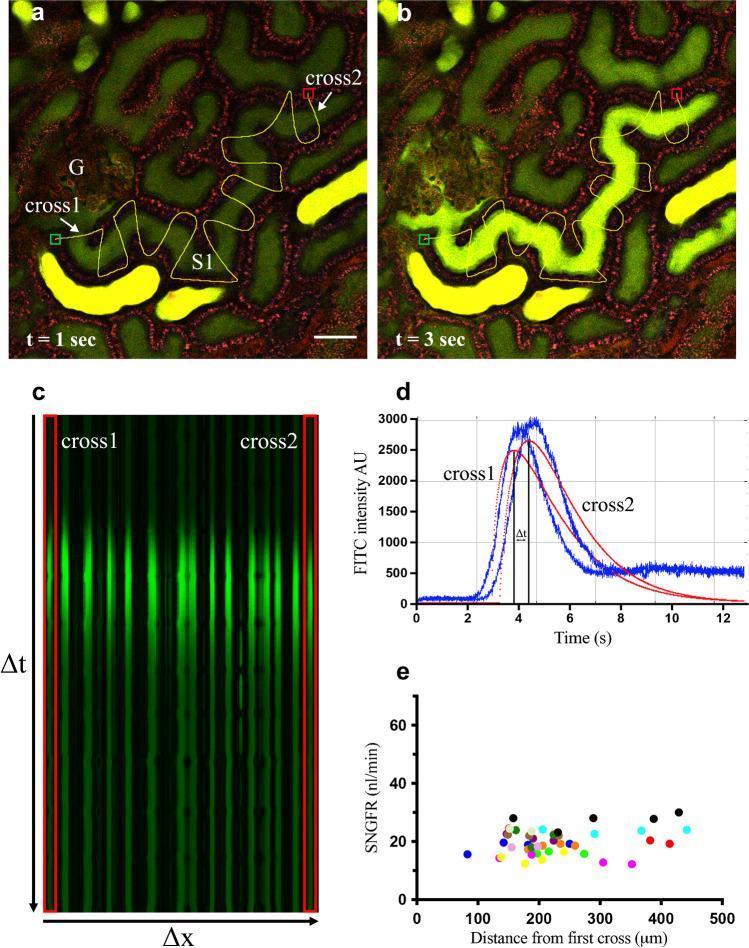
This composite educational image illustrates the 'linescan method' for in vivo measurement of single-nephron glomerular filtration rate (SNGFR). Panels (a) and (b) are multiphoton microscopy (MPM) frames showing the filtration of a green fluorescent dye (FITC-dextran, 3–5 kDa) from a glomerulus (G) into the early proximal tubule (S1) at t=1 second and t=3 seconds. The image demonstrates the temporal progression of the fluorescent bolus along the tubular lumen. Panel (c) displays the resulting x–t (space-time) linescan plot, where vertical green lines represent the dye crossing hand-drawn perpendicular paths (cross1 and cross2). The downward shift of peak fluorescence intensity along the y-axis (time) indicates the velocity of fluid movement. Panel (d) shows quantitative fluorescence intensity curves over time for two selected crossings, used to calculate the time delay (ΔT) between peak bolus concentrations. Panel (e) is a scatter plot validating the consistency of SNGFR measurements (nl/min) across varying distances from the glomerulus, demonstrating the method's precision in assessing renal physiology and filtration dynamics.
Urine Formation - Complete University Exam Notes
1. Overview and the Master Equation
Urinary Excretion = Glomerular Filtration - Tubular Reabsorption + Tubular Secretion
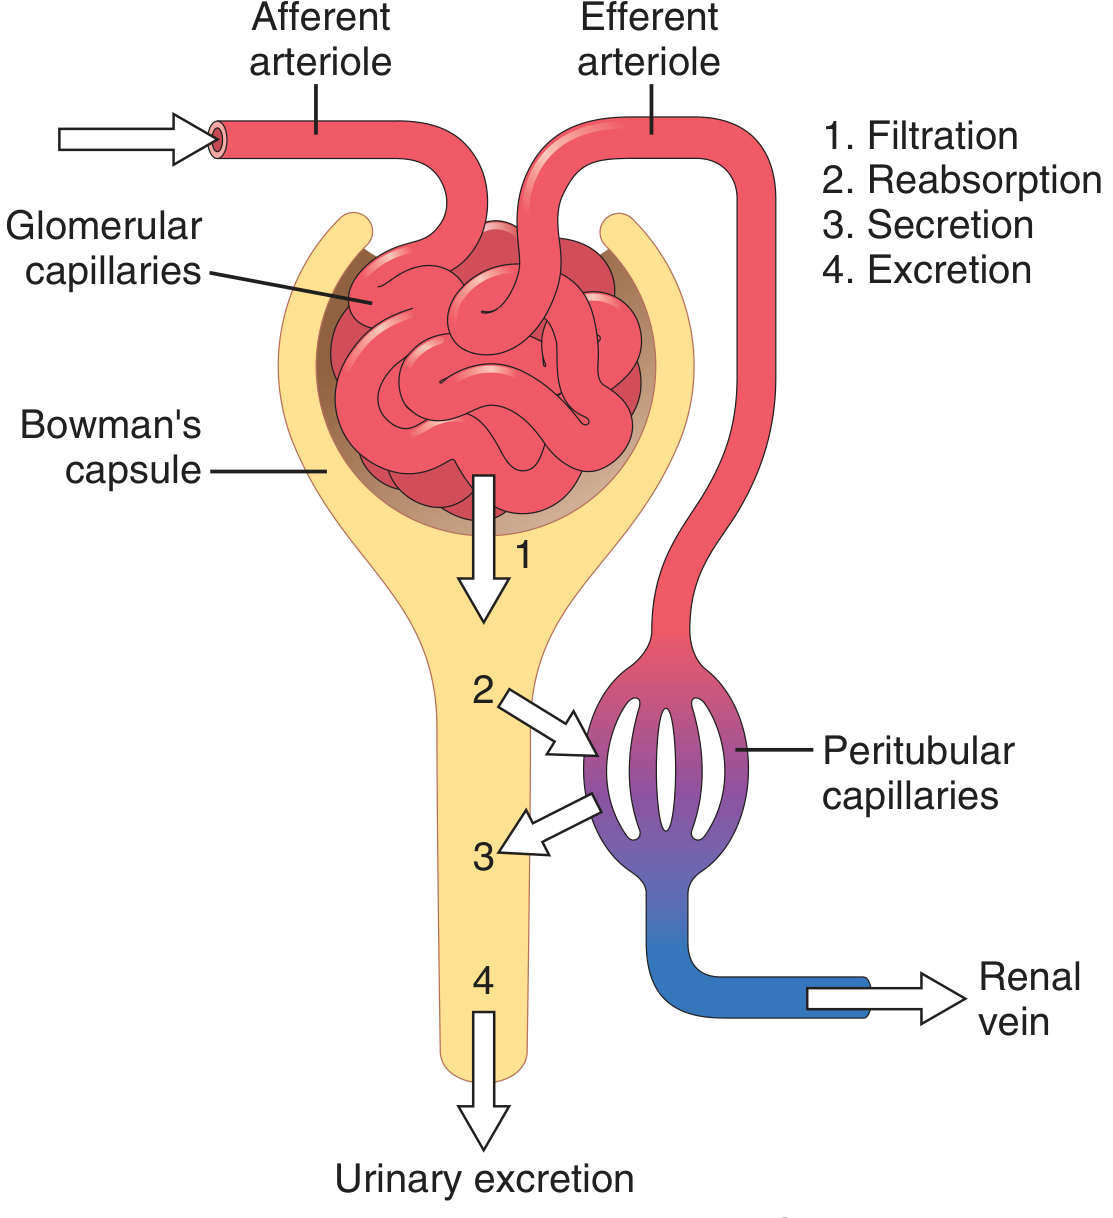
2. Step 1 - Glomerular Filtration
What is Filtered
Driving Force (Net Filtration Pressure)
- Glomerular capillary hydrostatic pressure (promotes filtration) ~60 mmHg
- Bowman's capsule hydrostatic pressure (opposes filtration) ~18 mmHg
- Glomerular colloid osmotic pressure of plasma proteins (opposes filtration) ~32 mmHg
GFR (Glomerular Filtration Rate)
- Normal GFR = 125 mL/min (~180 L/day)
- Calculated as: Filtration rate = GFR × Plasma concentration
- Example: If plasma glucose = 1 g/L → filtered glucose = 180 L/day × 1 g/L = 180 g/day
The Glomerular Filtration Barrier
- Glomerular capillary endothelium (fenestrated)
- Basement membrane
- Podocyte epithelium with slit diaphragms
3. Step 2 - Tubular Reabsorption
Transport Mechanisms
| Type | Example | Description |
|---|---|---|
| Primary active | Na⁺-K⁺-ATPase | Directly uses ATP; drives >99% of Na⁺ reabsorption |
| Secondary active | Na⁺-glucose co-transport | Driven by Na⁺ gradient created by ATPase |
| Passive | Cl⁻ diffusion, water via osmosis | Follows concentration/osmotic gradients |
| Facilitated | Urea transport | Carrier-mediated, no energy input |
Reabsorption along the Nephron Segments
A. Proximal Tubule (reabsorbs ~65% of filtrate)
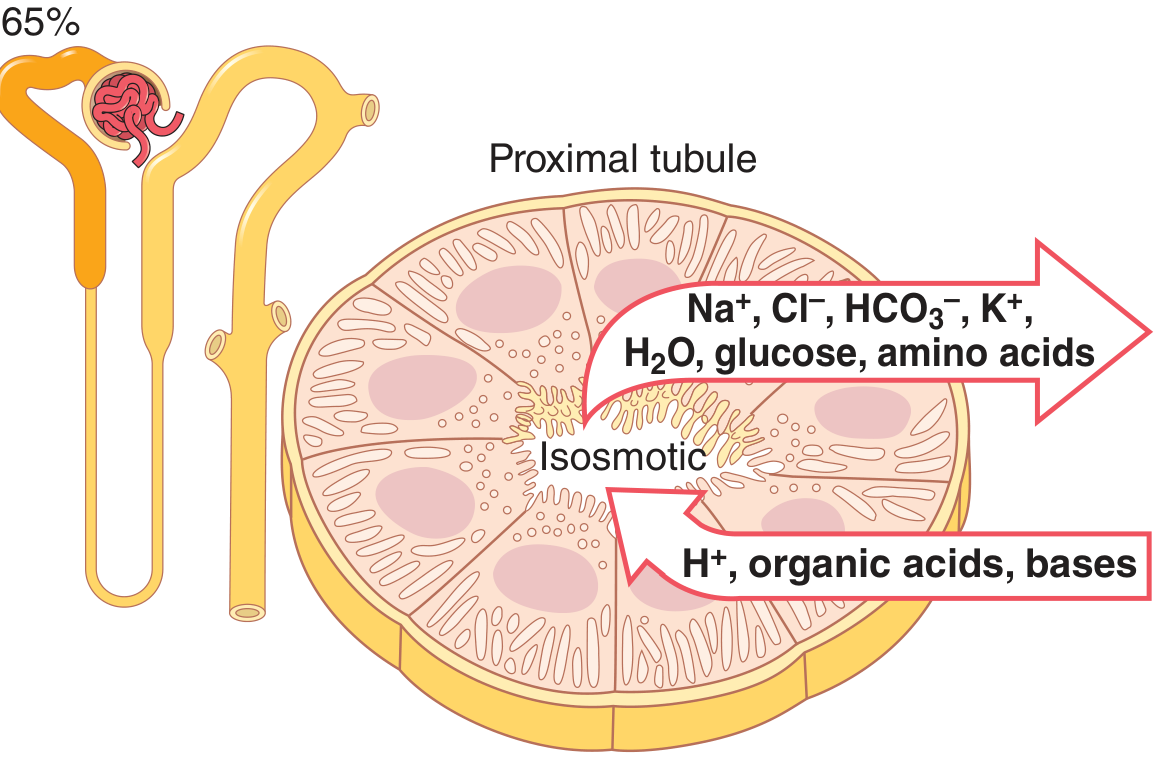
- Reabsorbs 65% of filtered Na⁺, Cl⁻, HCO₃⁻, K⁺, and water
- Reabsorbs virtually 100% of filtered glucose and amino acids
- Secretes 90% of H⁺ excreted by the kidney
- Special cellular features: brush border (microvilli) on luminal side, extensive basolateral channels, abundant mitochondria
- Fluid reabsorbed isosmotically (osmolarity stays ~300 mOsm/L)
- H⁺ (via Na⁺-H⁺ exchanger)
- Organic acids and bases (e.g., para-aminohippuric acid / PAH - used to estimate renal plasma flow)
- Drugs and toxins (e.g., penicillin, salicylates)
- Creatinine (small amount)
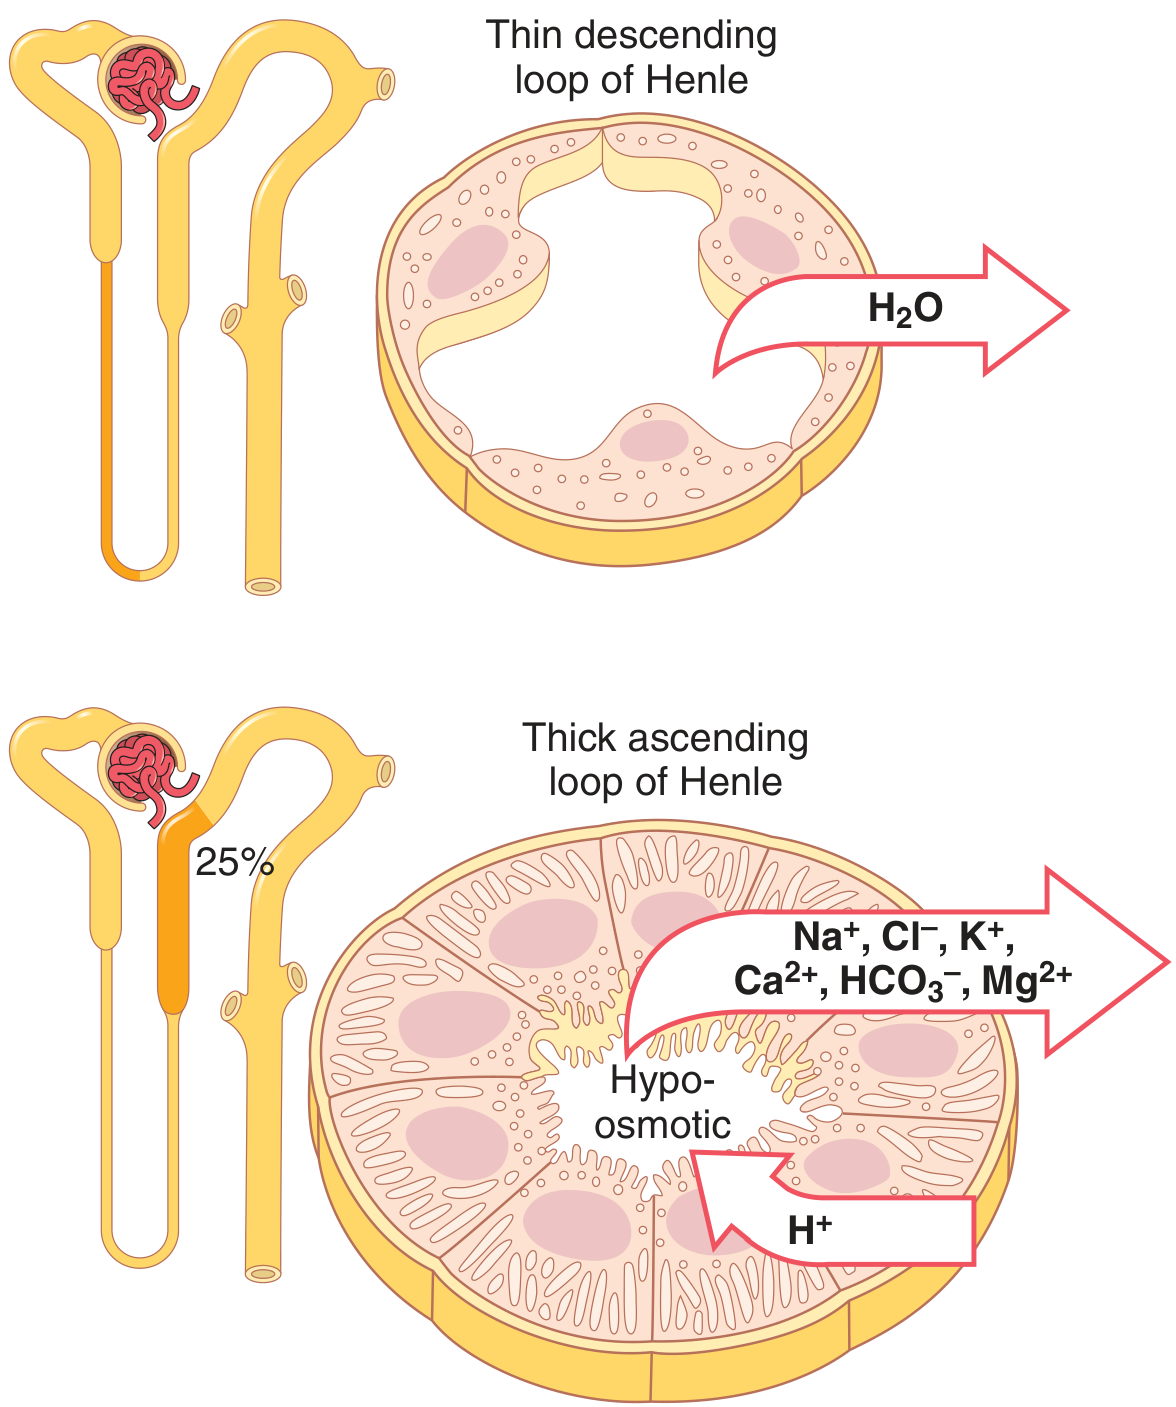
B. Loop of Henle (reabsorbs ~20% of water, ~25% of Na⁺/Cl⁻/K⁺)
| Segment | Water Permeability | Solute Transport |
|---|---|---|
| Thin descending limb | High (AQP-1 channels) | Water reabsorbed passively; solutes concentrated |
| Thin ascending limb | Virtually zero | Little active transport |
| Thick ascending limb (TAL) | Virtually zero | Active Na⁺, K⁺, Cl⁻ reabsorption via NKCC2 co-transporter |
- Key fact: The ascending limb is impermeable to water - this is critical for generating the medullary osmotic gradient that concentrates urine
- TAL reabsorbs ~25% of filtered Na⁺, Cl⁻, K⁺, plus large amounts of Ca²⁺, HCO₃⁻, Mg²⁺
- Loop diuretics (e.g., furosemide) inhibit the NKCC2 co-transporter in TAL
- Fluid leaving the loop of Henle is hypo-osmotic (~100 mOsm/L) - the loop acts as a diluting segment
C. Early Distal Tubule (reabsorbs ~5% of filtered NaCl)
- Reabsorbs ~5% of filtered NaCl via a Na⁺-Cl⁻ co-transporter (NCC)
- Virtually impermeable to water and urea
- Continues to dilute tubular fluid
- Thiazide diuretics inhibit the NCC co-transporter here - used in hypertension and heart failure - Guyton and Hall, p. 356
D. Late Distal Tubule and Cortical Collecting Tubule
| Cell Type | Function |
|---|---|
| Principal cells | Reabsorb Na⁺ (via ENaC channels) and water; secrete K⁺ |
| Type A intercalated cells | Reabsorb K⁺ and HCO₃⁻; secrete H⁺ (acidifies urine) |
| Type B intercalated cells | Opposite: secrete HCO₃⁻ and reabsorb H⁺ |
- Aldosterone acts on principal cells → increases ENaC channels and Na⁺-K⁺-ATPase → more Na⁺ reabsorption, more K⁺ secretion
- Potassium-sparing diuretics (e.g., spironolactone, amiloride) block principal cells
- ADH (antidiuretic hormone / vasopressin) inserts aquaporin-2 (AQP-2) water channels into principal cell luminal membranes → makes collecting duct permeable to water → water reabsorbed → concentrated urine
E. Medullary Collecting Duct
- Final site of regulation of urine concentration
- ADH increases AQP-2 and AQP-3/4 (basolateral) water channels
- Urea is reabsorbed here, contributing to the medullary hyperosmotic gradient
- The final urine can be concentrated up to ~1200 mOsm/L or diluted down to ~50 mOsm/L depending on ADH levels
4. Step 3 - Tubular Secretion
- K⁺ - mainly secreted in collecting tubule (regulated by aldosterone)
- H⁺ - secreted in proximal tubule (90%), TAL, distal tubule, collecting duct - vital for acid-base balance
- Organic anions and cations - drugs, toxins, PAH (a probe for measuring RPF)
- Creatinine - small secretory component, why plasma creatinine slightly underestimates true GFR
5. The Countercurrent Mechanism (Concentrating Urine)
Countercurrent Multiplier (Loop of Henle)
- The thick ascending limb actively pumps Na⁺, K⁺, and Cl⁻ into the medullary interstitium without water (impermeable to water)
- This builds up a progressive osmotic gradient from cortex to medulla (300 → 1200 mOsm/L)
- The descending limb is permeable to water - as it descends into the hypertonic medulla, water leaves and the fluid becomes concentrated
- This is a multiplier system: each pass through the loop amplifies the gradient
Countercurrent Exchanger (Vasa Recta)
- Vasa recta (capillaries alongside the loop) exchange solutes and water as blood flows down and up in opposite directions
- This preserves the medullary gradient without washing it away
Role of Urea
- Urea reabsorbed from the medullary collecting duct into the medullary interstitium contributes ~500 mOsm/L to the inner medullary gradient (out of ~1200 mOsm/L total)
- ADH increases urea permeability in the inner medullary collecting duct
ADH (Vasopressin) - Final Control
- Released from posterior pituitary when plasma osmolarity rises or blood volume falls
- Binds V2 receptors on principal cells → activates adenylyl cyclase → cAMP → PKA → inserts AQP-2 into luminal membrane
- Result: water is reabsorbed from collecting duct into hypertonic medullary interstitium → concentrated urine
- No ADH = dilute urine (diabetes insipidus)
6. Summary Table: What Each Segment Does
| Nephron Segment | % Filtered Water Reabsorbed | Key Substances | Key Features |
|---|---|---|---|
| Proximal tubule | ~65% | Na⁺, Cl⁻, HCO₃⁻, K⁺, glucose, AA, H₂O | Isosmotic; brush border; secretes H⁺, organic acids |
| Thin descending Loop | ~15% | H₂O only | Permeable to water; not to solutes |
| Thick ascending Loop | ~0% water | Na⁺, Cl⁻, K⁺, Ca²⁺, Mg²⁺, HCO₃⁻ | Impermeable to water; dilutes fluid; drives medullary gradient |
| Early distal tubule | ~0% | NaCl | Diluting segment; thiazide-sensitive |
| Late distal + cortical collecting | Variable (5-10%) | Na⁺, K⁺, H⁺ (regulated) | Aldosterone and ADH regulated |
| Medullary collecting duct | Variable (up to 19%) | H₂O, urea | ADH-dependent; final concentration |
7. Key Numbers to Memorize
| Parameter | Value |
|---|---|
| GFR | ~125 mL/min (~180 L/day) |
| Urine output (normal) | ~1.5 L/day |
| Daily ultrafiltrate produced | 170-200 L |
| Net filtration pressure | ~17 mmHg |
| Proximal tubule reabsorption | 65% of filtered load |
| Loop of Henle: water reabsorption | ~20% |
| Loop of Henle: NaCl reabsorption | ~25% |
| Maximum urine osmolarity | ~1200 mOsm/L |
| Minimum urine osmolarity | ~50 mOsm/L |
| Plasma osmolarity | ~300 mOsm/L |
8. Key Hormones Regulating Urine Formation
| Hormone | Site of Action | Effect |
|---|---|---|
| Aldosterone | Principal cells (late DT, collecting duct) | ↑ Na⁺ reabsorption, ↑ K⁺ secretion |
| ADH (Vasopressin) | Collecting duct | ↑ Water reabsorption (inserts AQP-2) |
| ANP (Atrial Natriuretic Peptide) | Collecting duct, afferent arteriole | ↑ GFR, ↓ Na⁺ reabsorption (natriuretic) |
| Parathyroid Hormone (PTH) | Proximal tubule, distal tubule | ↓ Phosphate reabsorption; ↑ Ca²⁺ reabsorption |
| Angiotensin II | Proximal tubule | ↑ Na⁺ and H₂O reabsorption; ↑ aldosterone |
9. Key Clinical Correlates (Exam Favourites)
- Glucosuria at normal blood glucose = proximal tubule defect (Fanconi syndrome - loss of all proximal transport)
- Diabetes insipidus = absent/non-functional ADH → massive dilute urine (up to 15-20 L/day)
- Hyperaldosteronism = excess Na⁺ retention + hypokalemia
- Loop diuretics (furosemide) = block NKCC2 in TAL → destroy medullary gradient → diuresis
- Thiazide diuretics = block NCC in early distal tubule → Na⁺ and water loss
- Tm (Transport maximum) for glucose = ~375 mg/min; exceeded when plasma glucose >180 mg/dL (renal threshold) → glycosuria in diabetes mellitus
- PAH clearance = estimates renal plasma flow (RPF) because ~90% of PAH is cleared in one pass