
Teach me alphafold in details: basic to advance using standard sources and explain with figure also
AlphaFold protein structure prediction deep learning explained basic to advanced
AlphaFold protein structure prediction
AlphaFold protein structure prediction architecture diagram
https://310.ai/blog/alphafold2-alphafold-multimer-alphafold3
PMID: 40332289
PMID: 39125995
AlphaFold2 evoformer attention mechanism neural network architecture
AlphaFold2 neural network architecture pipeline diagram showing: 1) Input stage with amino acid sequence and MSA (Multiple Sequence Alignment) database search producing sequence + pairwise features, 2) Evoformer block with row-wise attention, column-wise attention, triangle multiplicative updates, and pair representation updates with bidirectional arrows between MSA representation and Pair representation, 3) Structure Module with Invariant Point Attention (IPA), backbone frame updates, and side chain prediction, 4) Output showing 3D protein structure with pLDDT confidence coloring. Use clear boxes, arrows, and labels. Scientific diagram style with blue and green color scheme.
protein folding problem amino acid sequence three dimensional structure secondary tertiary structure
AlphaFold3 diffusion model architecture improvements over AlphaFold2 2024
Timeline infographic of AlphaFold development history: 2018 AlphaFold1 at CASP13 winning with residue-residue distance predictions; 2020 AlphaFold2 at CASP14 achieving GDT score 92.4 solving the protein folding problem; 2021 AlphaFold2 paper published in Nature and AlphaFold Database launched with 200 million structures; 2021 AlphaFold-Multimer for protein complexes; 2024 AlphaFold3 adding diffusion model for DNA RNA ligand prediction. Each milestone shown as a node on a timeline arrow with key achievements. Blue scientific style.
Teach me alphafold in details: basic to advance using standard sources and explain with figure also
AlphaFold2 architecture Evoformer structure module MSA pairwise features explained
AlphaFold3 diffusion model improvements over AlphaFold2 biomolecular interactions 2024
AlphaFold protein structure prediction review
AlphaFold2 neural network architecture Evoformer MSA pair representation
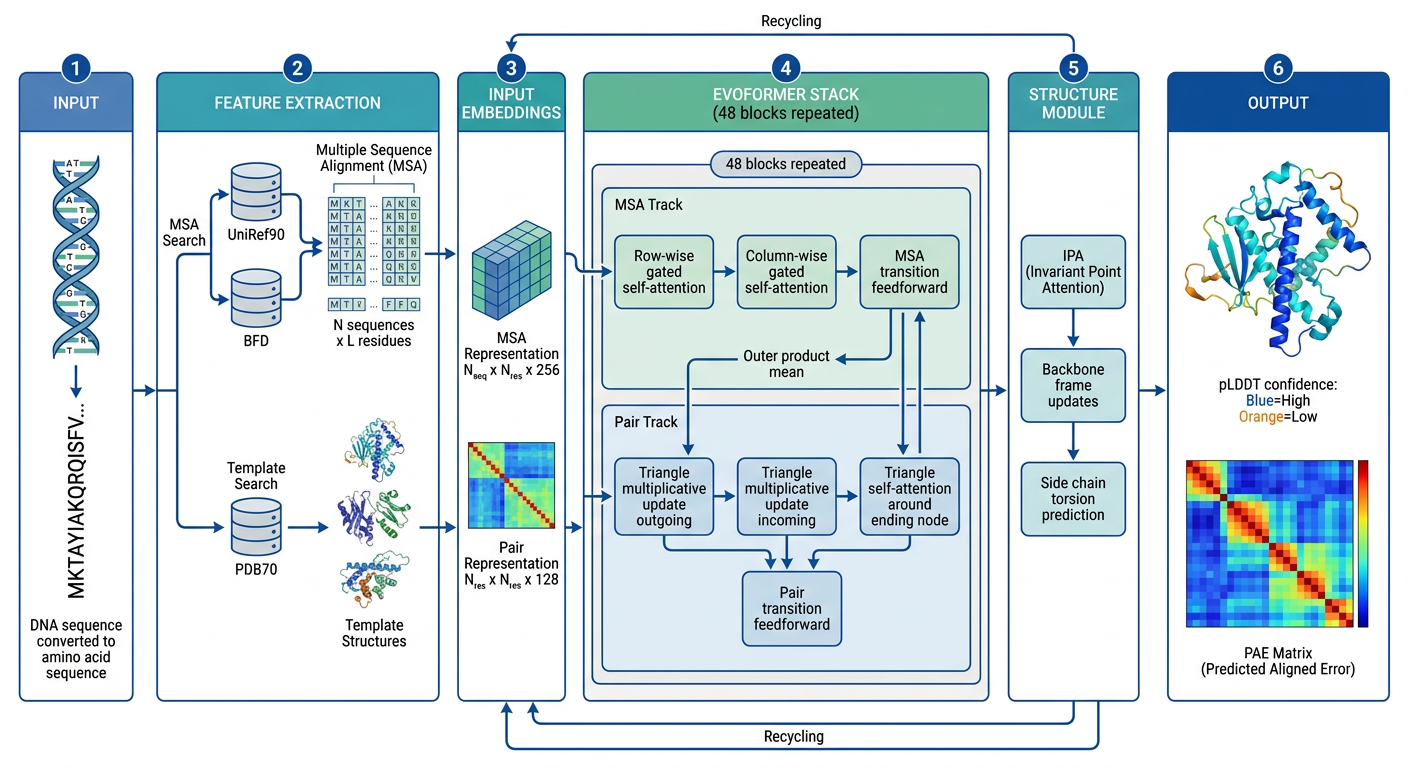
AlphaFold2 complete pipeline architecture diagram. Left to right flow: Box 1 INPUT showing DNA sequence converted to amino acid sequence (MKTAYIAKQRQISFV...). Arrows to Box 2 FEATURE EXTRACTION showing two branches: top branch MSA Search querying UniRef90 and BFD databases producing Multiple Sequence Alignment grid with N sequences x L residues, bottom branch Template Search querying PDB70 producing template structures. Both feed into Box 3 INPUT EMBEDDINGS showing MSA Representation (Nseq x Nres x 256) and Pair Representation (Nres x Nres x 128). Center section Box 4 EVOFORMER STACK (48 blocks repeated) containing: Row-wise gated self-attention, Column-wise gated self-attention, MSA transition feedforward, Outer product mean (MSA to Pair), Triangle multiplicative update outgoing, Triangle multiplicative update incoming, Triangle self-attention around starting node, Triangle self-attention around ending node, Pair transition feedforward - with bidirectional arrows between MSA and Pair tracks. Box 5 STRUCTURE MODULE showing IPA (Invariant Point Attention), backbone frame updates, side chain torsion prediction, recycling arrows looping back. Box 6 OUTPUT showing 3D protein ribbon structure colored by pLDDT confidence (blue=high confidence, orange=low confidence) and PAE matrix heatmap. Clean white background, blue/teal/green color scheme, professional scientific diagram style.
Scientific timeline infographic of AlphaFold history milestones on horizontal arrow. Node 1 at 1972: Anfinsen Dogma - sequence determines structure, Nobel Prize. Node 2 at 1994: CASP competition begins - biennial protein structure prediction challenge. Node 3 at 2018: AlphaFold1 - DeepMind enters CASP13, wins with GDT score 58.9 using residue-residue distance maps and deep ResNets. Node 4 at 2020: AlphaFold2 - CASP14 breakthrough, GDT score 92.4, protein folding problem solved, attention mechanism and Evoformer. Node 5 at 2021: AlphaFold2 paper in Nature (Jumper et al.), AlphaFold Database launched with 200 million+ structures, AlphaFold-Multimer for complexes. Node 6 at 2022: Nobel Prize in Chemistry awarded to David Baker, Demis Hassabis, John Jumper. Node 7 at 2024: AlphaFold3 - diffusion model, predicts proteins + DNA + RNA + small molecules + ions. Clean professional infographic style, blue and gold color scheme, white background.
AlphaFold confidence metrics explanation diagram. Top section showing pLDDT score color scale: Dark blue (90-100 very high confidence), Light blue (70-90 confident), Yellow (50-70 low confidence), Orange (below 50 very low confidence). Show a ribbon protein structure colored by this scheme. Middle section showing PAE (Predicted Aligned Error) matrix: NxN heatmap where dark green = low error (high confidence in relative position), white/yellow = high error. Example showing two domains with low PAE within domains but high PAE between them indicating flexible linker. Bottom section showing CASP metrics: GDT_TS score bar chart comparing AlphaFold1 (score 58), other methods (scores 50-70), AlphaFold2 (score 92.4, highlighted in gold). Labels explaining GDT = Global Distance Test, TM-score, lDDT. Clean educational diagram, white background, professional style.
Protein folding basics educational diagram. Panel A: Four levels of protein structure - Primary structure showing linear amino acid chain with labeled residues (Gly, Ala, Val, Leu, etc.). Secondary structure showing alpha-helix (coiled ribbon) and beta-sheet (flat arrows) with hydrogen bond dotted lines. Tertiary structure showing single protein chain folded into 3D globular structure with color gradient blue to red N to C terminus. Quaternary structure showing multiple subunits (hemoglobin tetramer example). Panel B: The protein folding problem - arrow from DNA sequence to mRNA to amino acid sequence to question mark to 3D structure, with text "10^300 possible conformations, Levinthal's paradox". Panel C: Experimental methods vs AlphaFold - X-ray crystallography (years, expensive), NMR spectroscopy (size limited), Cryo-EM (complex), vs AlphaFold (minutes, free). Clean educational illustration, pastel colors, white background.
Evoformer block detailed mechanism diagram. Central box labeled EVOFORMER BLOCK showing two parallel tracks side by side connected with arrows. LEFT TRACK labeled MSA Representation (Nseq x Nres matrix grid visualization): showing Row-wise Gated Self-Attention (attention across residues within each sequence, with attention weight visualization), Column-wise Gated Self-Attention (attention across sequences at each residue position), MSA Transition layer. RIGHT TRACK labeled Pair Representation (Nres x Nres matrix grid): showing Triangle Multiplicative Update diagram with three nodes A-B-C forming triangle, updating edge AB using edges AC and CB with formula m_AB = sigmoid(gate) x linear(m_AC concat m_CB), Triangle Self-Attention diagram, Pair Transition layer. Center connecting arrows: Outer Product Mean (blue arrow left to right showing how MSA row information flows into pair representation), Attention bias (green arrow right to left showing how pair representation biases MSA attention). Bottom showing N_blocks = 48 repetitions notation. Dark blue and teal color scheme, white background, professional neural network diagram style.
AlphaFold: A Complete Guide — Basic to Advanced
PART 1 — FOUNDATIONS: The Problem AlphaFold Solves
1.1 What is a Protein?
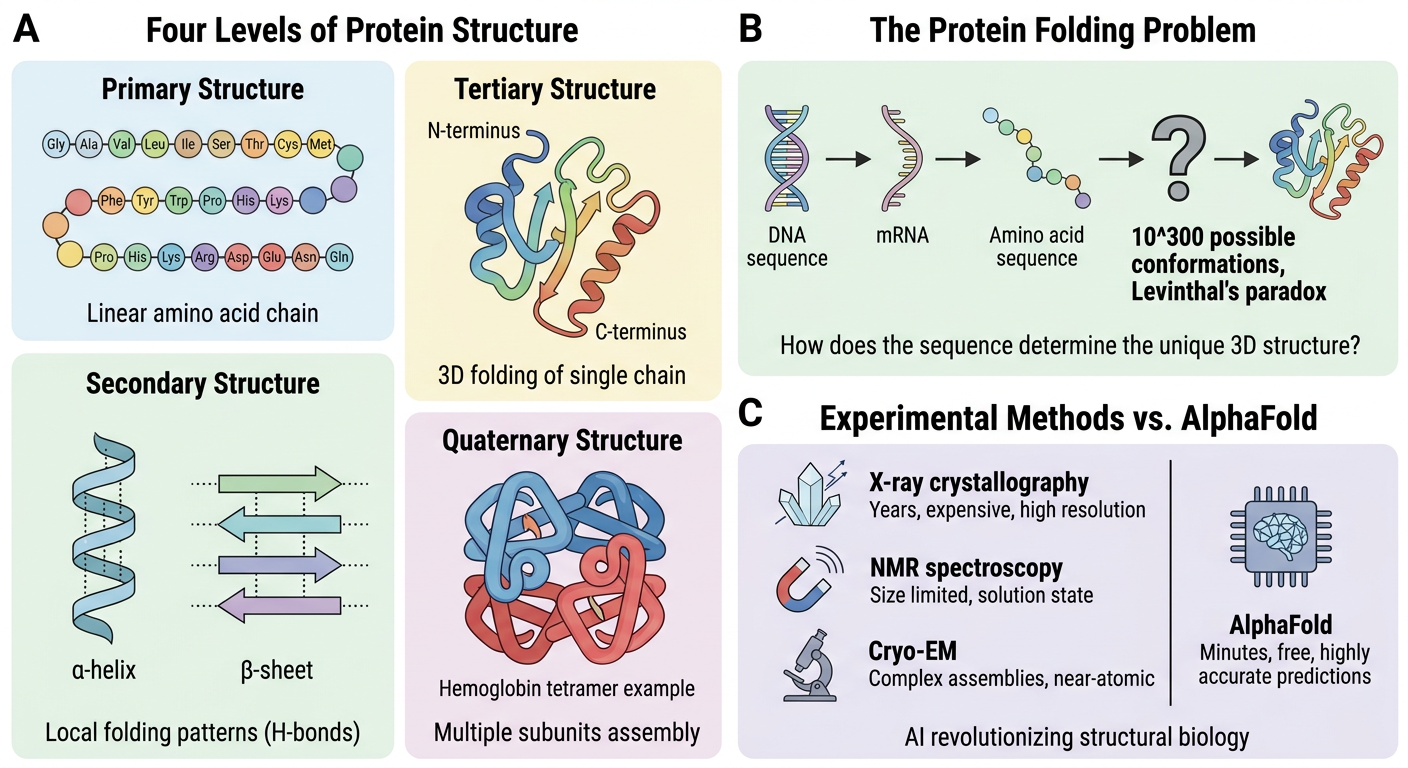
| Level | Description | Example |
|---|---|---|
| Primary | Linear sequence of amino acids | MKTAYIAKQR... |
| Secondary | Local folding into α-helices and β-sheets | Helix in hemoglobin |
| Tertiary | Full 3D fold of a single chain | Lysozyme globular domain |
| Quaternary | Assembly of multiple chains | Hemoglobin tetramer |
1.2 The Protein Folding Problem
"The three-dimensional structure of a protein is determined by its amino acid sequence." — Christian Anfinsen, Nobel Prize 1972
- Drug design requires knowing the precise binding pocket shape
- Understanding disease mutations requires knowing structural context
- Engineering new proteins for biotechnology requires structure prediction
1.3 Traditional Experimental Methods (Before AlphaFold)
| Method | Principle | Limitations |
|---|---|---|
| X-ray Crystallography | Diffraction of X-rays through crystal | Requires crystal formation; months to years of work |
| NMR Spectroscopy | Magnetic resonance of atoms in solution | Limited to small proteins (<50 kDa) |
| Cryo-EM | Electron microscopy of flash-frozen samples | Expensive equipment; resolution challenges |
PART 2 — HISTORICAL CONTEXT & CASP
2.1 The CASP Competition
- Measures what fraction of Cα atoms are within 1, 2, 4, and 8 Å of true position
- Score of 100 = perfect prediction; Score >90 = essentially experimental accuracy
2.2 The AlphaFold Timeline
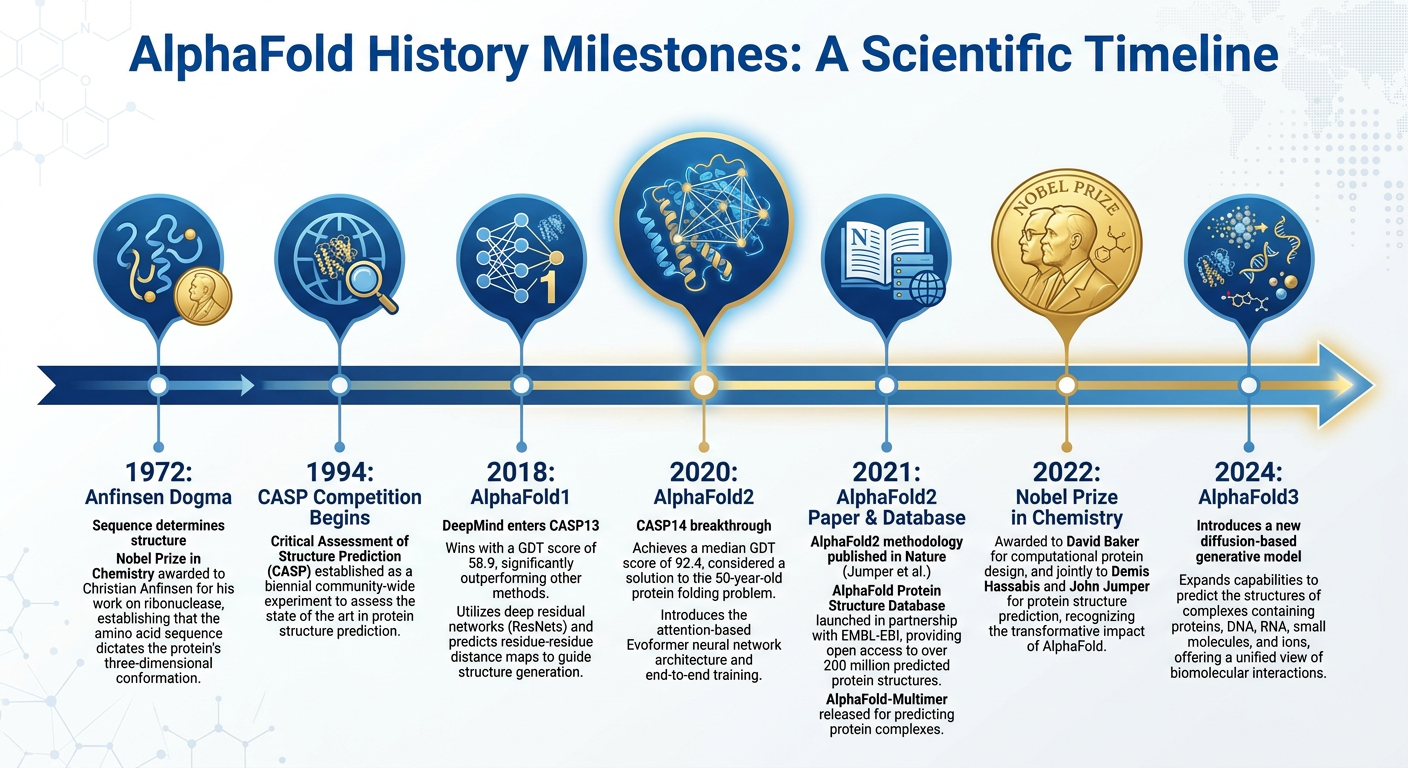
| Year | Milestone |
|---|---|
| 2018 | AlphaFold1 wins CASP13 with GDT ~58.9, using deep ResNets to predict distance maps |
| 2020 | AlphaFold2 dominates CASP14 with median GDT 92.4 — proteins solved to "experimental accuracy" |
| Jul 2021 | AlphaFold2 paper published in Nature (Jumper et al., Nature 596:583-589) |
| Jul 2021 | AlphaFold Database launched — 350,000 structures initially, then 200 million+ by 2022 |
| Nov 2021 | AlphaFold-Multimer released for protein complexes |
| Oct 2024 | Nobel Prize in Chemistry awarded to Demis Hassabis and John Jumper (AlphaFold), and David Baker (protein design) |
| May 2024 | AlphaFold3 released — extends to DNA, RNA, ligands, ions |
PART 3 — ALPHAFOLD1 (2018)
- If you know which pairs of residues are close in space, you can reconstruct the 3D structure
- Co-evolutionary analysis: if two residues evolve together across species (when one mutates, the other compensates), they must be in contact in the structure
- Used deep ResNets + dilated convolutions to predict a distance map (N×N matrix of predicted distances between all pairs of residues)
- Then used gradient descent to fold a structure consistent with the predicted distances
PART 4 — ALPHAFOLD2: THE BREAKTHROUGH (2021)
4.1 The Complete Pipeline
4.2 Stage 1: Input Feature Generation
- UniRef90 (~90% sequence identity clusters of UniProt)
- BFD (Big Fantastic Database) — 65 billion residues
- MGnify — metagenomics sequences
Query:   MKTAYIAKQRQISFV...
Seq 2:   MKTAYI-KQRQIAFV...   (A→A mutation at position 14)
Seq 3:   MKTGYIAKQRQISFV...   (A→G at position 4)
         ...thousands more sequences...
- Residue pair features: relative distances, bond angles, orientation between residues
- Generated from both MSA statistical co-variation AND optional template structures from the PDB
- If known homologous structures exist in the PDB, their backbone coordinates are used as templates
- AlphaFold2 tends to ignore templates when MSA depth is sufficient
4.3 Stage 2: The Evoformer — The Heart of AlphaFold2
- MSA Representation (Nseq × Nres × 256): tracks evolutionary relationships across all sequences
- Pair Representation (Nres × Nres × 128): tracks geometric/spatial relationships between all residue pairs
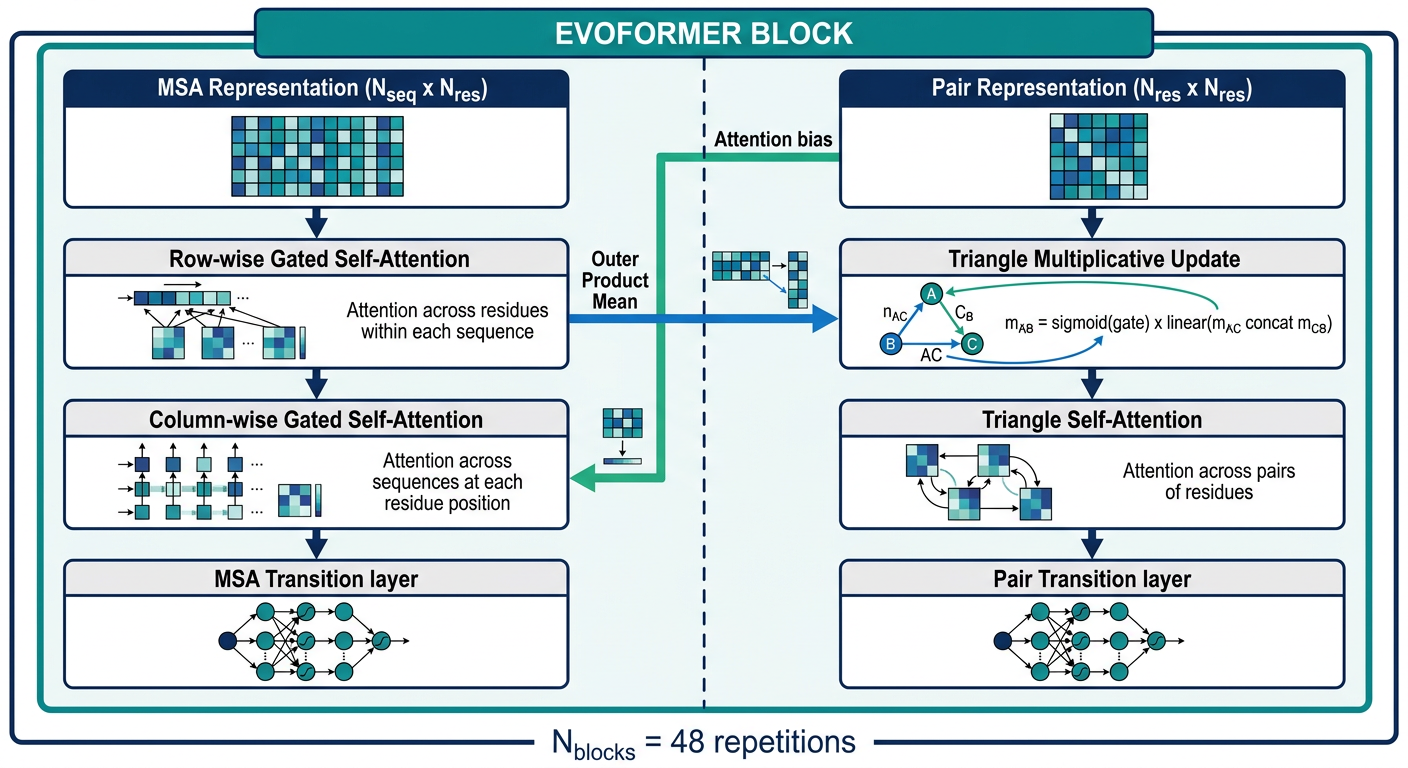
MSA Track Updates:
- Row-wise Gated Self-Attention — Each sequence in the MSA attends to all positions along that sequence. The pair representation is projected as a bias added to the attention logits → pair geometry influences MSA attention
- Column-wise Gated Self-Attention — At each residue position, attention runs across all sequences in the MSA → correlates how different homologous sequences handle each position
- MSA Transition — Standard feedforward MLP for non-linear mixing
Pair Track Updates:
- Outer Product Mean — Takes the outer product of each pair of MSA column embeddings, averaged over sequences → this is how evolutionary co-variation in the MSA updates the pair representation (MSA → Pair information flow)
- Triangle Multiplicative Update (outgoing) — For each edge (i,j) in the pair representation, update it using the path i→k→j for all intermediate k. Represents the "triangle inequality" of 3D geometry: if i-k and k-j distances are known, i-j distance is constrained. Formula:
m_ij = sigmoid(gate_ij) × Linear(m_ik ⊕ m_kj) - Triangle Multiplicative Update (incoming) — Same concept but using paths k→i→j
- Triangle Self-Attention (around starting node) — Attention where edge (i,j) attends to all (i,k) edges
- Triangle Self-Attention (around ending node) — Edge (i,j) attends to all (k,j) edges
- Pair Transition — Feedforward MLP
4.4 Stage 3: Structure Module
- A backbone frame (3D rotation + translation), defined by the N, Cα, C backbone atoms
- Side chain torsion angles (χ₁, χ₂, χ₃, χ₄) for side chain placement
- The single representation (first row of the MSA, projected) encoding sequence identity
- The pair representation (biases the attention)
- 3D points generated relative to each residue's current backbone frame
4.5 Training Objectives
| Loss | Purpose |
|---|---|
| FAPE (Frame Aligned Point Error) | Main structural loss: penalizes incorrect placement of backbone frames and Cα atoms in the local reference frame of each residue. Prevents overfitting to global rotations |
| Distogram loss | Predicts binned distance distributions between Cβ atoms |
| Masked MSA loss | Like BERT's masked language modeling — randomly mask MSA positions and predict them, ensuring the model learns good sequence representations |
| Side chain FAPE | Penalizes incorrect side chain placement |
| Violation loss | Penalizes stereochemical violations (bond lengths, angles) |
| pLDDT loss | Model also predicts its own per-residue confidence → trained against actual lDDT scores |
PART 5 — CONFIDENCE METRICS
5.1 pLDDT — Per-Residue Local Confidence
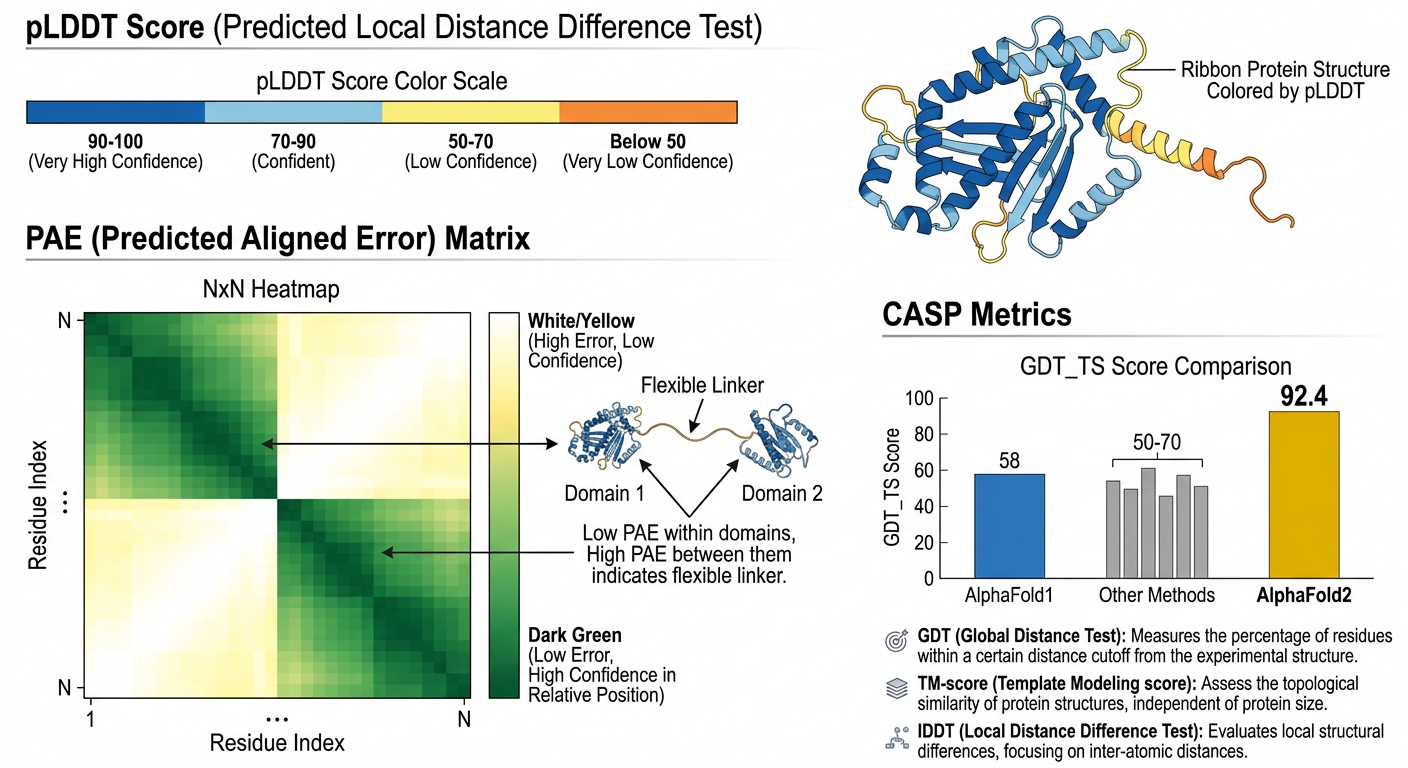
| pLDDT Score | Color | Interpretation |
|---|---|---|
| 90–100 | Dark blue | Very high confidence — model backbone is reliable |
| 70–90 | Light blue | Confident — backbone generally correct |
| 50–70 | Yellow | Low confidence — use with caution |
| < 50 | Orange/Red | Very low confidence — likely intrinsically disordered region |
5.2 PAE — Predicted Aligned Error
- Low PAE (dark green on the matrix) = model is confident in the relative position of these two residues
- High PAE (light/white) = model is uncertain about the relative positioning
- PAE blocks along the diagonal = confident domains
- High off-diagonal PAE between blocks = flexible linker connecting two independently-folded domains
- Confirms if a multi-domain prediction reflects a real rigid complex or merely two independently folding chains placed arbitrarily near each other
5.3 TM-score and GDT
- TM-score (Template Modeling score): ranges 0–1; >0.5 = same fold; >0.9 = essentially identical
- GDT_TS: fraction of Cα within 1/2/4/8 Å thresholds, averaged; AlphaFold2 achieved 92.4 at CASP14
- lDDT (Local Distance Difference Test): compares local inter-residue distances; used to assess model quality at the residue level
PART 6 — ALPHAFOLD-MULTIMER (2021)
- MSA processing modified: paired MSAs are constructed — sequences from the same organism are paired across the two chains being modeled
- New "entity" token type to distinguish chains
- Modified training sampling to focus on inter-chain contact learning
- Asymmetric unit (multiple chains) handled as a single prediction
- Uses ipTM (interface TM-score) as the key confidence metric for the predicted complex interface quality
PART 7 — ALPHAFOLD3 (2024)
7.1 What's New in AF3?
- Single proteins and multi-chain complexes
- Protein–DNA interactions (transcription factor binding, etc.)
- Protein–RNA interactions
- Protein–small molecule (ligand) docking — dramatically outperforming dedicated docking tools
- Protein–ion complexes
- Modified residues (phosphorylation, glycosylation, etc.)
7.2 Architecture Changes
| Feature | AlphaFold2 | AlphaFold3 |
|---|---|---|
| Structure Generation | Equivariant frames + torsion angles | Diffusion model on raw atom coordinates |
| Evoformer | Standard Evoformer | Updated "Pairformer" (improved version) |
| Molecular scope | Proteins only | All biomolecules |
| Atom representation | Backbone frames + χ angles | Direct per-atom 3D coordinates |
| Confidence | pLDDT, PAE | pLDDT, PAE, pTM, ipTM |
- Starts with a cloud of randomly noised atom positions
- Iteratively denoises the cloud, converging on the most likely structure
- Operates directly on raw XYZ coordinates of all atoms — no rotational frames required
- Multiple samples can be drawn from the same input (stochastic sampling), allowing AF3 to explore conformational diversity
7.3 AF3 Performance Benchmarks (Abramson et al., Nature 2024)
- Protein–ligand docking: PoseBusters benchmark — AF3 achieves 76% success vs ~50% for best docking tools (Glide, Gold)
- Protein–nucleic acid: substantially better than RoseTTAFold2NA and other specialist tools
- Antibody–antigen modeling: best-performing single model on H3 loop prediction
- Standard protein structure: broadly comparable to AF2, with some improvements on multimers
PART 8 — THE ALPHAFOLD DATABASE
- >200 million predicted protein structures (covering essentially every known UniProt sequence)
- Structures for all 20,226 human proteins
- Proteomes of >48 major organisms
- Downloadable in PDB and mmCIF format
- Go to alphafold.ebi.ac.uk
- Search by protein name, UniProt ID, or gene name
- View 3D structure in browser (Mol* viewer) colored by pLDDT
- Download structure + PAE matrix
- Interpret confidence carefully before drawing biological conclusions
PART 9 — RUNNING ALPHAFOLD YOURSELF
9.1 ColabFold — The Practical Route
- Uses MMseqs2 for fast MSA generation (vs slow database searches in original AF2)
- ~40-60× faster than original AF2
- Supports monomers, multimers, and custom MSAs
- Free to use via Google Colab
1. Open ColabFold notebook in Google Colab
2. Paste your amino acid sequence(s)
3. Configure: num_recycles (3 default), num_models (1-5)
4. Run all cells (~10-30 min for typical protein)
5. Download: .pdb structures, PAE plots, pLDDT plots
9.2 Input Tips
- Sequence length: AF2 handles up to ~2500 residues well; longer sequences require more GPU memory
- MSA depth matters: Proteins with few homologs (orphan proteins, viral proteins unique to one clade) tend to have lower confidence
- Multimer modeling: Provide comma-separated chains; ColabFold handles chain pairing automatically
- Templates: Can be disabled to test truly ab initio prediction
9.3 Interpreting Your Output
Step 1: Check global pLDDT — overall model quality
Step 2: Identify high-confidence regions (pLDDT >70) — trust these
Step 3: Identify low-confidence regions (<50) — may be IDRs
Step 4: Check PAE matrix — confirms domain architecture and
        whether inter-domain arrangements are meaningful
Step 5: If modeling a complex, check ipTM score (>0.75 = confident interface)
Step 6: Compare to evolutionary data — are predicted contacts consistent
        with your functional knowledge?
PART 10 — LIMITATIONS & CRITICAL CAVEATS
| Limitation | Explanation |
|---|---|
| Static structure only | AF2/AF3 predicts a single lowest-energy conformation — no dynamics, no conformational changes, no open/closed states |
| Intrinsically Disordered Proteins (IDPs) | IDPs have no fixed structure by definition; AlphaFold correctly gives them low pLDDT, but the coordinates are meaningless |
| Protein–ligand-induced conformational change | Predicts apo (unbound) structures; drug binding may require conformational rearrangements not captured |
| Novel folds | Rare folds with few homologs (low MSA depth) show reduced accuracy |
| Hallucinations (AF3) | Diffusion model can generate plausible-looking but incorrect structure in uncertain regions |
| Post-translational modifications | Glycosylation, phosphorylation effects on fold are partially handled in AF3 but limited in AF2 |
| Membrane protein orientation | Predicts fold but not lipid bilayer placement or oligomeric state in membrane context |
| Does not replace experiments | For drug design, crystallography/cryo-EM validation of key binding regions is still essential |
PART 11 — APPLICATIONS IN RESEARCH & MEDICINE
Drug Discovery
- Target identification: AF3 predicts binding pockets for previously "undruggable" proteins
- Virtual screening: Docking small molecules into AF-predicted structures (though caution needed for induced-fit scenarios)
- Cryptic site discovery: Low-pLDDT regions sometimes reveal hidden binding pockets in MD simulations seeded from AF structures
Vaccine Design
- Predict surface-exposed epitopes on pathogen proteins (viral spike proteins, bacterial surface antigens)
- Design antigens that present conserved epitopes in native-like conformations
Protein Engineering & Synthetic Biology
- Design new enzymes by combining AlphaFold structures with RFdiffusion (David Baker lab) for de novo protein design
- Predict the effect of mutations on protein stability
Basic Science
- Completed the structural coverage of the human proteome
- Enabled AlphaFill — transplants ligands/cofactors into AF models
- Structural annotation of metagenomics sequences (millions of uncultured organism proteins)
- Understanding disease mutations: map variant to structure to understand mechanism
PART 12 — COMPETING METHODS
| Tool | Developer | Key Feature |
|---|---|---|
| RoseTTAFold | Baker Lab (UW) | Also transformer-based; earlier open competitor; RFdiffusion for design |
| ESMFold | Meta AI | Uses protein language model (ESM-2) without MSA — faster but less accurate |
| OmegaFold | HeliXon | Single-sequence prediction (no MSA needed) |
| OpenFold | OpenFold Consortium | Open-source reproducible reimplementation of AF2 |
| ColabFold | Steinegger Lab | Faster MSA generation + AF2 backend |
Summary: The AlphaFold Conceptual Stack
BIOLOGY LAYER
└── Protein sequence (primary structure) encodes 3D shape
    └── Co-evolution in related species reveals structural contacts

MACHINE LEARNING LAYER
└── MSA → Evoformer (transformer with triangle geometry updates)
    └── Pair representation encodes geometric hypothesis
        └── Structure module / Diffusion → explicit 3D coordinates
            └── Recycling → iterative refinement

OUTPUT LAYER
└── 3D atomic coordinates (.pdb / .cif)
    └── Per-residue pLDDT (confidence)
        └── PAE matrix (inter-residue confidence)
Key References
- Jumper J, et al. (2021). "Highly accurate protein structure prediction with AlphaFold." Nature 596:583–589
- Abramson J, et al. (2024). "Accurate structure prediction of biomolecular interactions with AlphaFold 3." Nature 630:493–500
- Mirdita M, et al. (2022). "ColabFold: making protein folding accessible to all." Nature Methods
- Chen L, et al. (2024). "AI-Driven Deep Learning Techniques in Protein Structure Prediction." Int J Mol Sci 25:8426 [PMID: 39125995]
- Krokidis MG, et al. (2025). "AlphaFold3: An Overview of Applications and Performance Insights." Int J Mol Sci 26:3671 [PMID: 40332289]
- EMBL-EBI AlphaFold Training Course — free, comprehensive, developed with Google DeepMind
- AlphaFold Database — 200M+ structures, free accessThis guide covers AlphaFold from the ground up across 12 structured parts. Here's a quick navigation map:
| Section | What You Learn |
|---|---|
| Parts 1–2 | Why protein folding matters, the Levinthal paradox, CASP competition history |
| Part 3 | AlphaFold1 — distance map prediction with ResNets |
| Parts 4–4.5 | AlphaFold2 in detail: MSA features, Evoformer (48 blocks), triangle updates, IPA, recycling, training losses |
| Part 5 | How to interpret pLDDT, PAE, GDT — critical for not misusing predictions |
| Part 6 | AlphaFold-Multimer for protein complexes |
| Part 7 | AlphaFold3 — diffusion model, expanded scope to DNA/RNA/ligands |
| Parts 8–9 | Using the AlphaFold Database and running ColabFold practically |
| Parts 10–12 | Limitations, applications in drug discovery/vaccines, competing tools |