
Layers of fovea and foveola
fovea foveola layers retina cross section diagram
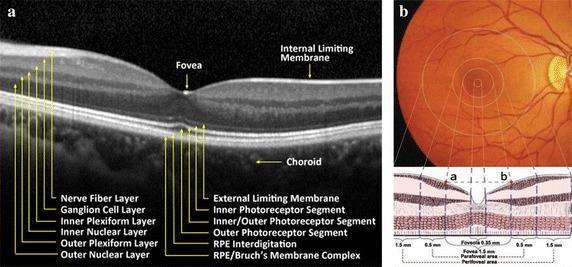
This educational image displays the normal anatomy of the human retina and macula through diagnostic imaging and anatomical diagrams. Panel (a) is a high-resolution optical coherence tomography (OCT) cross-section of a normal retina, with detailed labels identifying 12 distinct layers: Nerve Fiber Layer (NFL), Ganglion Cell Layer (GCL), Inner Plexiform Layer (IPL), Inner Nuclear Layer (INL), Outer Plexiform Layer (OPL), Outer Nuclear Layer (ONL), External Limiting Membrane (ELM), various segments of the Photoreceptors, RPE Interdigitation, RPE/Bruch's Membrane Complex, and the underlying Choroid. A characteristic central foveal depression is clearly visible. Panel (b) provides a composite of a clinical fundus photograph and a matching cross-sectional anatomical diagram illustrating macular regional division. The macula is subdivided into concentric zones with specific diameters: the foveola (0.35 mm), fovea (1.5 mm), parafovea (an additional 0.5 mm ring), and perifovea (an additional 1.5 mm ring). The content is designed for medical education in ophthalmology, specifically for understanding normal fundus morphology and interpreting OCT scans for diagnostic purposes.
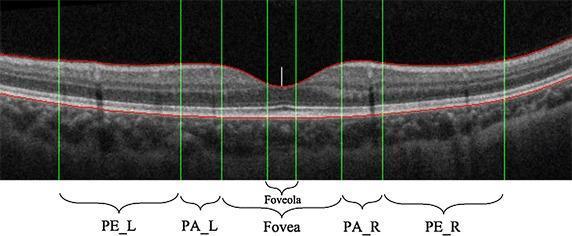
This diagnostic image is an Optical Coherence Tomography (OCT) cross-section of a human retina, specifically illustrating the anatomical subdivisions of the macula. The image features a normal retinal profile with a characteristic central thinning at the foveal depression. Two red horizontal lines delineate the upper boundary, the Inner Limiting Membrane (ILM), and the lower boundary, the Retinal Pigment Epithelium (RPE). Green vertical lines subdivide the macular region into clinical zones: the central foveola (marked with a white indicator at its center), the fovea, the flanking parafovea (PA_L and PA_R), and the outer perifovea (PE_L and PE_R). The visualization demonstrates the relative thickness variations across these regions, where the inner retinal layers are displaced laterally at the fovea to allow light to reach the photoreceptors directly. This schematic is primarily used in ophthalmology to establish a reference model for identifying morphological abnormalities, such as drusen, epiretinal membranes, or macular edema, by quantifying layer thickness and curvature within specific macular zones.
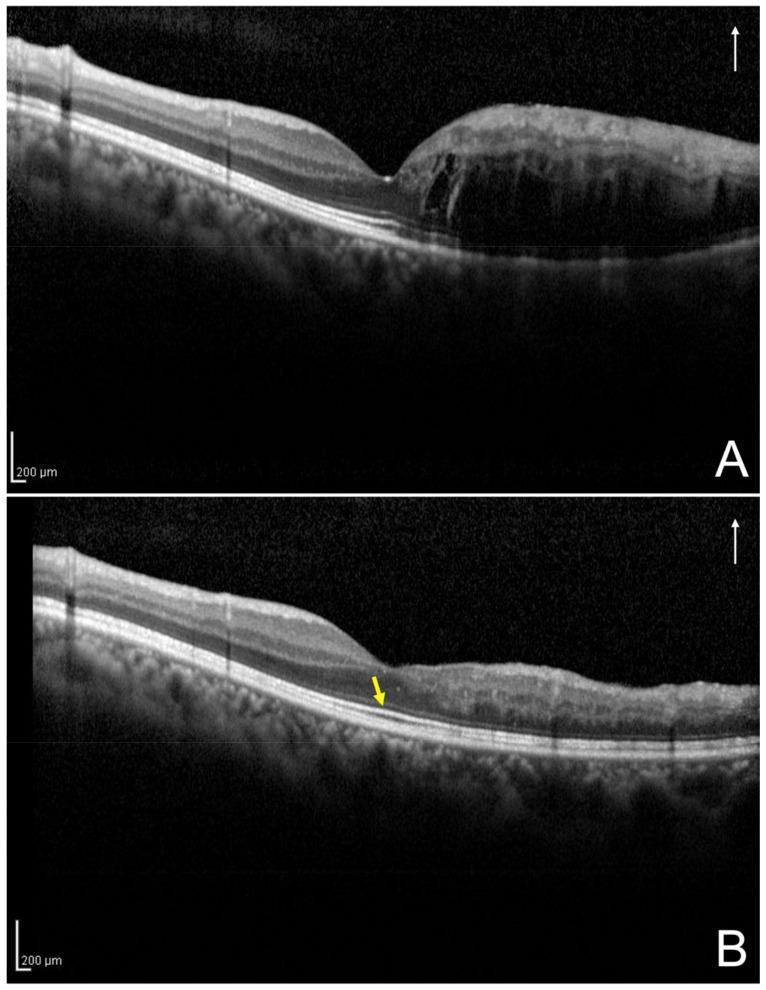
This diagnostic comparison presents two vertical optical coherence tomography (OCT) B-scans of a human retina, demonstrating the progression and resolution of macular edema secondary to branch retinal vein occlusion (BRVO). Panel A (Initial Visit) shows a cross-section of the fovea with significant intraretinal fluid (IRF) manifesting as large, hyporeflective cystic spaces. This accumulation results in marked retinal thickening and the loss of normal foveal contour, classified as 'one-side IRF' as the fluid is predominantly localized to one side of the foveola. Panel B (12-Month Follow-up) illustrates the post-treatment state, showing complete resolution of the intraretinal fluid and restoration of a more anatomical retinal thickness and profile. A yellow arrow highlights the intact and continuous ellipsoid zone (EZ) band, signifying the preservation of photoreceptor integrity. White arrows in the upper right corners indicate the vertical scan orientation. These images serve as an educational example of treatment efficacy and the importance of monitoring outer retinal layers, such as the EZ band, for visual prognosis in vascular retinal diseases.
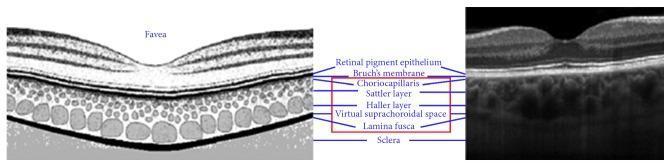
A comparison graphic of human ocular anatomy featuring an anatomical diagram alongside a high-resolution Spectral Domain Optical Coherence Tomography (SD-OCT) cross-section of the fovea and posterior segment. The image serves as an educational tool for ophthalmology, specifically identifying the microstructural layers of the retina and choroid. Starting from the inner retina and moving outward toward the sclera, the labeled structures include the foveal pit, retinal pigment epithelium (RPE), Bruch's membrane, and the subsequent choroidal layers: choriocapillaris, Sattler layer (small-to-medium vessels), Haller layer (large vessels), virtual suprachoroidal space, and Lamina fusca. The OCT image illustrates these as hyperreflective and hyporeflective bands, with the RPE appearing as a prominent bright band. This visual highlights the clinical methodology for measuring choroidal thickness, defined as the distance between the RPE-choroid interface and the sclerochoroidal interface. The image is designed for advanced medical education in diagnostic imaging and retinal pathology.
Layers of the Fovea and Foveola
Anatomy Overview
- Foveola - 0.35 mm (innermost pit)
- Fovea - 1.5 mm
- Parafovea - additional 0.5 mm ring
- Perifovea - additional 1.5 mm ring
The 10 Layers of the Retina (General)
| # | Layer |
|---|---|
| 1 | Retinal Pigment Epithelium (RPE) |
| 2 | Photoreceptor layer (rod and cone outer/inner segments) |
| 3 | Outer limiting membrane (External Limiting Membrane, ELM) |
| 4 | Outer nuclear layer (ONL) - nuclei of photoreceptors |
| 5 | Outer plexiform layer (OPL) - synapses between photoreceptors and interneurons |
| 6 | Inner nuclear layer (INL) - bipolar, horizontal, amacrine cell bodies |
| 7 | Inner plexiform layer (IPL) - synapses between interneurons and ganglion cells |
| 8 | Ganglion cell layer (GCL) |
| 9 | Nerve fiber layer (NFL) - axons of ganglion cells |
| 10 | Inner limiting membrane (ILM) - basal lamina of Muller cells |
Layers Present in the Fovea
| Layer | Status in Fovea |
|---|---|
| RPE | Present (thickened, enlarged cells) |
| Photoreceptor layer | Present - cones only, elongated and slender (rod-like in shape), ~85 µm long |
| Outer limiting membrane | Present |
| Outer nuclear layer (ONL) | Present - thickened (multiple rows of cone nuclei) |
| Outer plexiform layer (OPL) | Present - forms the oblique Henle fiber layer |
| Inner nuclear layer (INL) | Markedly reduced/displaced to the rim |
| Inner plexiform layer (IPL) | Markedly reduced/displaced |
| Ganglion cell layer (GCL) | Heaped up on the sides, displaced to parafovea; cone:ganglion cell ratio approaches 1:1 |
| Nerve fiber layer (NFL) | Absent in the central fovea |
| Inner limiting membrane (ILM) | Absent or very thin at the pit center |
- No rods are present in the fovea centralis
- No retinal blood vessels - the fovea is avascular (foveal avascular zone, FAZ); nutrients arrive by diffusion from the choriocapillaris
- The cone:ganglion cell ratio is close to 1:1, enabling maximal spatial resolution
Layers in the Foveola (Central Pit)
| Layer | Status in Foveola |
|---|---|
| RPE | Present |
| Photoreceptor layer | Present - exclusively cone outer/inner segments (~4,000 cones); cones here are the most elongated and slender in the entire retina |
| Outer limiting membrane | Present |
| Outer nuclear layer | Present - cone nuclei only |
| Outer plexiform layer (Henle fibers) | Present - Henle fibers run obliquely |
| Inner nuclear layer | Absent |
| Inner plexiform layer | Absent |
| Ganglion cell layer | Absent |
| Nerve fiber layer | Absent |
| Inner limiting membrane | Absent (or extremely attenuated) |
In the foveola, light travels unobstructed directly to the cone outer segments without passing through any inner retinal layers. This is the structural basis for the sharpest visual acuity in the eye.
Key Structural Features Specific to the Fovea/Foveola
-
Henle fiber layer: In the outer plexiform layer of the fovea, photoreceptor axons run obliquely (rather than radially) - these are called Henle fibers. This is why macular edema has a star-shaped (petaloid) pattern on imaging.
-
Xanthophyll (macular pigment): The macula lutea is yellow due to xanthophyll pigment (lutein and zeaxanthin), concentrated in the Henle fiber layer and inner nuclear layer. It absorbs short-wavelength (blue) light, acting as a natural filter against phototoxicity.
-
Cones in the foveola: ~150,000 cones/mm² at peak density; the most slender and elongated anywhere in the retina, functionally mimicking rods in morphology but remaining true cones.
-
Avascular zone: Both fovea and foveola lack retinal capillaries. The foveal avascular zone (FAZ) is ~0.5 mm in diameter and visible on fundus fluorescein angiography.
-
Adjacent RPE & choriocapillaris: Both are thickened at the fovea to support the metabolic demands of the dense cone population.
Summary Comparison Table
| Feature | Foveola | Fovea (slope/rim) | Peripheral Retina |
|---|---|---|---|
| Diameter | ~0.35 mm | ~1.5 mm | - |
| Rods | Absent | Absent | Present |
| Cones | Only (~4,000) | Predominantly | Mixed |
| Inner layers (INL, IPL, GCL, NFL) | Absent | Displaced to edges | Present |
| ILM | Absent/attenuated | Present | Present |
| Retinal vessels | Absent (FAZ) | Absent | Present |
| Cone:ganglion cell ratio | ~1:1 | ~1:1 | Many rods:1 |
| Visual acuity | Highest | High | Lower |