
Ecg
Asking for Preferences
What would you like to know about ECG?
An ECG records the heart's electrical activity from multiple angles using 12 leads. Reading one involves checking rate, rhythm, axis, P waves, PR interval, QRS complex, ST segment, and T waves - in that order.
Searching sources...
Reading File
Finding Sources
Searching the Web
how to read ECG basics 12 lead electrocardiogram interpretation steps
Finding Sources
Finding Sources
Reading File
Finding Sources
Finding Sources
Finding Sources
Reading File
Reading File
Reading File
Reading File
Loading Image
Loading Image
Reading File
Loading Image
Reading File
I now have excellent material from Goldman-Cecil Medicine and Costanzo Physiology. Let me compile the full answer.
ECG (Electrocardiogram) - Basic Principles & How to Read
What Is an ECG?
An ECG (or EKG) is a recording of tiny potential differences on the body surface that reflect the electrical activity of the heart. It captures the timing and sequence of depolarization and repolarization of the myocardium, allowing analysis of electrical activity from multiple angles simultaneously.
- Goldman-Cecil Medicine, Chapter 42
The Cardiac Conduction System
Before reading an ECG, it helps to understand what it's recording:
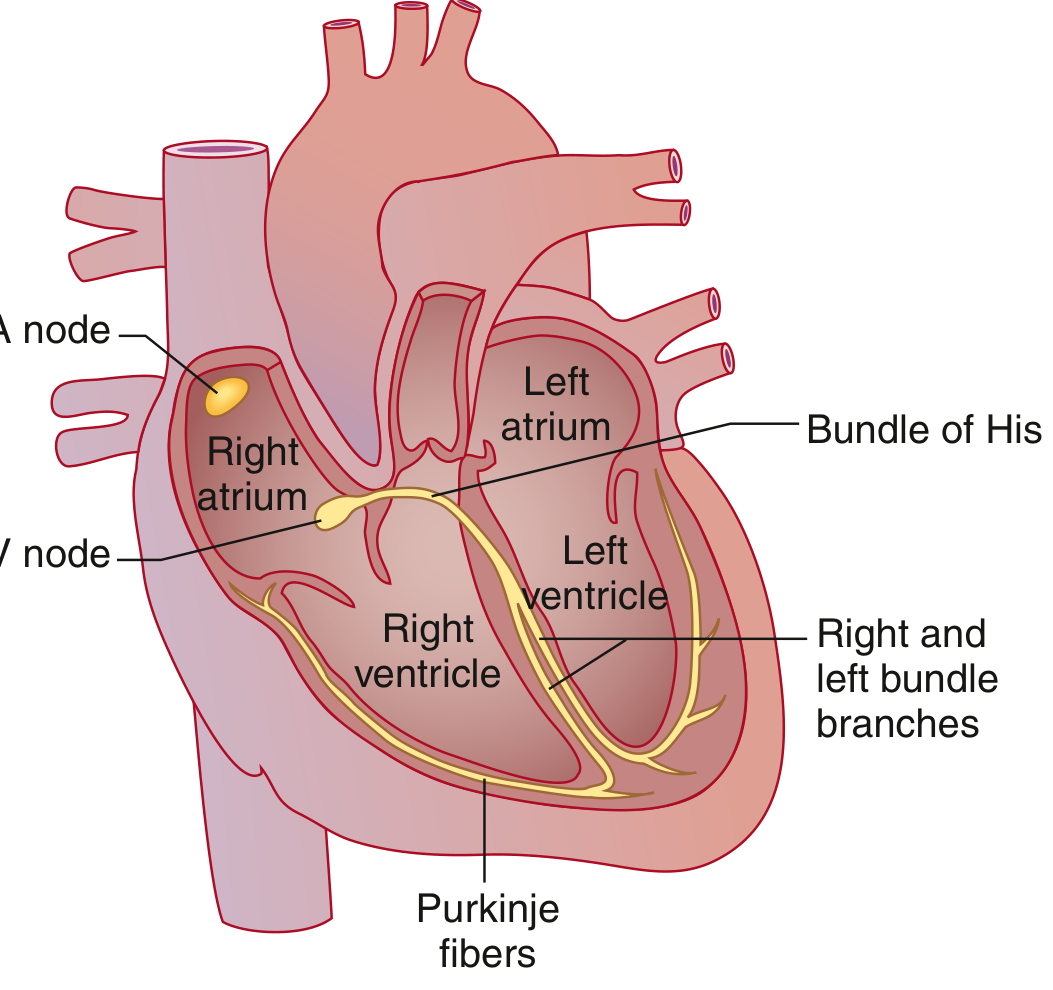
The SA node fires spontaneously, the impulse spreads through the atria, is delayed at the AV node, then travels through the Bundle of His -> right & left bundle branches -> Purkinje fibers -> ventricular muscle. Each of these steps creates a visible mark on the ECG.
The ECG Waves, Segments & Intervals
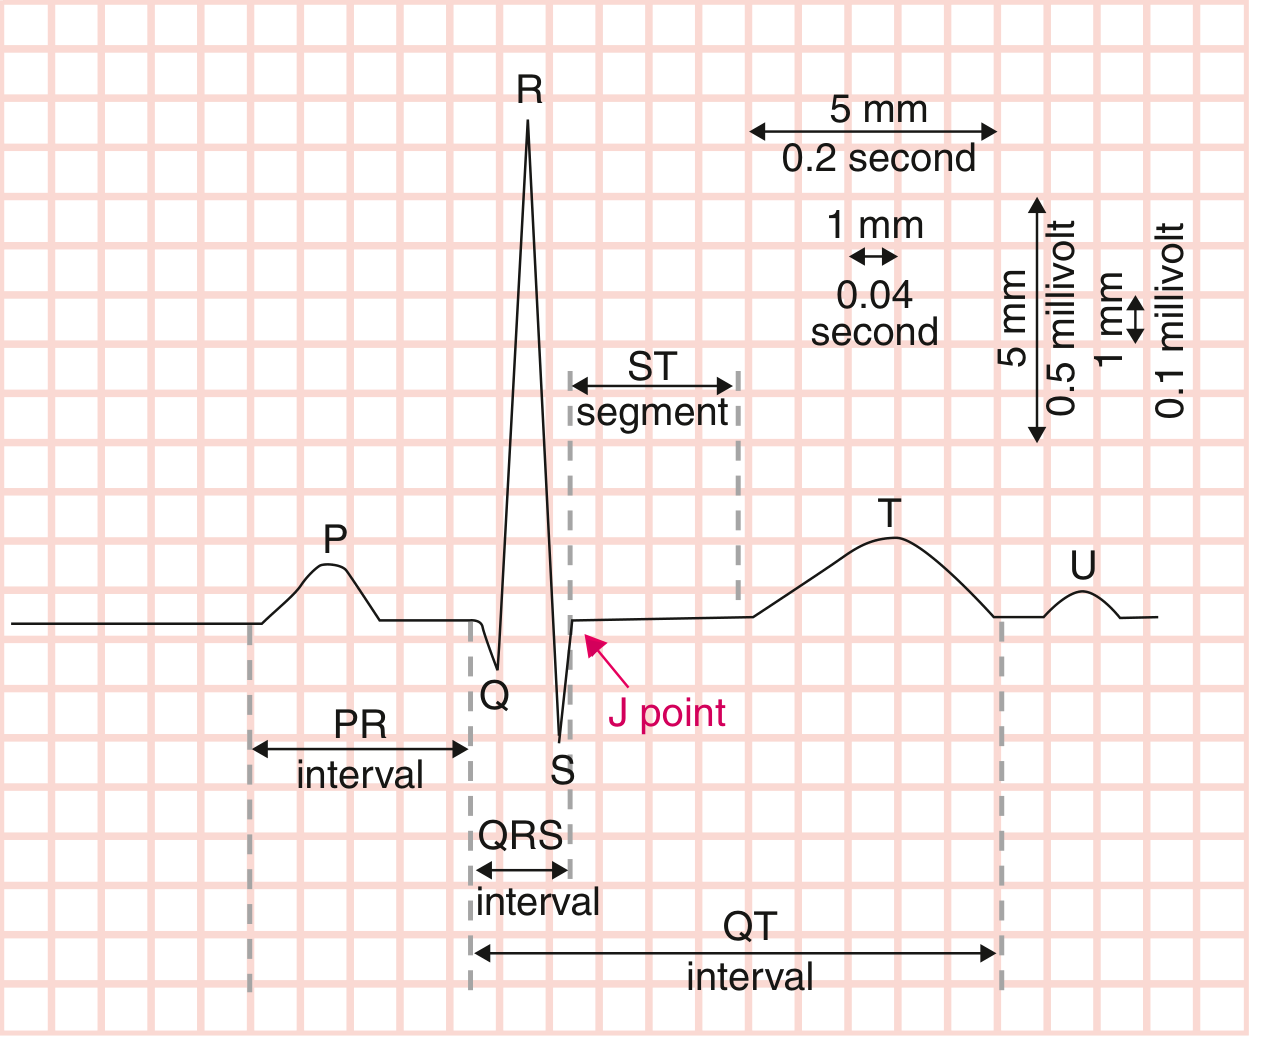
| Component | What it represents | Normal value |
|---|---|---|
| P wave | Atrial depolarization | < 120 ms (3 small boxes) |
| PR interval | Atrial depol. to onset of ventricular depol. (includes AV node delay) | 90-200 ms |
| QRS complex | Ventricular depolarization | 75-110 ms |
| ST segment | Plateau of ventricular action potential (isoelectric) | At baseline |
| T wave | Ventricular repolarization | Upright in most leads |
| QT interval | QRS onset to T wave offset (entire ventricular event) | QTc: males ≤450 ms; females ≤460 ms |
| J point | Junction of QRS end and ST segment start | At baseline |
Key rule: Atrial repolarization is never seen on a normal ECG - it is buried inside the QRS complex.
- Costanzo Physiology, 7th Ed.
The ECG Paper
The ECG is printed on standard graph paper:
- Horizontal axis = time: Each small box = 0.04 sec (40 ms); each large box = 0.2 sec (200 ms)
- Vertical axis = voltage: Each small box = 0.1 mV; 10 mm = 1 mV
- Standard recording speed: 25 mm/sec
- A standard ECG records 10 seconds of cardiac activity
The 12 Leads
A 12-lead ECG records the heart from 12 different angles using 10 electrodes:
Limb leads (frontal plane):
- I, II, III - bipolar limb leads
- aVR, aVL, aVF - augmented unipolar limb leads
Precordial leads (horizontal plane):
- V1-V6 - chest leads
Standard grouping on the printed ECG: I/II/III | aVR/aVL/aVF | V1/V2/V3 | V4/V5/V6, each group recorded for 2.5 seconds simultaneously.
A Systematic Approach to Reading an ECG
Follow this order every time:
1. Rate
- Count large boxes between two R waves: divide 300 by that number (e.g., 3 large boxes = 100 bpm, 4 = 75 bpm, 5 = 60 bpm)
- For irregular rhythms: count QRS complexes in 10 seconds x 6
- Normal: 50-100 bpm
2. Rhythm
- Is it regular (equal R-R intervals)?
- Is every P wave followed by a QRS? Is every QRS preceded by a P?
- P waves present and upright in lead II = sinus rhythm
- No P waves + irregularly irregular = atrial fibrillation
3. Axis
- Check leads I and aVF:
- Both positive = normal axis (-30° to +90°)
- I positive, aVF negative = left axis deviation
- I negative, aVF positive = right axis deviation
- Both negative = extreme axis deviation
4. P Wave
- Duration < 120 ms, amplitude 2-3 mm
- Broad/notched in lead II = left atrial enlargement
- Tall/peaked (>2.5 mm) in lead II = right atrial enlargement
5. PR Interval
- Normal: 120-200 ms
-
200 ms = 1st-degree AV block
- Progressive lengthening then dropped beat = 2nd-degree AV block (Wenckebach)
- No relationship between P and QRS = 3rd-degree (complete) AV block
6. QRS Complex
- Normal: < 110 ms (< 3 small boxes)
- Wide QRS (> 120 ms) = bundle branch block or ventricular origin
- RBBB: rsR' in V1 ("bunny ears"), wide S in V5/V6
- LBBB: broad notched R in V5/V6, no septal Q in lateral leads
- Q waves > 1/3 height of QRS or > 1 small box wide = pathological (old infarct)
7. ST Segment
- Should be isoelectric (at baseline)
- Elevation in 2+ contiguous leads = STEMI or pericarditis
- Depression = ischemia (NSTEMI/unstable angina) or reciprocal change
- Saddle-shaped elevation in multiple leads = pericarditis
8. T Wave
- Should be upright in leads I, II, V3-V6
- Inverted in leads with ST elevation = ischemia/infarction
- Peaked T waves = hyperkalemia
9. QT Interval
- QTc (corrected): males ≤450 ms; females ≤460 ms
- Prolonged QT = risk of torsades de pointes (causes: drugs, hypokalemia, hypomagnesemia, congenital)
Quick Normal Values Summary
| Measurement | Normal |
|---|---|
| Heart rate | 50-100 bpm |
| PR interval | 120-200 ms |
| QRS duration | < 110 ms |
| QT (male) | ≤ 450 ms |
| QT (female) | ≤ 460 ms |
| QRS axis | -30° to +90° |
Sources: Goldman-Cecil Medicine (22e), Costanzo Physiology (7th Ed.), UNC School of Medicine ECG curriculum
Want to go deeper on any section - such as axis deviation, bundle branch blocks, STEMI localization, or arrhythmias?
This is a shared conversation. Sign in to Orris to start your own chat.